
|
|||||
|
 | |
| |
| |
| |
| |
| |
|
Gene: CSNK2B |
Gene summary for CSNK2B |
| Gene information | Species | Human | Gene symbol | CSNK2B | Gene ID | 1460 |
| Gene name | casein kinase 2 beta | |
| Gene Alias | CK2B | |
| Cytomap | 6p21.33 | |
| Gene Type | protein-coding | GO ID | GO:0001667 | UniProtAcc | A0A1U9X7J2 |
Top |
Malignant transformation analysis |
| Identification of the aberrant gene expression in precancerous and cancerous lesions by comparing the gene expression of stem-like cells in diseased tissues with normal stem cells |
| Entrez ID | Symbol | Replicates | Species | Organ | Tissue | Adj P-value | Log2FC | Malignancy |
| 1460 | CSNK2B | CA_HPV_1 | Human | Cervix | CC | 2.11e-03 | -1.68e-01 | 0.0264 |
| 1460 | CSNK2B | N_HPV_2 | Human | Cervix | N_HPV | 7.03e-03 | 1.12e-01 | -0.0131 |
| 1460 | CSNK2B | CCI_1 | Human | Cervix | CC | 8.24e-06 | -5.08e-01 | 0.528 |
| 1460 | CSNK2B | CCI_2 | Human | Cervix | CC | 3.20e-05 | -5.08e-01 | 0.5249 |
| 1460 | CSNK2B | CCI_3 | Human | Cervix | CC | 3.50e-08 | -5.08e-01 | 0.516 |
| 1460 | CSNK2B | CCII_1 | Human | Cervix | CC | 8.11e-12 | -5.08e-01 | 0.3249 |
| 1460 | CSNK2B | sample3 | Human | Cervix | CC | 5.58e-07 | 1.96e-01 | 0.1387 |
| 1460 | CSNK2B | T3 | Human | Cervix | CC | 2.74e-07 | 2.19e-01 | 0.1389 |
| 1460 | CSNK2B | HTA11_3410_2000001011 | Human | Colorectum | AD | 5.63e-18 | 3.46e-01 | 0.0155 |
| 1460 | CSNK2B | HTA11_2487_2000001011 | Human | Colorectum | SER | 7.75e-24 | 5.54e-01 | -0.1808 |
| 1460 | CSNK2B | HTA11_2951_2000001011 | Human | Colorectum | AD | 3.03e-06 | 3.36e-01 | 0.0216 |
| 1460 | CSNK2B | HTA11_1938_2000001011 | Human | Colorectum | AD | 2.05e-20 | 6.33e-01 | -0.0811 |
| 1460 | CSNK2B | HTA11_78_2000001011 | Human | Colorectum | AD | 3.40e-20 | 4.49e-01 | -0.1088 |
| 1460 | CSNK2B | HTA11_347_2000001011 | Human | Colorectum | AD | 5.03e-52 | 7.85e-01 | -0.1954 |
| 1460 | CSNK2B | HTA11_411_2000001011 | Human | Colorectum | SER | 6.42e-18 | 9.53e-01 | -0.2602 |
| 1460 | CSNK2B | HTA11_2112_2000001011 | Human | Colorectum | SER | 2.75e-12 | 7.74e-01 | -0.2196 |
| 1460 | CSNK2B | HTA11_3361_2000001011 | Human | Colorectum | AD | 1.74e-18 | 5.72e-01 | -0.1207 |
| 1460 | CSNK2B | HTA11_83_2000001011 | Human | Colorectum | SER | 4.15e-23 | 5.85e-01 | -0.1526 |
| 1460 | CSNK2B | HTA11_696_2000001011 | Human | Colorectum | AD | 2.49e-45 | 7.53e-01 | -0.1464 |
| 1460 | CSNK2B | HTA11_866_2000001011 | Human | Colorectum | AD | 9.10e-25 | 4.62e-01 | -0.1001 |
| Page: 1 2 3 4 5 6 7 8 9 10 |
| Tissue | Expression Dynamics | Abbreviation |
| Cervix | 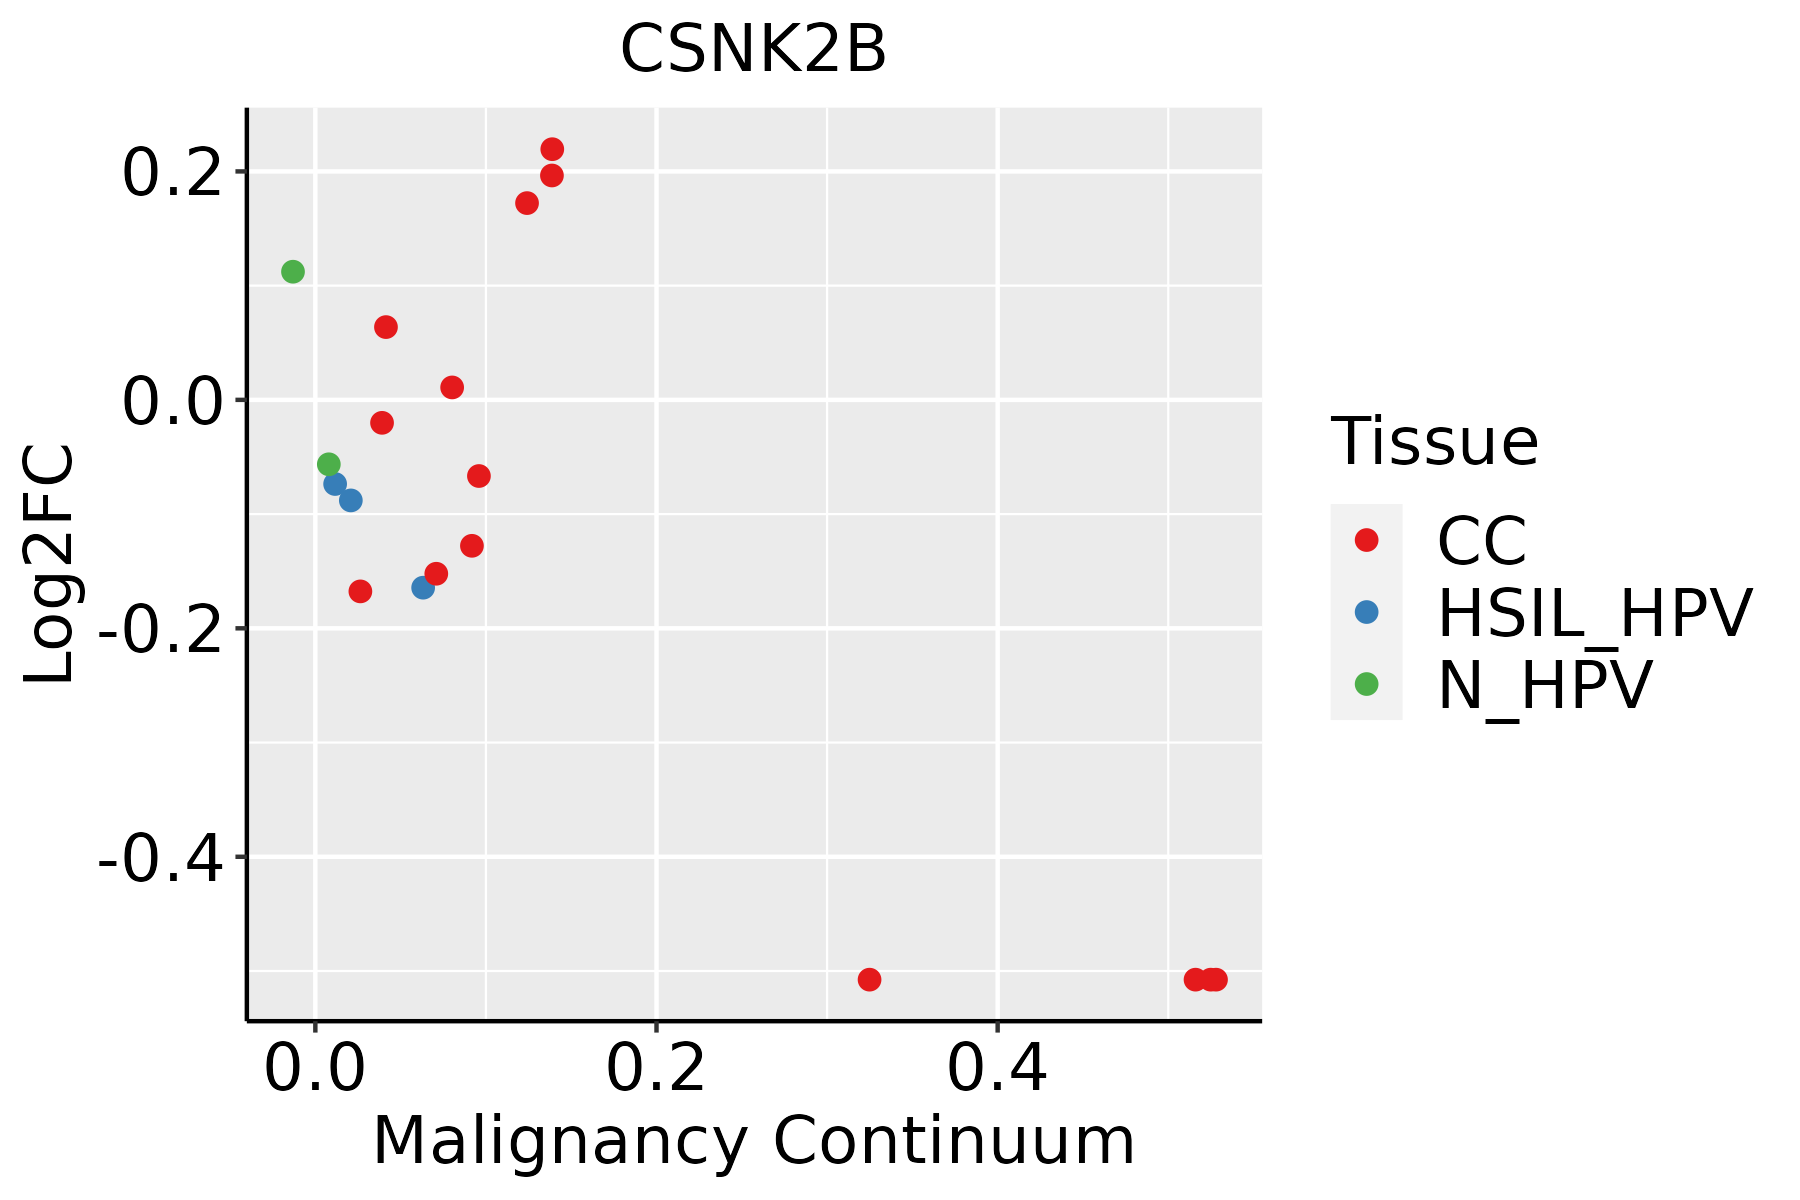 | CC: Cervix cancer |
| HSIL_HPV: HPV-infected high-grade squamous intraepithelial lesions | ||
| N_HPV: HPV-infected normal cervix | ||
| Colorectum (GSE201348) |  | FAP: Familial adenomatous polyposis |
| CRC: Colorectal cancer | ||
| Colorectum (HTA11) |  | AD: Adenomas |
| SER: Sessile serrated lesions | ||
| MSI-H: Microsatellite-high colorectal cancer | ||
| MSS: Microsatellite stable colorectal cancer | ||
| Endometrium |  | AEH: Atypical endometrial hyperplasia |
| EEC: Endometrioid Cancer | ||
| Esophagus | 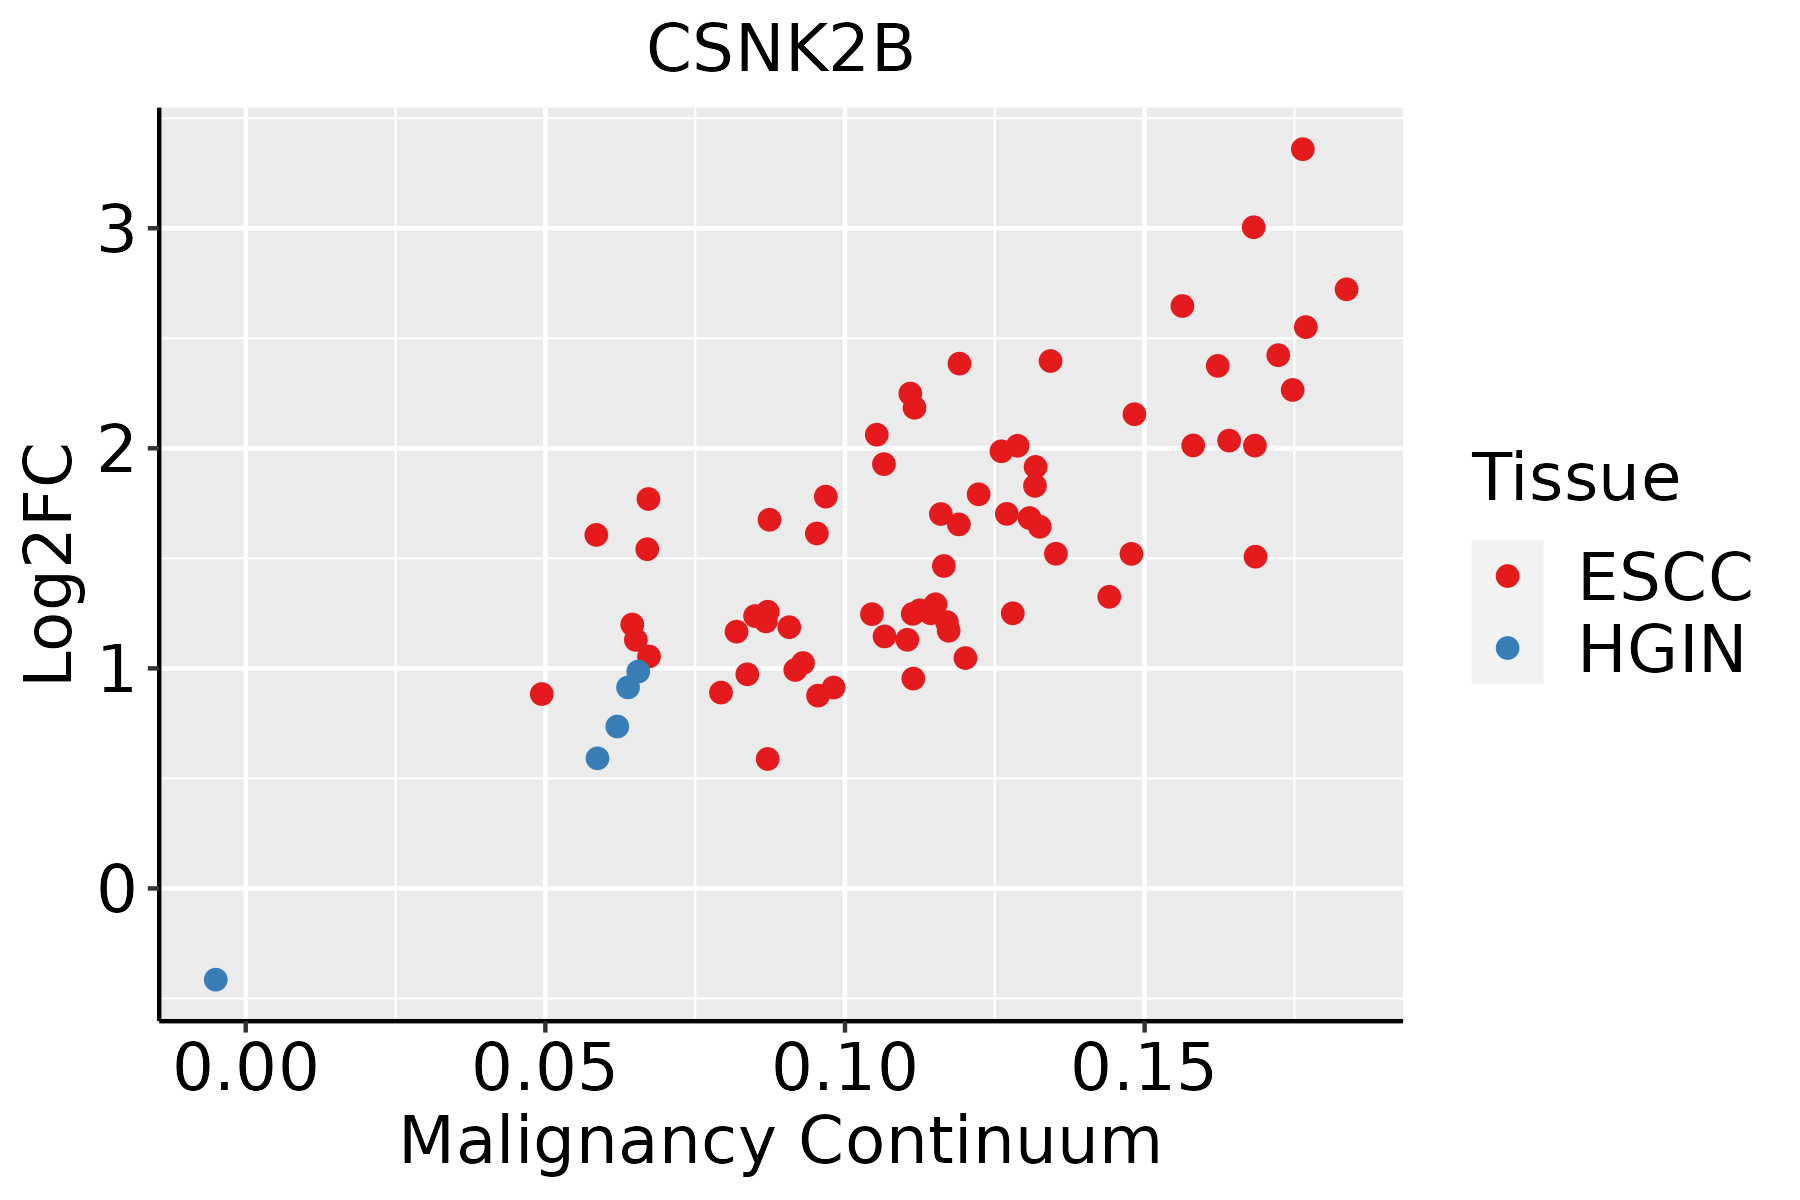 | ESCC: Esophageal squamous cell carcinoma |
| HGIN: High-grade intraepithelial neoplasias | ||
| LGIN: Low-grade intraepithelial neoplasias | ||
| Liver | 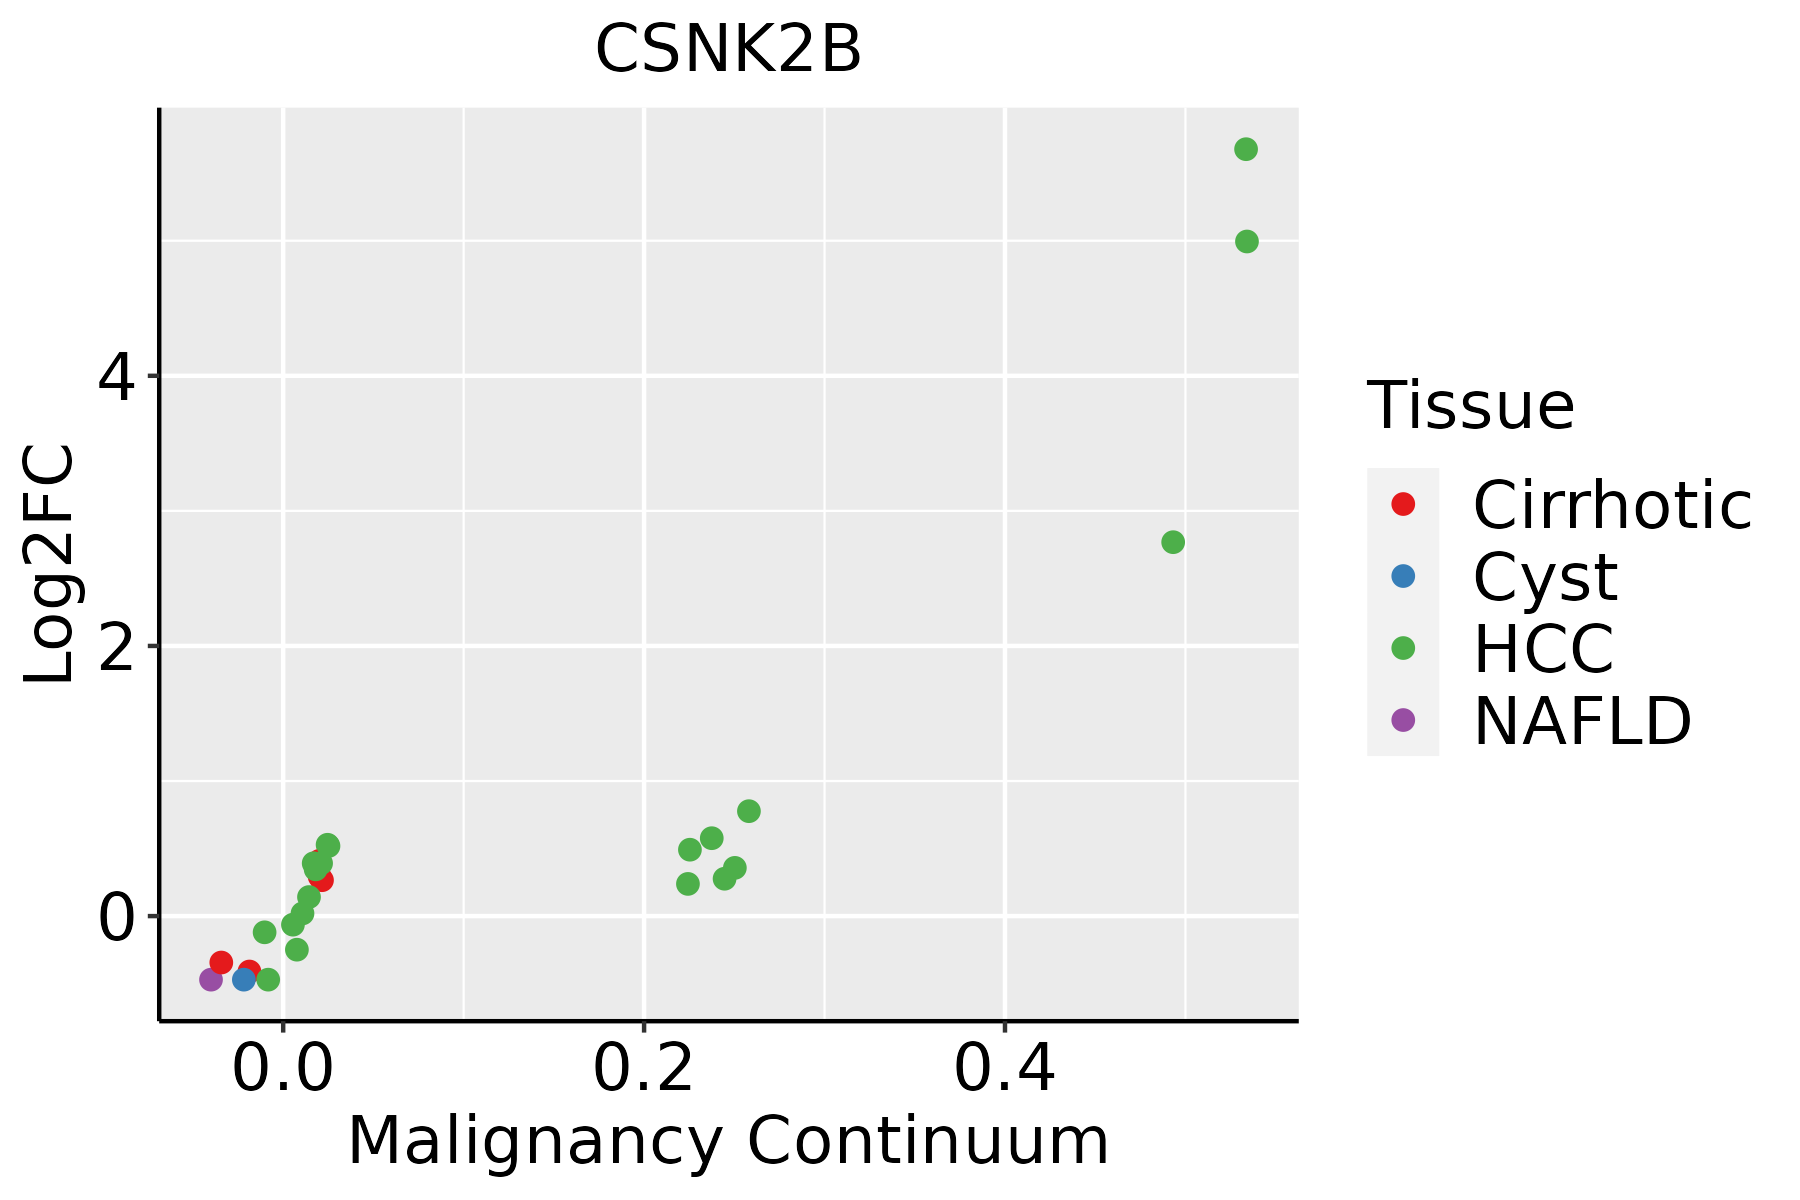 | HCC: Hepatocellular carcinoma |
| NAFLD: Non-alcoholic fatty liver disease | ||
| Oral Cavity | 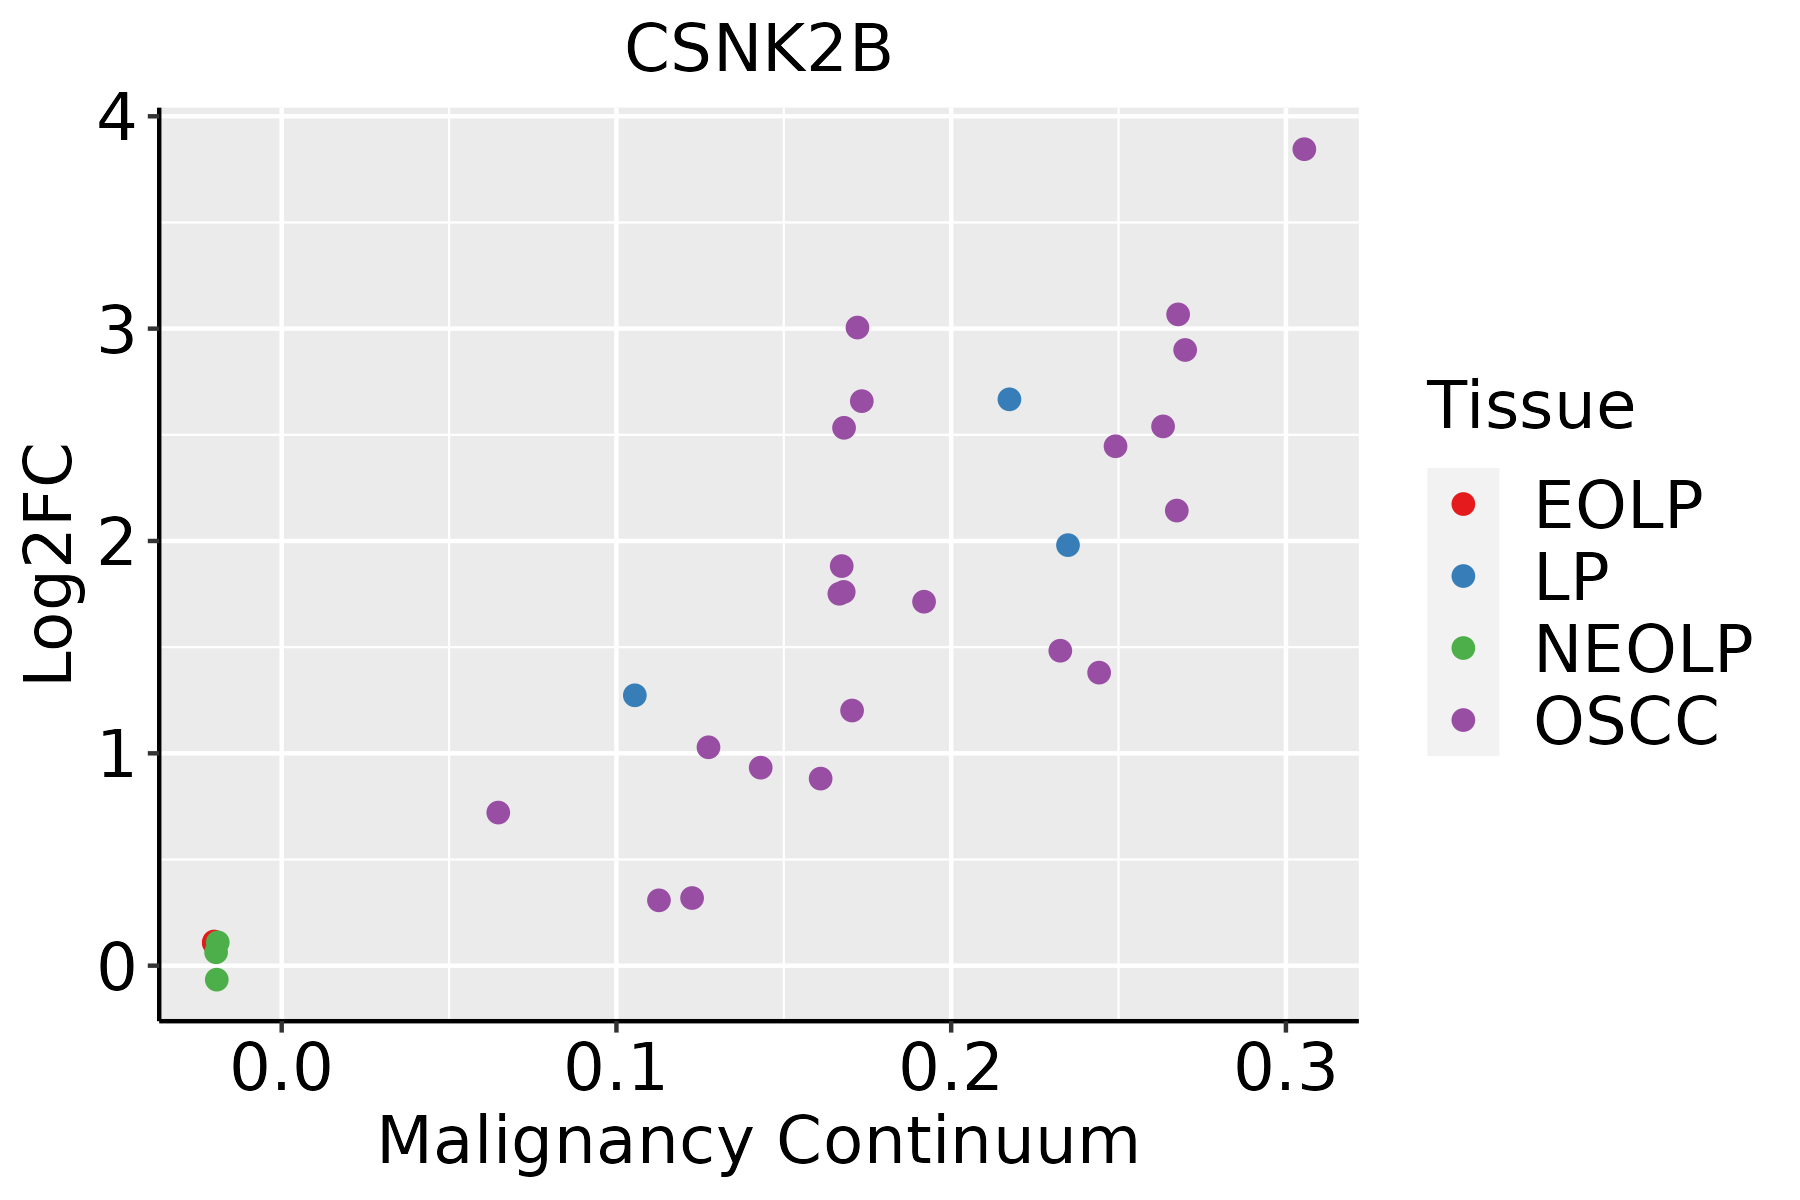 | EOLP: Erosive Oral lichen planus |
| LP: leukoplakia | ||
| NEOLP: Non-erosive oral lichen planus | ||
| OSCC: Oral squamous cell carcinoma | ||
| Prostate | 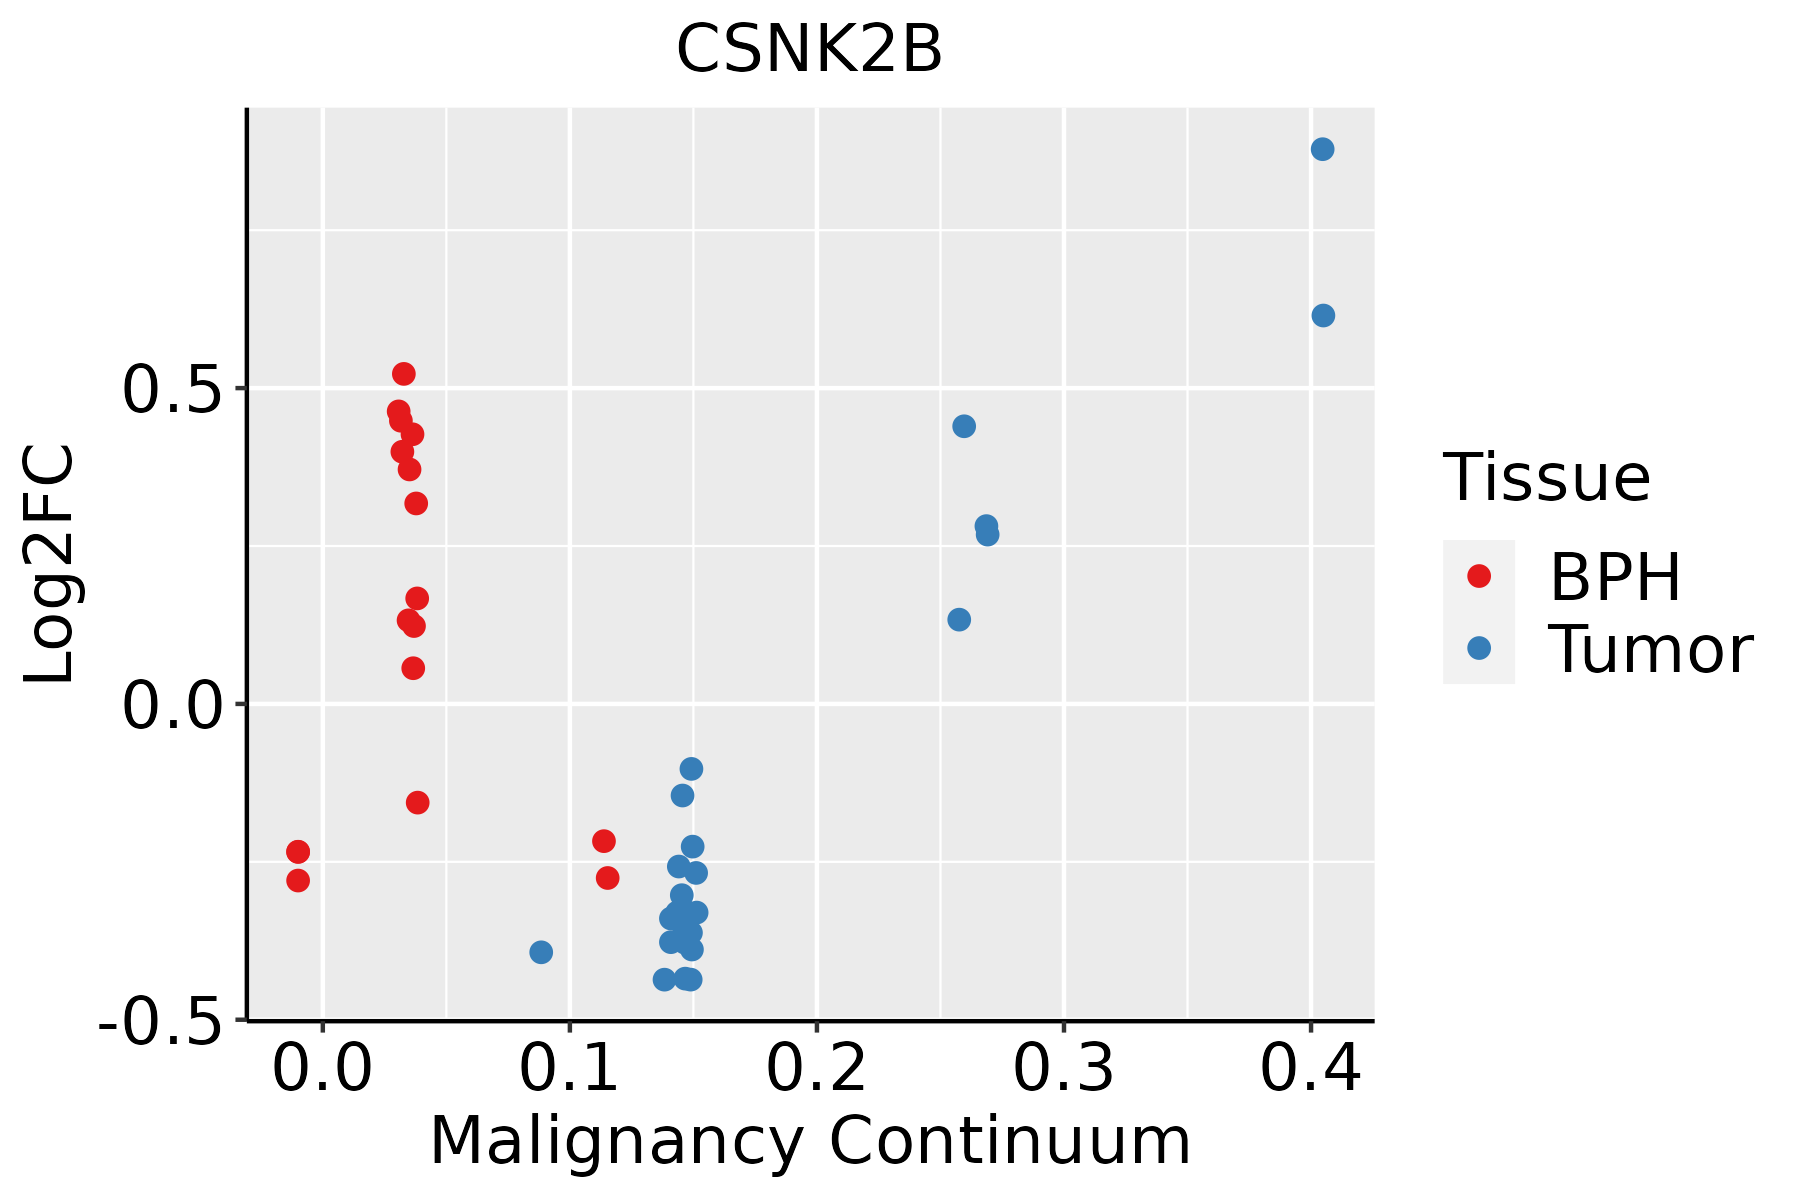 | BPH: Benign Prostatic Hyperplasia |
| Skin | 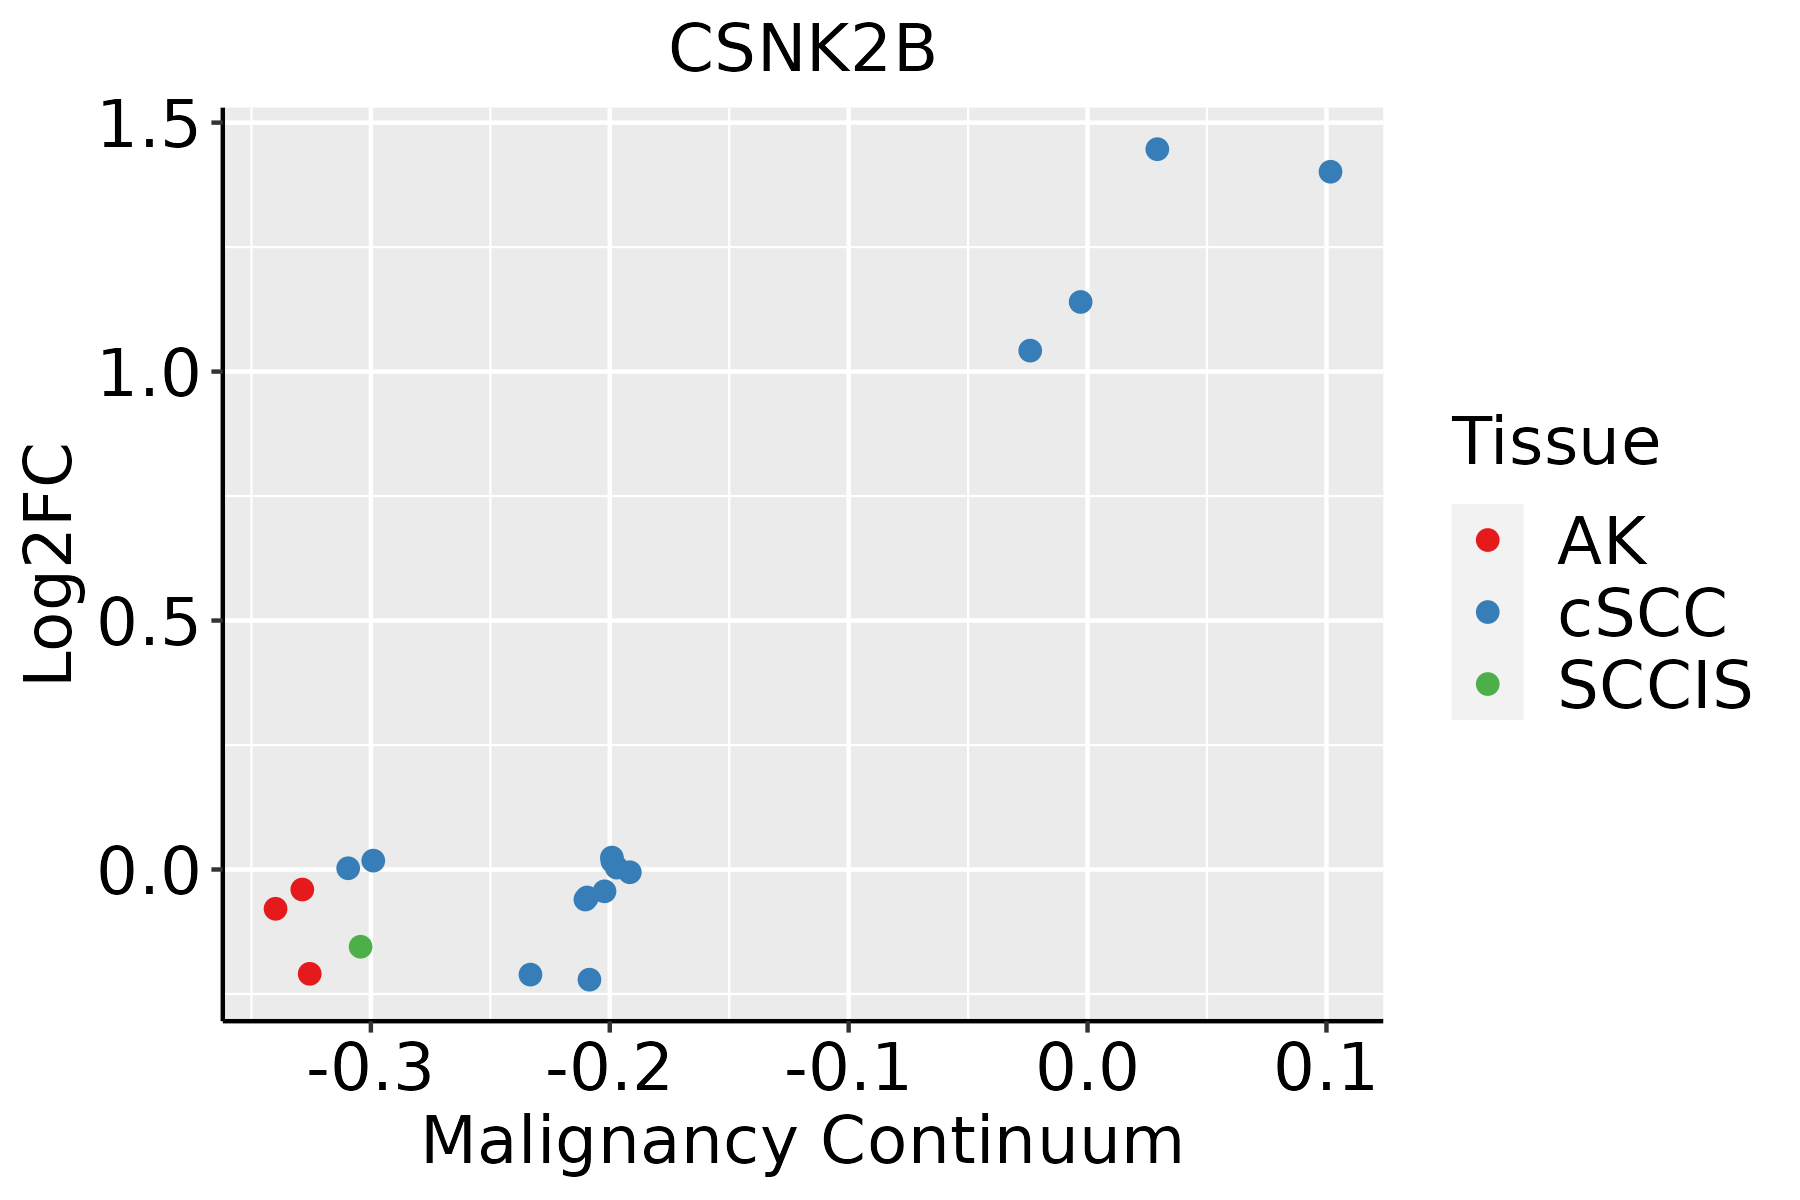 | AK: Actinic keratosis |
| cSCC: Cutaneous squamous cell carcinoma | ||
| SCCIS:squamous cell carcinoma in situ | ||
| Thyroid | 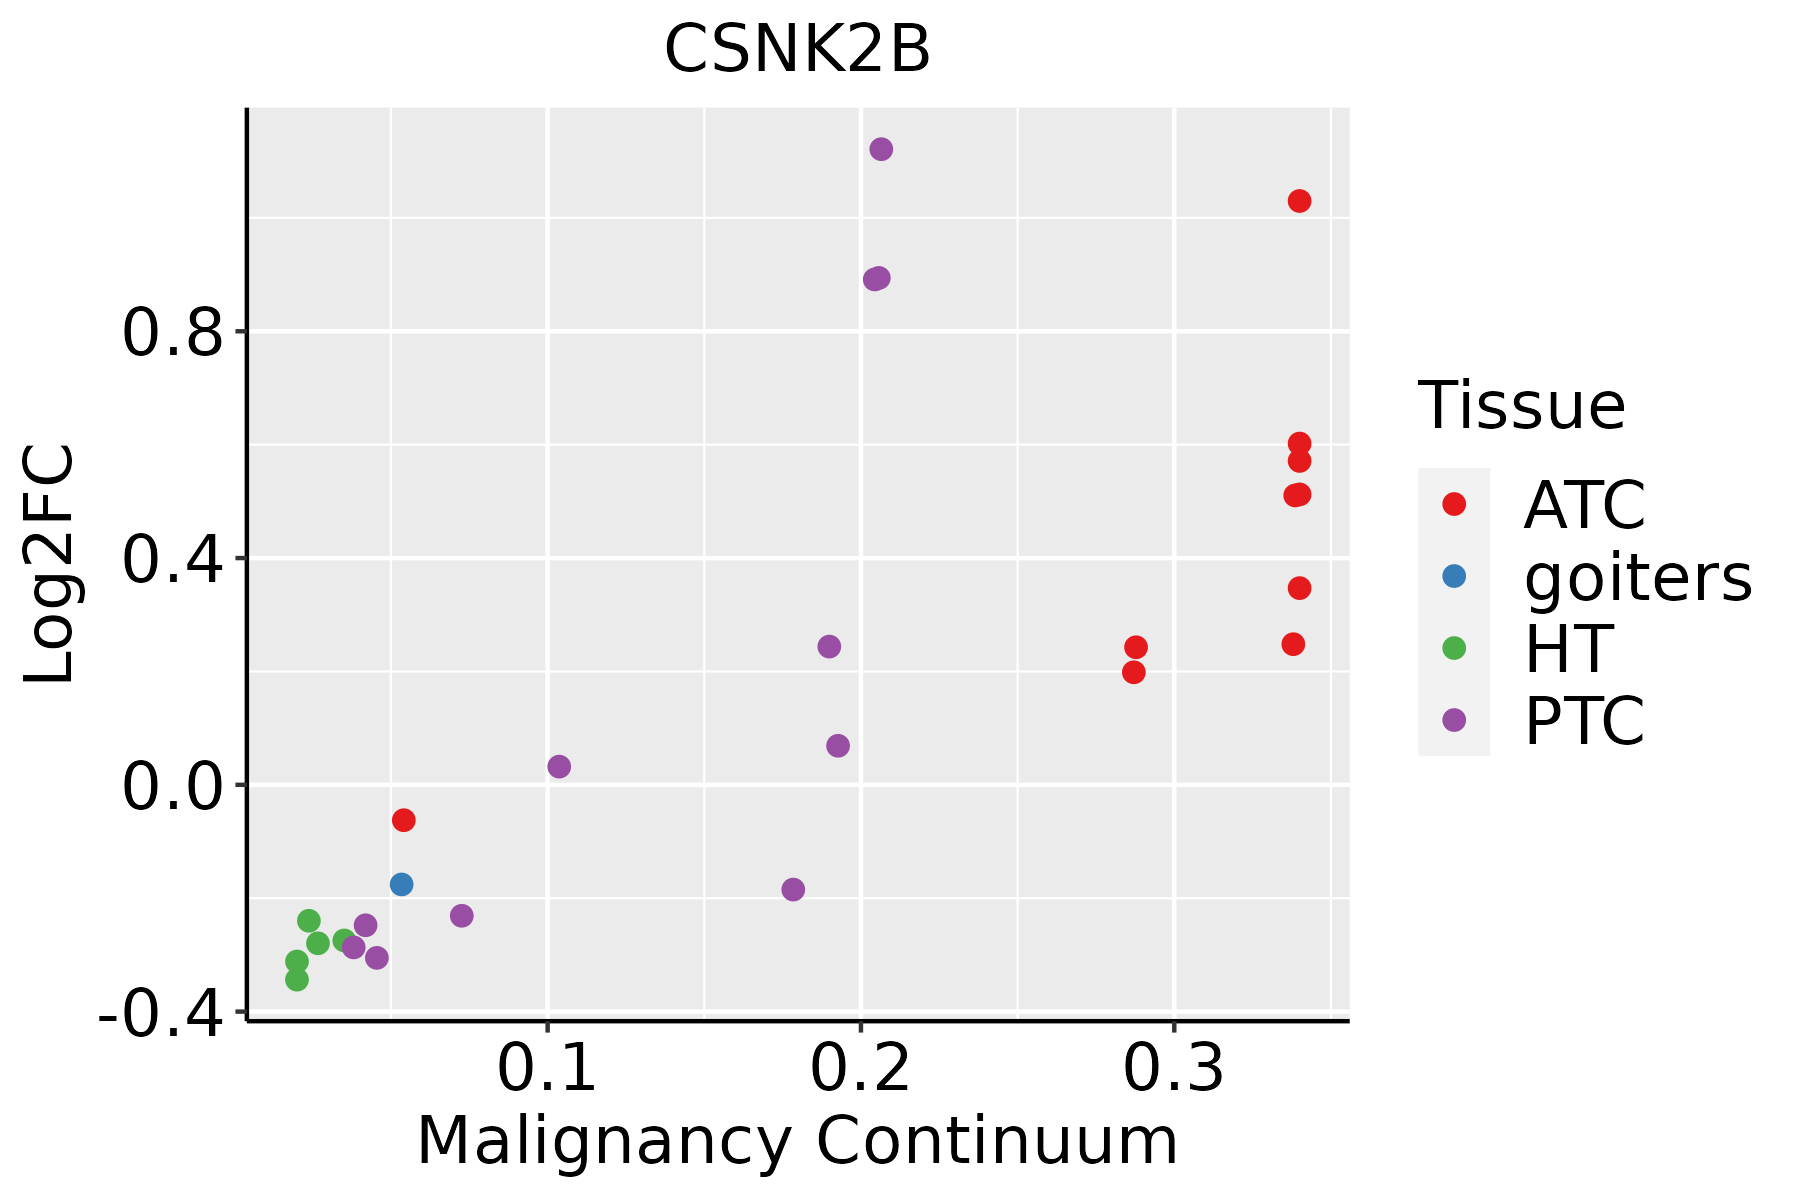 | ATC: Anaplastic thyroid cancer |
| HT: Hashimoto's thyroiditis | ||
| PTC: Papillary thyroid cancer |
| ∗log2FC in expression of this searched gene in stem-like cells from each diseased tissue sample relative to stem-like cells in normal samples in each tissue plotted against the malignancy continuum. Samples are colored based on if they are from different disease stage. |
Top |
Malignant transformation related pathway analysis |
| Find out the enriched GO biological processes and KEGG pathways involved in transition from healthy to precancer to cancer |
| Tissue | Disease Stage | Enriched GO biological Processes |
| Colorectum | AD |  |
| Colorectum | SER |  |
| Colorectum | MSS |  |
| Colorectum | MSI-H |  |
| Colorectum | FAP |  |
| ∗Top 15 enriched GO BP terms are showed in the bar plot of each disease state in each tissue. Each row represents a significant GO biological process which is colored according to the -log10(p.adjust). |
| Page: 1 2 3 4 5 6 7 8 9 |
| GO ID | Tissue | Disease Stage | Description | Gene Ratio | Bg Ratio | pvalue | p.adjust | Count |
| GO:009013210 | Cervix | CC | epithelium migration | 90/2311 | 360/18723 | 2.45e-11 | 6.11e-09 | 90 |
| GO:00016679 | Cervix | CC | ameboidal-type cell migration | 110/2311 | 475/18723 | 2.66e-11 | 6.36e-09 | 110 |
| GO:001063110 | Cervix | CC | epithelial cell migration | 89/2311 | 357/18723 | 3.72e-11 | 8.54e-09 | 89 |
| GO:009013010 | Cervix | CC | tissue migration | 90/2311 | 365/18723 | 5.42e-11 | 1.05e-08 | 90 |
| GO:001063210 | Cervix | CC | regulation of epithelial cell migration | 72/2311 | 292/18723 | 4.52e-09 | 4.43e-07 | 72 |
| GO:00160557 | Cervix | CC | Wnt signaling pathway | 98/2311 | 444/18723 | 4.82e-09 | 4.65e-07 | 98 |
| GO:01987387 | Cervix | CC | cell-cell signaling by wnt | 98/2311 | 446/18723 | 6.16e-09 | 5.58e-07 | 98 |
| GO:005109810 | Cervix | CC | regulation of binding | 80/2311 | 363/18723 | 1.32e-07 | 6.42e-06 | 80 |
| GO:00435427 | Cervix | CC | endothelial cell migration | 60/2311 | 279/18723 | 1.05e-05 | 2.33e-04 | 60 |
| GO:00105944 | Cervix | CC | regulation of endothelial cell migration | 52/2311 | 232/18723 | 1.20e-05 | 2.54e-04 | 52 |
| GO:00064708 | Cervix | CC | protein dephosphorylation | 60/2311 | 281/18723 | 1.33e-05 | 2.68e-04 | 60 |
| GO:00310996 | Cervix | CC | regeneration | 46/2311 | 198/18723 | 1.43e-05 | 2.84e-04 | 46 |
| GO:190165410 | Cervix | CC | response to ketone | 45/2311 | 194/18723 | 1.83e-05 | 3.44e-04 | 45 |
| GO:004873210 | Cervix | CC | gland development | 84/2311 | 436/18723 | 1.93e-05 | 3.54e-04 | 84 |
| GO:00512713 | Cervix | CC | negative regulation of cellular component movement | 73/2311 | 367/18723 | 2.22e-05 | 3.95e-04 | 73 |
| GO:005110110 | Cervix | CC | regulation of DNA binding | 31/2311 | 118/18723 | 2.91e-05 | 4.81e-04 | 31 |
| GO:00400133 | Cervix | CC | negative regulation of locomotion | 76/2311 | 391/18723 | 3.47e-05 | 5.60e-04 | 76 |
| GO:20001463 | Cervix | CC | negative regulation of cell motility | 71/2311 | 359/18723 | 3.47e-05 | 5.60e-04 | 71 |
| GO:00303363 | Cervix | CC | negative regulation of cell migration | 68/2311 | 344/18723 | 5.11e-05 | 7.70e-04 | 68 |
| GO:00436668 | Cervix | CC | regulation of phosphoprotein phosphatase activity | 18/2311 | 58/18723 | 1.40e-04 | 1.70e-03 | 18 |
| Page: 1 2 3 4 5 6 7 8 9 10 11 12 13 14 15 16 17 18 19 20 21 22 23 24 25 26 27 28 29 30 31 |
| Pathway ID | Tissue | Disease Stage | Description | Gene Ratio | Bg Ratio | pvalue | p.adjust | qvalue | Count |
| hsa0502018 | Cervix | CC | Prion disease | 98/1267 | 273/8465 | 2.64e-18 | 1.42e-16 | 8.42e-17 | 98 |
| hsa0501018 | Cervix | CC | Alzheimer disease | 113/1267 | 384/8465 | 9.67e-14 | 3.92e-12 | 2.32e-12 | 113 |
| hsa0502218 | Cervix | CC | Pathways of neurodegeneration - multiple diseases | 128/1267 | 476/8465 | 2.87e-12 | 9.29e-11 | 5.50e-11 | 128 |
| hsa0452020 | Cervix | CC | Adherens junction | 33/1267 | 93/8465 | 6.99e-07 | 7.31e-06 | 4.32e-06 | 33 |
| hsa043109 | Cervix | CC | Wnt signaling pathway | 43/1267 | 171/8465 | 3.03e-04 | 1.64e-03 | 9.68e-04 | 43 |
| hsa0502019 | Cervix | CC | Prion disease | 98/1267 | 273/8465 | 2.64e-18 | 1.42e-16 | 8.42e-17 | 98 |
| hsa0501019 | Cervix | CC | Alzheimer disease | 113/1267 | 384/8465 | 9.67e-14 | 3.92e-12 | 2.32e-12 | 113 |
| hsa0502219 | Cervix | CC | Pathways of neurodegeneration - multiple diseases | 128/1267 | 476/8465 | 2.87e-12 | 9.29e-11 | 5.50e-11 | 128 |
| hsa04520110 | Cervix | CC | Adherens junction | 33/1267 | 93/8465 | 6.99e-07 | 7.31e-06 | 4.32e-06 | 33 |
| hsa0431012 | Cervix | CC | Wnt signaling pathway | 43/1267 | 171/8465 | 3.03e-04 | 1.64e-03 | 9.68e-04 | 43 |
| hsa0502044 | Cervix | N_HPV | Prion disease | 39/349 | 273/8465 | 6.07e-12 | 4.13e-10 | 3.23e-10 | 39 |
| hsa0502244 | Cervix | N_HPV | Pathways of neurodegeneration - multiple diseases | 47/349 | 476/8465 | 1.48e-08 | 3.13e-07 | 2.45e-07 | 47 |
| hsa0501044 | Cervix | N_HPV | Alzheimer disease | 41/349 | 384/8465 | 1.50e-08 | 3.13e-07 | 2.45e-07 | 41 |
| hsa0413724 | Cervix | N_HPV | Mitophagy - animal | 10/349 | 72/8465 | 6.84e-04 | 5.03e-03 | 3.93e-03 | 10 |
| hsa0502054 | Cervix | N_HPV | Prion disease | 39/349 | 273/8465 | 6.07e-12 | 4.13e-10 | 3.23e-10 | 39 |
| hsa0502254 | Cervix | N_HPV | Pathways of neurodegeneration - multiple diseases | 47/349 | 476/8465 | 1.48e-08 | 3.13e-07 | 2.45e-07 | 47 |
| hsa0501054 | Cervix | N_HPV | Alzheimer disease | 41/349 | 384/8465 | 1.50e-08 | 3.13e-07 | 2.45e-07 | 41 |
| hsa0413734 | Cervix | N_HPV | Mitophagy - animal | 10/349 | 72/8465 | 6.84e-04 | 5.03e-03 | 3.93e-03 | 10 |
| hsa05010 | Colorectum | AD | Alzheimer disease | 174/2092 | 384/8465 | 1.82e-19 | 9.26e-18 | 5.91e-18 | 174 |
| hsa05020 | Colorectum | AD | Prion disease | 133/2092 | 273/8465 | 2.47e-18 | 8.29e-17 | 5.29e-17 | 133 |
| Page: 1 2 3 4 5 6 7 8 9 10 11 |
Top |
Cell-cell communication analysis |
| Identification of potential cell-cell interactions between two cell types and their ligand-receptor pairs for different disease states |
| Ligand | Receptor | LRpair | Pathway | Tissue | Disease Stage |
| Page: 1 |
Top |
Single-cell gene regulatory network inference analysis |
| Find out the significant the regulons (TFs) and the target genes of each regulon across cell types for different disease states |
| TF | Cell Type | Tissue | Disease Stage | Target Gene | RSS | Regulon Activity |
| ∗The dot plots of a searched regulon are shown for all cell subpopulations in each disease state of each tissue based on the regulon specific score inferred using pySCENIC and by calculating the average expression. |
| Page: 1 |
Top |
Somatic mutation of malignant transformation related genes |
| Annotation of somatic variants for genes involved in malignant transformation |
| Hugo Symbol | Variant Class | Variant Classification | dbSNP RS | HGVSc | HGVSp | HGVSp Short | SWISSPROT | BIOTYPE | SIFT | PolyPhen | Tumor Sample Barcode | Tissue | Histology | Sex | Age | Stage | Therapy Types | Drugs | Outcome |
| CSNK2B | SNV | Missense_Mutation | novel | c.70G>A | p.Glu24Lys | p.E24K | P67870 | protein_coding | deleterious(0.01) | possibly_damaging(0.904) | TCGA-EW-A1PB-01 | Breast | breast invasive carcinoma | Female | >=65 | III/IV | Unknown | Unknown | SD |
| CSNK2B | SNV | Missense_Mutation | novel | c.283N>A | p.Ala95Thr | p.A95T | P67870 | protein_coding | tolerated(0.18) | benign(0.035) | TCGA-S3-A6ZH-01 | Breast | breast invasive carcinoma | Female | <65 | III/IV | Chemotherapy | adriamycin | CR |
| CSNK2B | SNV | Missense_Mutation | c.608N>T | p.Ala203Val | p.A203V | P67870 | protein_coding | tolerated(0.11) | benign(0) | TCGA-AA-3710-01 | Colorectum | colon adenocarcinoma | Female | >=65 | I/II | Unknown | Unknown | SD | |
| CSNK2B | SNV | Missense_Mutation | c.377N>G | p.Asp126Gly | p.D126G | P67870 | protein_coding | deleterious(0) | probably_damaging(0.993) | TCGA-AD-A5EJ-01 | Colorectum | colon adenocarcinoma | Female | >=65 | I/II | Unknown | Unknown | SD | |
| CSNK2B | SNV | Missense_Mutation | c.52N>A | p.Gly18Ser | p.G18S | P67870 | protein_coding | deleterious(0.02) | probably_damaging(1) | TCGA-CK-4951-01 | Colorectum | colon adenocarcinoma | Female | >=65 | I/II | Unknown | Unknown | PD | |
| CSNK2B | SNV | Missense_Mutation | novel | c.553N>T | p.Pro185Ser | p.P185S | P67870 | protein_coding | deleterious(0.02) | benign(0.409) | TCGA-G4-6320-01 | Colorectum | colon adenocarcinoma | Male | >=65 | III/IV | Chemotherapy | oxaliplatin | SD |
| CSNK2B | SNV | Missense_Mutation | novel | c.638C>T | p.Thr213Met | p.T213M | P67870 | protein_coding | tolerated_low_confidence(0.13) | benign(0.033) | TCGA-F5-6814-01 | Colorectum | rectum adenocarcinoma | Male | <65 | I/II | Unknown | Unknown | SD |
| CSNK2B | SNV | Missense_Mutation | novel | c.295G>A | p.Glu99Lys | p.E99K | P67870 | protein_coding | deleterious(0.02) | benign(0.053) | TCGA-AX-A2HH-01 | Endometrium | uterine corpus endometrioid carcinoma | Female | <65 | I/II | Unknown | Unknown | SD |
| CSNK2B | SNV | Missense_Mutation | c.253N>A | p.Ala85Thr | p.A85T | P67870 | protein_coding | deleterious(0.01) | probably_damaging(0.961) | TCGA-D1-A1NY-01 | Endometrium | uterine corpus endometrioid carcinoma | Female | >=65 | I/II | Chemotherapy | carboplatin | SD | |
| CSNK2B | SNV | Missense_Mutation | novel | c.101N>G | p.Phe34Cys | p.F34C | P67870 | protein_coding | deleterious(0) | probably_damaging(0.999) | TCGA-E6-A1M0-01 | Endometrium | uterine corpus endometrioid carcinoma | Female | <65 | III/IV | Chemotherapy | carboplatin | SD |
| Page: 1 2 |
Top |
Related drugs of malignant transformation related genes |
| Identification of chemicals and drugs interact with genes involved in malignant transfromation |
| (DGIdb 4.0) |
| Entrez ID | Symbol | Category | Interaction Types | Drug Claim Name | Drug Name | PMIDs |
| Page: 1 |

Copyright 2023-Present -The University of Texas Health Science Center at Houston |