
|
|||||
|
 | |
| |
| |
| |
| |
| |
|
Gene: CSNK2A1 |
Gene summary for CSNK2A1 |
| Gene information | Species | Human | Gene symbol | CSNK2A1 | Gene ID | 1457 |
| Gene name | casein kinase 2 alpha 1 | |
| Gene Alias | CK2A1 | |
| Cytomap | 20p13 | |
| Gene Type | protein-coding | GO ID | GO:0001558 | UniProtAcc | P68400 |
Top |
Malignant transformation analysis |
| Identification of the aberrant gene expression in precancerous and cancerous lesions by comparing the gene expression of stem-like cells in diseased tissues with normal stem cells |
| Entrez ID | Symbol | Replicates | Species | Organ | Tissue | Adj P-value | Log2FC | Malignancy |
| 1457 | CSNK2A1 | GSM4909292 | Human | Breast | IDC | 4.51e-05 | 5.92e-01 | 0.1236 |
| 1457 | CSNK2A1 | GSM4909293 | Human | Breast | IDC | 4.40e-25 | 6.13e-01 | 0.1581 |
| 1457 | CSNK2A1 | GSM4909296 | Human | Breast | IDC | 1.70e-04 | -1.01e-01 | 0.1524 |
| 1457 | CSNK2A1 | GSM4909297 | Human | Breast | IDC | 6.24e-04 | -7.29e-02 | 0.1517 |
| 1457 | CSNK2A1 | GSM4909298 | Human | Breast | IDC | 1.95e-02 | 2.13e-01 | 0.1551 |
| 1457 | CSNK2A1 | GSM4909311 | Human | Breast | IDC | 1.33e-18 | -9.43e-02 | 0.1534 |
| 1457 | CSNK2A1 | GSM4909312 | Human | Breast | IDC | 5.15e-08 | 9.35e-02 | 0.1552 |
| 1457 | CSNK2A1 | GSM4909317 | Human | Breast | IDC | 7.08e-06 | 4.04e-01 | 0.1355 |
| 1457 | CSNK2A1 | GSM4909319 | Human | Breast | IDC | 6.61e-18 | -1.95e-01 | 0.1563 |
| 1457 | CSNK2A1 | GSM4909320 | Human | Breast | IDC | 2.00e-05 | -2.10e-02 | 0.1575 |
| 1457 | CSNK2A1 | GSM4909321 | Human | Breast | IDC | 4.32e-09 | -1.27e-01 | 0.1559 |
| 1457 | CSNK2A1 | ctrl6 | Human | Breast | Precancer | 2.48e-02 | 3.24e-01 | -0.0061 |
| 1457 | CSNK2A1 | M2 | Human | Breast | IDC | 4.29e-02 | 3.39e-01 | 0.21 |
| 1457 | CSNK2A1 | P1 | Human | Breast | IDC | 2.83e-09 | 8.31e-02 | 0.1527 |
| 1457 | CSNK2A1 | DCIS2 | Human | Breast | DCIS | 6.46e-55 | 1.62e-01 | 0.0085 |
| 1457 | CSNK2A1 | CA_HPV_3 | Human | Cervix | CC | 7.54e-05 | 1.41e-02 | 0.0414 |
| 1457 | CSNK2A1 | CCI_2 | Human | Cervix | CC | 3.21e-03 | 5.26e-01 | 0.5249 |
| 1457 | CSNK2A1 | CCI_3 | Human | Cervix | CC | 5.26e-04 | 5.16e-01 | 0.516 |
| 1457 | CSNK2A1 | sample3 | Human | Cervix | CC | 4.64e-05 | 1.20e-01 | 0.1387 |
| 1457 | CSNK2A1 | T3 | Human | Cervix | CC | 2.84e-03 | 1.30e-01 | 0.1389 |
| Page: 1 2 3 4 5 6 7 8 9 |
| Tissue | Expression Dynamics | Abbreviation |
| Breast | 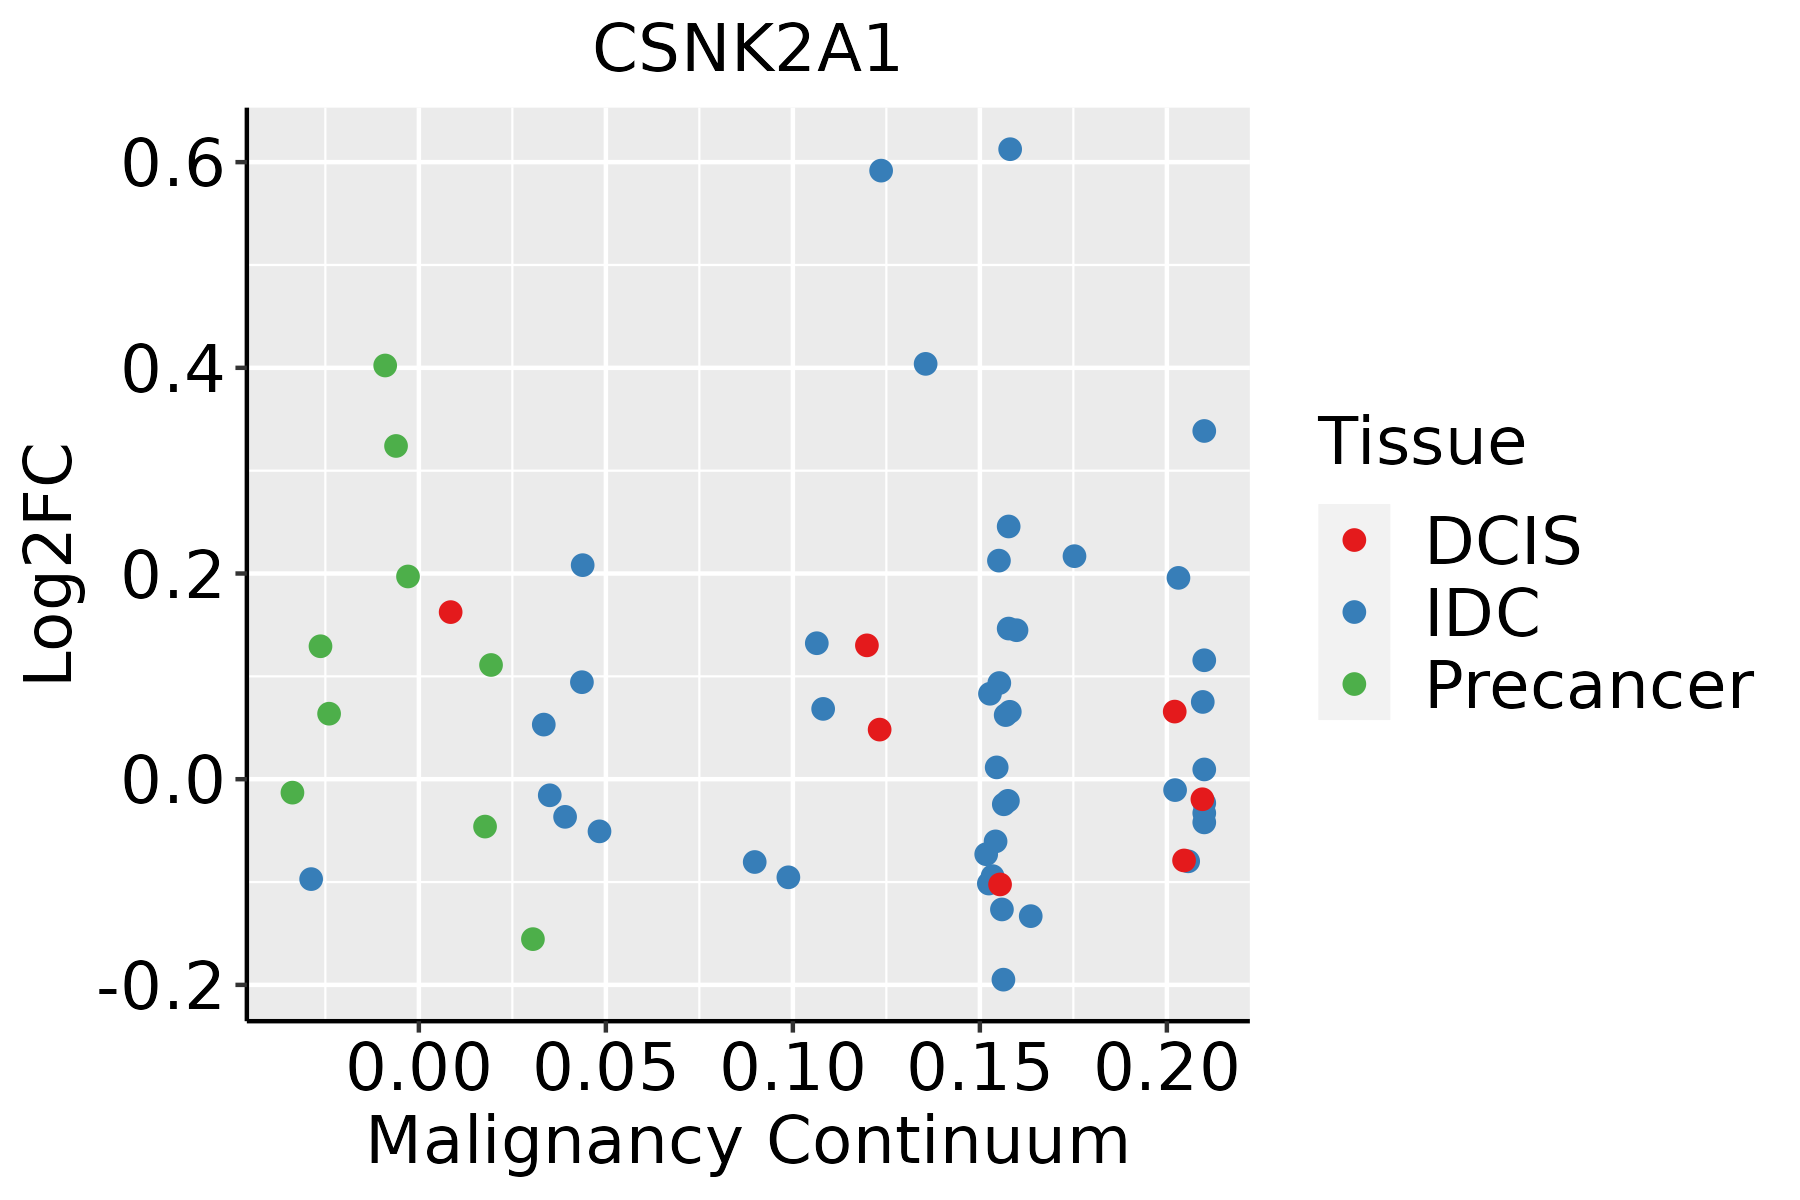 | IDC: Invasive ductal carcinoma |
| DCIS: Ductal carcinoma in situ | ||
| Precancer(BRCA1-mut): Precancerous lesion from BRCA1 mutation carriers | ||
| Cervix | 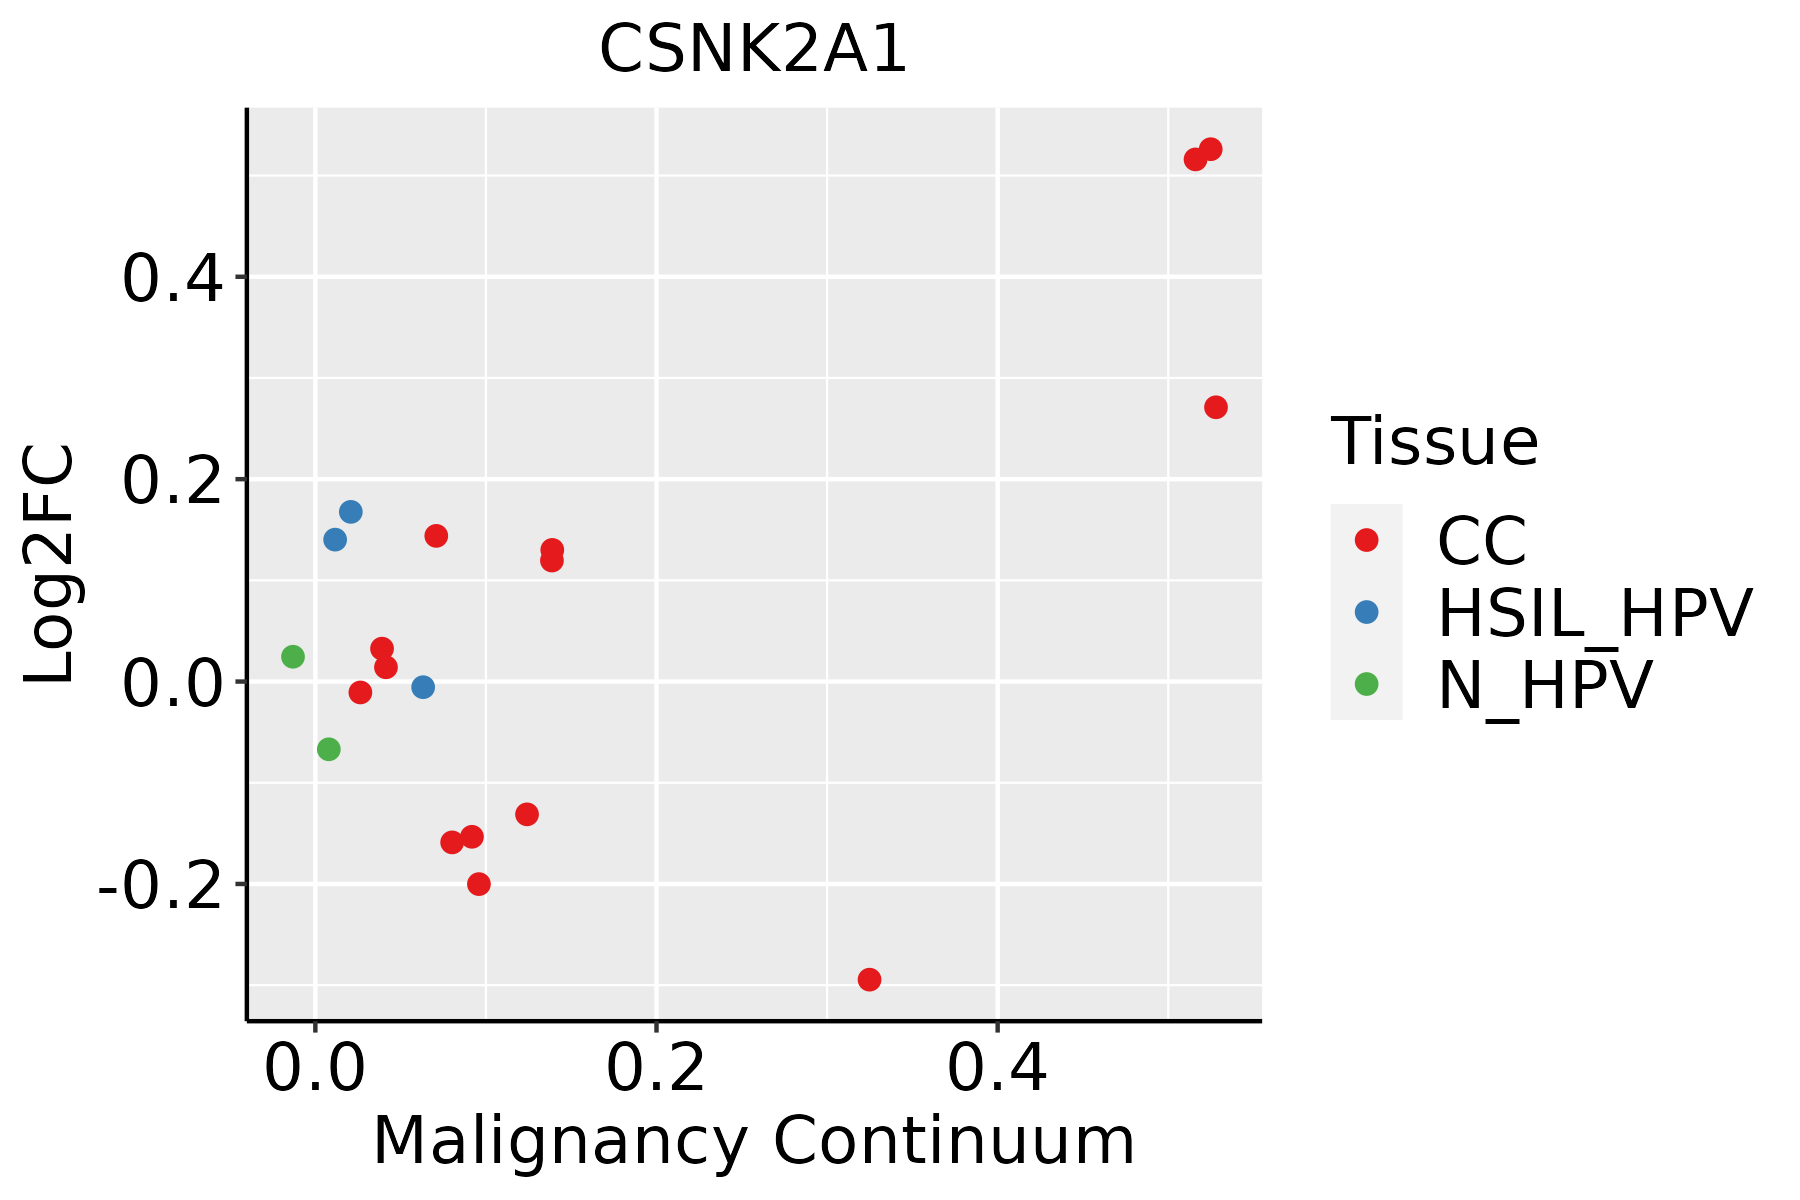 | CC: Cervix cancer |
| HSIL_HPV: HPV-infected high-grade squamous intraepithelial lesions | ||
| N_HPV: HPV-infected normal cervix | ||
| Colorectum (GSE201348) |  | FAP: Familial adenomatous polyposis |
| CRC: Colorectal cancer | ||
| Colorectum (HTA11) |  | AD: Adenomas |
| SER: Sessile serrated lesions | ||
| MSI-H: Microsatellite-high colorectal cancer | ||
| MSS: Microsatellite stable colorectal cancer | ||
| Esophagus | 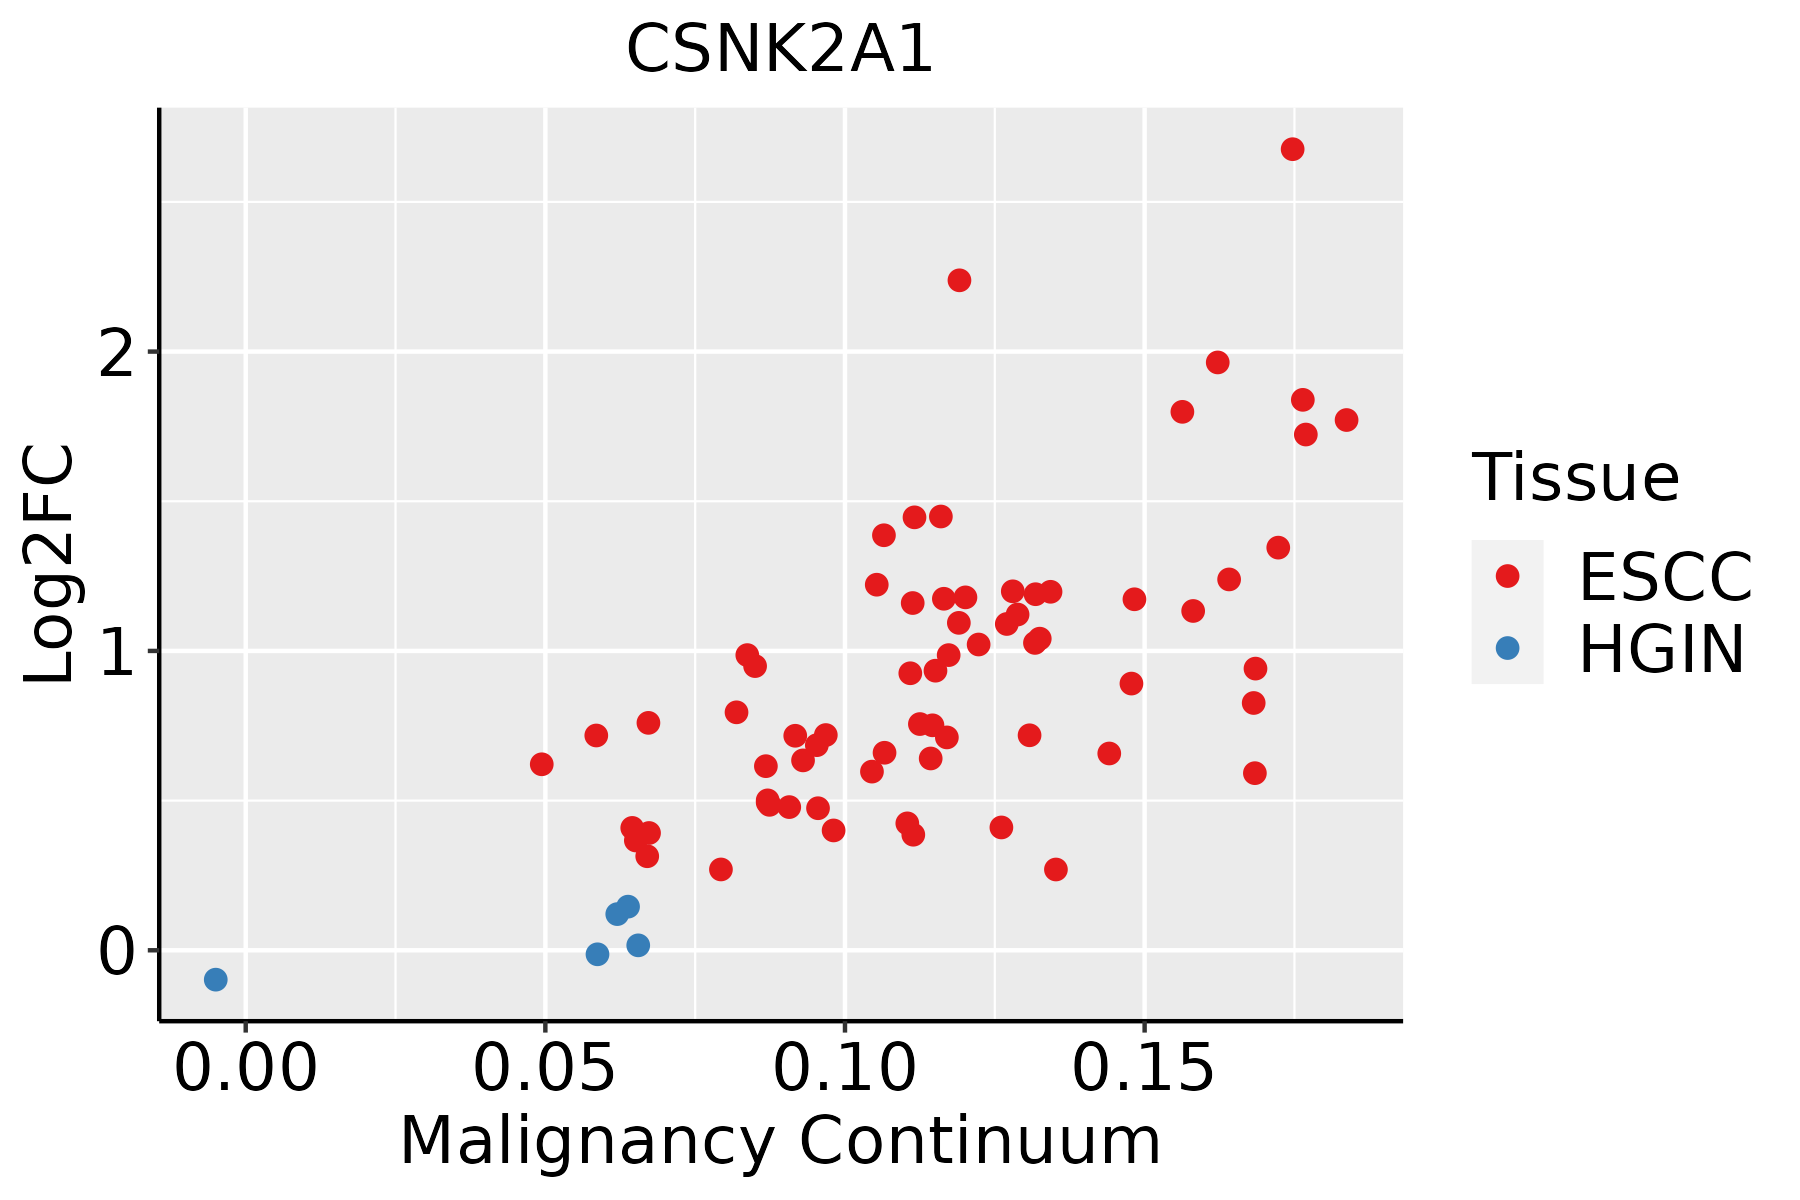 | ESCC: Esophageal squamous cell carcinoma |
| HGIN: High-grade intraepithelial neoplasias | ||
| LGIN: Low-grade intraepithelial neoplasias | ||
| Liver | 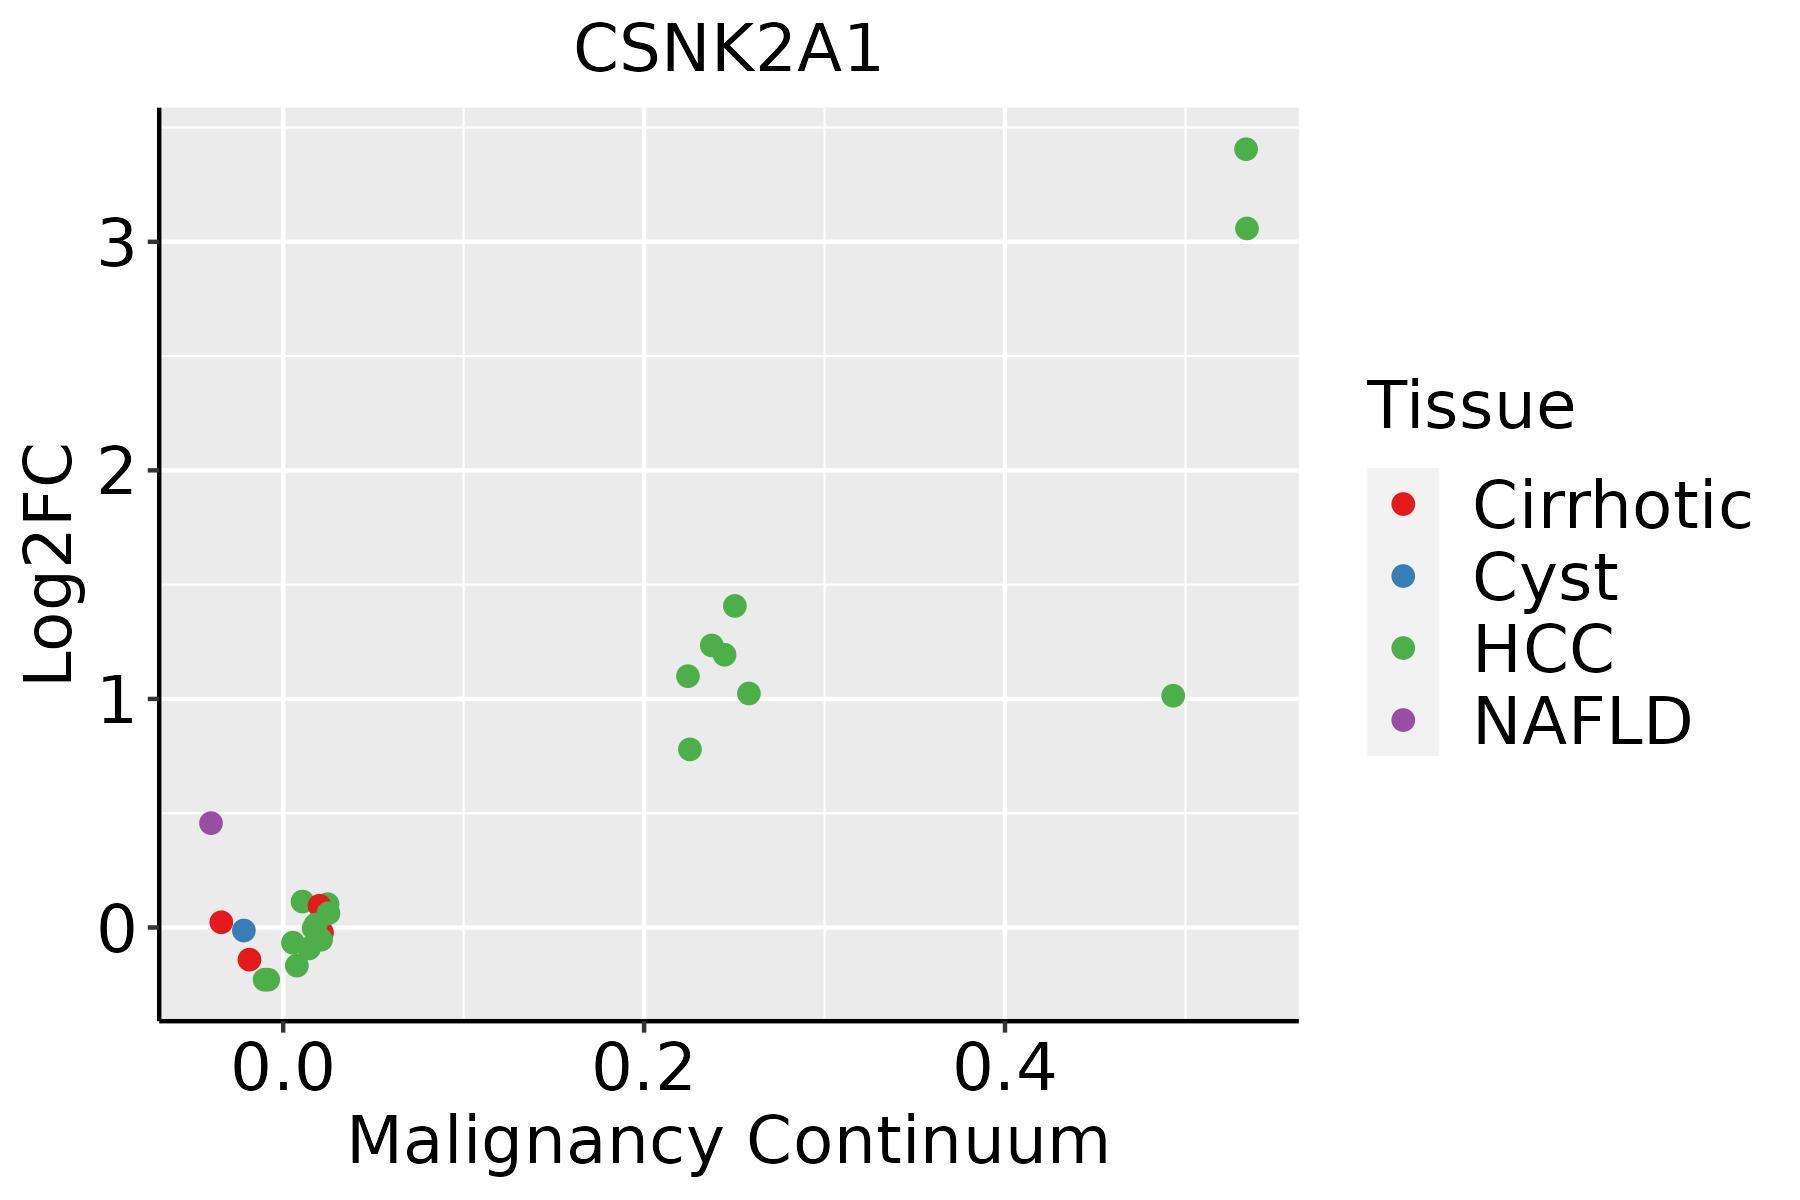 | HCC: Hepatocellular carcinoma |
| NAFLD: Non-alcoholic fatty liver disease | ||
| Oral Cavity | 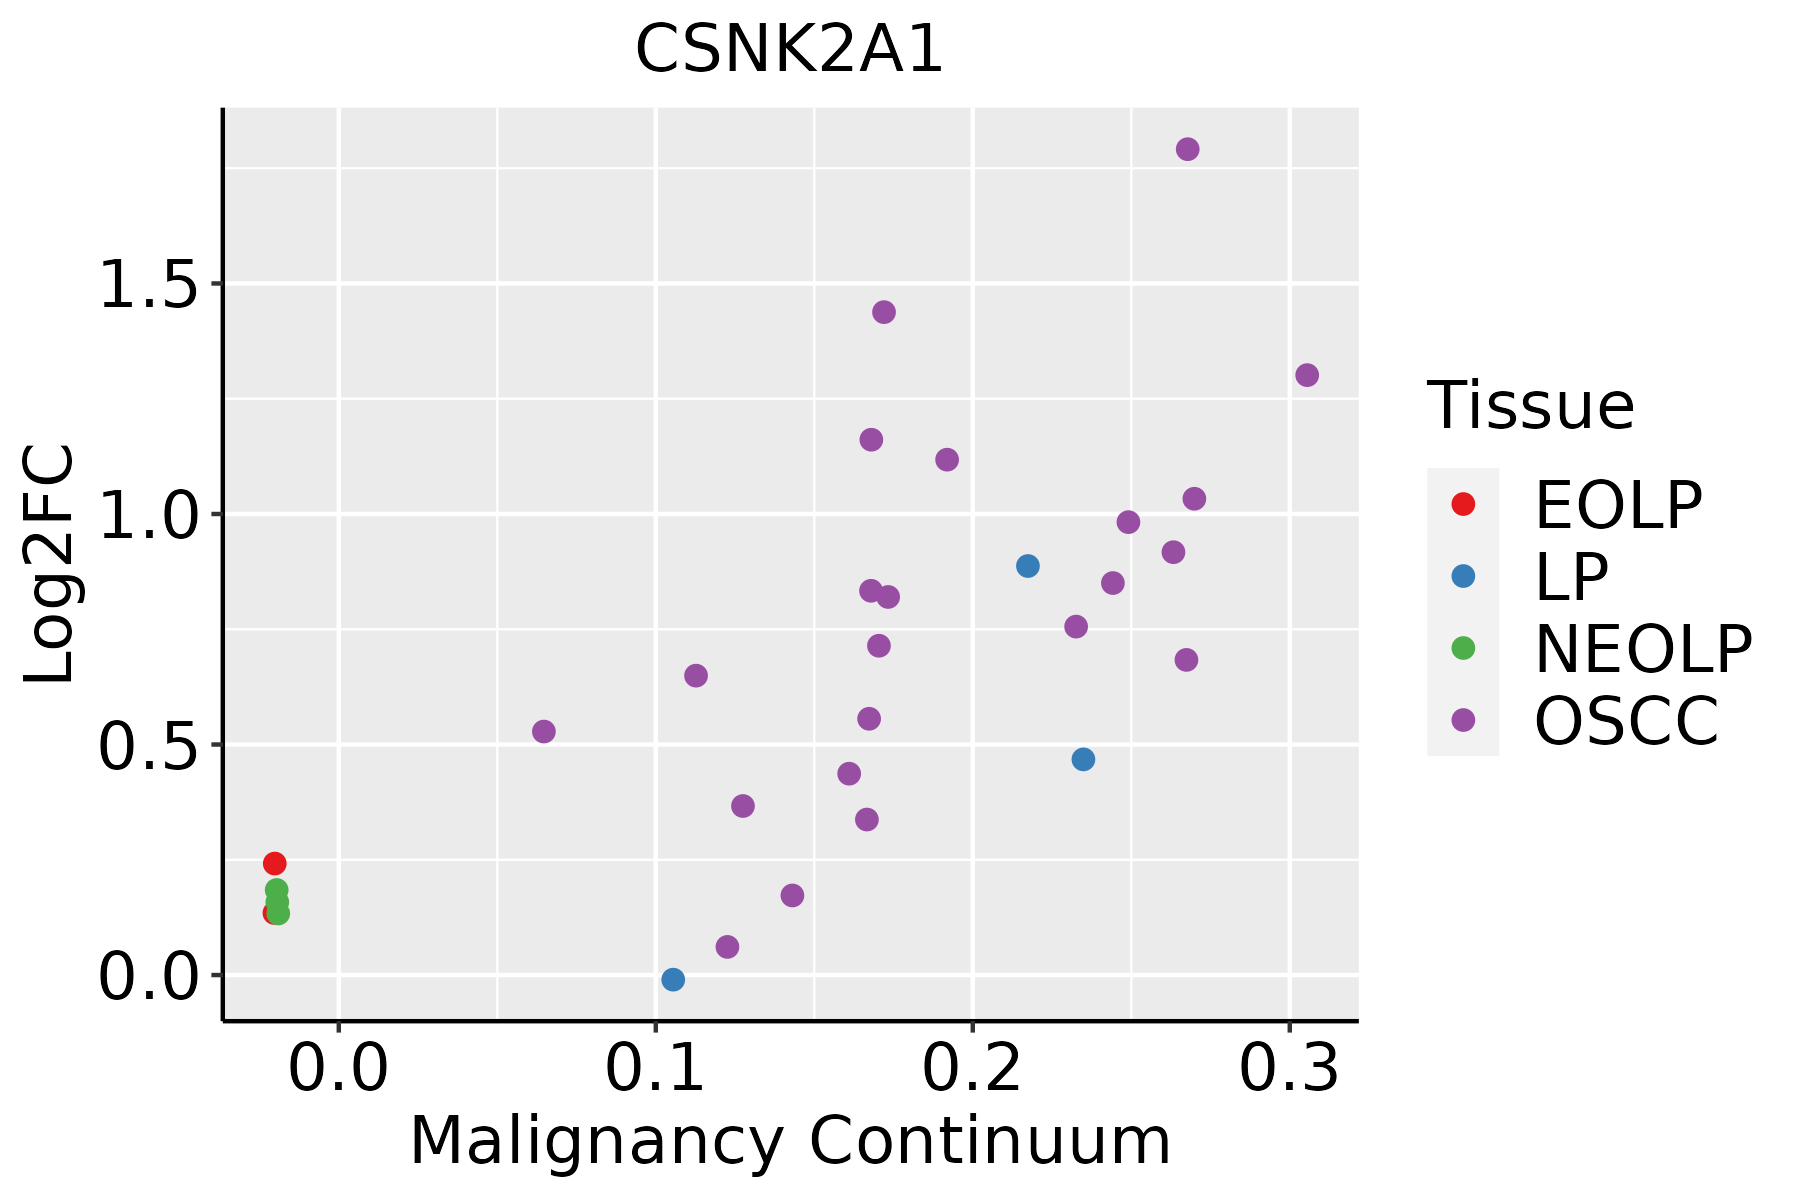 | EOLP: Erosive Oral lichen planus |
| LP: leukoplakia | ||
| NEOLP: Non-erosive oral lichen planus | ||
| OSCC: Oral squamous cell carcinoma | ||
| Skin |  | AK: Actinic keratosis |
| cSCC: Cutaneous squamous cell carcinoma | ||
| SCCIS:squamous cell carcinoma in situ | ||
| Thyroid |  | ATC: Anaplastic thyroid cancer |
| HT: Hashimoto's thyroiditis | ||
| PTC: Papillary thyroid cancer |
| ∗log2FC in expression of this searched gene in stem-like cells from each diseased tissue sample relative to stem-like cells in normal samples in each tissue plotted against the malignancy continuum. Samples are colored based on if they are from different disease stage. |
Top |
Malignant transformation related pathway analysis |
| Find out the enriched GO biological processes and KEGG pathways involved in transition from healthy to precancer to cancer |
| Tissue | Disease Stage | Enriched GO biological Processes |
| Colorectum | AD |  |
| Colorectum | SER |  |
| Colorectum | MSS |  |
| Colorectum | MSI-H |  |
| Colorectum | FAP |  |
| ∗Top 15 enriched GO BP terms are showed in the bar plot of each disease state in each tissue. Each row represents a significant GO biological process which is colored according to the -log10(p.adjust). |
| Page: 1 2 3 4 5 6 7 8 9 |
| GO ID | Tissue | Disease Stage | Description | Gene Ratio | Bg Ratio | pvalue | p.adjust | Count |
| GO:20012339 | Breast | Precancer | regulation of apoptotic signaling pathway | 65/1080 | 356/18723 | 7.70e-17 | 3.17e-14 | 65 |
| GO:00525479 | Breast | Precancer | regulation of peptidase activity | 71/1080 | 461/18723 | 2.72e-14 | 6.94e-12 | 71 |
| GO:00525489 | Breast | Precancer | regulation of endopeptidase activity | 67/1080 | 432/18723 | 1.06e-13 | 2.36e-11 | 67 |
| GO:00064578 | Breast | Precancer | protein folding | 43/1080 | 212/18723 | 3.48e-13 | 7.45e-11 | 43 |
| GO:20001169 | Breast | Precancer | regulation of cysteine-type endopeptidase activity | 43/1080 | 235/18723 | 1.30e-11 | 1.83e-09 | 43 |
| GO:00432819 | Breast | Precancer | regulation of cysteine-type endopeptidase activity involved in apoptotic process | 40/1080 | 209/18723 | 1.59e-11 | 2.07e-09 | 40 |
| GO:20012349 | Breast | Precancer | negative regulation of apoptotic signaling pathway | 39/1080 | 224/18723 | 5.35e-10 | 4.77e-08 | 39 |
| GO:00458619 | Breast | Precancer | negative regulation of proteolysis | 50/1080 | 351/18723 | 2.99e-09 | 2.39e-07 | 50 |
| GO:00610778 | Breast | Precancer | chaperone-mediated protein folding | 19/1080 | 67/18723 | 4.22e-09 | 3.28e-07 | 19 |
| GO:00513468 | Breast | Precancer | negative regulation of hydrolase activity | 50/1080 | 379/18723 | 3.85e-08 | 2.34e-06 | 50 |
| GO:00104668 | Breast | Precancer | negative regulation of peptidase activity | 38/1080 | 262/18723 | 1.46e-07 | 7.82e-06 | 38 |
| GO:00109519 | Breast | Precancer | negative regulation of endopeptidase activity | 37/1080 | 252/18723 | 1.55e-07 | 8.05e-06 | 37 |
| GO:20001179 | Breast | Precancer | negative regulation of cysteine-type endopeptidase activity | 19/1080 | 86/18723 | 3.36e-07 | 1.58e-05 | 19 |
| GO:19033629 | Breast | Precancer | regulation of cellular protein catabolic process | 36/1080 | 255/18723 | 6.03e-07 | 2.55e-05 | 36 |
| GO:00421769 | Breast | Precancer | regulation of protein catabolic process | 47/1080 | 391/18723 | 1.50e-06 | 5.58e-05 | 47 |
| GO:00431548 | Breast | Precancer | negative regulation of cysteine-type endopeptidase activity involved in apoptotic process | 17/1080 | 78/18723 | 1.69e-06 | 6.08e-05 | 17 |
| GO:19030509 | Breast | Precancer | regulation of proteolysis involved in cellular protein catabolic process | 31/1080 | 221/18723 | 4.10e-06 | 1.27e-04 | 31 |
| GO:00313309 | Breast | Precancer | negative regulation of cellular catabolic process | 34/1080 | 262/18723 | 8.16e-06 | 2.20e-04 | 34 |
| GO:19033638 | Breast | Precancer | negative regulation of cellular protein catabolic process | 14/1080 | 75/18723 | 8.54e-05 | 1.63e-03 | 14 |
| GO:00098959 | Breast | Precancer | negative regulation of catabolic process | 36/1080 | 320/18723 | 9.92e-05 | 1.83e-03 | 36 |
| Page: 1 2 3 4 5 6 7 8 9 10 11 12 13 14 15 16 17 18 19 20 21 22 23 24 25 26 27 28 29 30 31 32 33 34 35 36 |
| Pathway ID | Tissue | Disease Stage | Description | Gene Ratio | Bg Ratio | pvalue | p.adjust | qvalue | Count |
| hsa0502016 | Breast | Precancer | Prion disease | 95/684 | 273/8465 | 1.39e-37 | 1.46e-35 | 1.12e-35 | 95 |
| hsa0501016 | Breast | Precancer | Alzheimer disease | 103/684 | 384/8465 | 1.03e-29 | 4.66e-28 | 3.57e-28 | 103 |
| hsa0502216 | Breast | Precancer | Pathways of neurodegeneration - multiple diseases | 112/684 | 476/8465 | 6.96e-27 | 2.44e-25 | 1.87e-25 | 112 |
| hsa0413716 | Breast | Precancer | Mitophagy - animal | 15/684 | 72/8465 | 5.22e-04 | 3.93e-03 | 3.01e-03 | 15 |
| hsa0452018 | Breast | Precancer | Adherens junction | 17/684 | 93/8465 | 1.11e-03 | 7.57e-03 | 5.80e-03 | 17 |
| hsa0502017 | Breast | Precancer | Prion disease | 95/684 | 273/8465 | 1.39e-37 | 1.46e-35 | 1.12e-35 | 95 |
| hsa0501017 | Breast | Precancer | Alzheimer disease | 103/684 | 384/8465 | 1.03e-29 | 4.66e-28 | 3.57e-28 | 103 |
| hsa0502217 | Breast | Precancer | Pathways of neurodegeneration - multiple diseases | 112/684 | 476/8465 | 6.96e-27 | 2.44e-25 | 1.87e-25 | 112 |
| hsa0413717 | Breast | Precancer | Mitophagy - animal | 15/684 | 72/8465 | 5.22e-04 | 3.93e-03 | 3.01e-03 | 15 |
| hsa0452019 | Breast | Precancer | Adherens junction | 17/684 | 93/8465 | 1.11e-03 | 7.57e-03 | 5.80e-03 | 17 |
| hsa0502023 | Breast | IDC | Prion disease | 102/867 | 273/8465 | 3.70e-34 | 4.01e-32 | 3.00e-32 | 102 |
| hsa0501023 | Breast | IDC | Alzheimer disease | 107/867 | 384/8465 | 1.70e-23 | 7.88e-22 | 5.90e-22 | 107 |
| hsa0502223 | Breast | IDC | Pathways of neurodegeneration - multiple diseases | 116/867 | 476/8465 | 3.63e-20 | 1.18e-18 | 8.82e-19 | 116 |
| hsa0413723 | Breast | IDC | Mitophagy - animal | 17/867 | 72/8465 | 7.61e-04 | 6.04e-03 | 4.52e-03 | 17 |
| hsa0502033 | Breast | IDC | Prion disease | 102/867 | 273/8465 | 3.70e-34 | 4.01e-32 | 3.00e-32 | 102 |
| hsa0501033 | Breast | IDC | Alzheimer disease | 107/867 | 384/8465 | 1.70e-23 | 7.88e-22 | 5.90e-22 | 107 |
| hsa0502233 | Breast | IDC | Pathways of neurodegeneration - multiple diseases | 116/867 | 476/8465 | 3.63e-20 | 1.18e-18 | 8.82e-19 | 116 |
| hsa0413733 | Breast | IDC | Mitophagy - animal | 17/867 | 72/8465 | 7.61e-04 | 6.04e-03 | 4.52e-03 | 17 |
| hsa0502043 | Breast | DCIS | Prion disease | 100/846 | 273/8465 | 1.44e-33 | 1.55e-31 | 1.14e-31 | 100 |
| hsa0501043 | Breast | DCIS | Alzheimer disease | 105/846 | 384/8465 | 3.23e-23 | 1.49e-21 | 1.10e-21 | 105 |
| Page: 1 2 3 4 5 6 7 8 9 |
Top |
Cell-cell communication analysis |
| Identification of potential cell-cell interactions between two cell types and their ligand-receptor pairs for different disease states |
| Ligand | Receptor | LRpair | Pathway | Tissue | Disease Stage |
| Page: 1 |
Top |
Single-cell gene regulatory network inference analysis |
| Find out the significant the regulons (TFs) and the target genes of each regulon across cell types for different disease states |
| TF | Cell Type | Tissue | Disease Stage | Target Gene | RSS | Regulon Activity |
| ∗The dot plots of a searched regulon are shown for all cell subpopulations in each disease state of each tissue based on the regulon specific score inferred using pySCENIC and by calculating the average expression. |
| Page: 1 |
Top |
Somatic mutation of malignant transformation related genes |
| Annotation of somatic variants for genes involved in malignant transformation |
| Hugo Symbol | Variant Class | Variant Classification | dbSNP RS | HGVSc | HGVSp | HGVSp Short | SWISSPROT | BIOTYPE | SIFT | PolyPhen | Tumor Sample Barcode | Tissue | Histology | Sex | Age | Stage | Therapy Types | Drugs | Outcome |
| CSNK2A1 | SNV | Missense_Mutation | rs61730061 | c.398T>C | p.Ile133Thr | p.I133T | P68400 | protein_coding | deleterious(0.02) | probably_damaging(0.937) | TCGA-AN-A0XP-01 | Breast | breast invasive carcinoma | Female | >=65 | III/IV | Unknown | Unknown | SD |
| CSNK2A1 | SNV | Missense_Mutation | c.228N>T | p.Lys76Asn | p.K76N | P68400 | protein_coding | deleterious(0) | probably_damaging(0.982) | TCGA-BH-A0W7-01 | Breast | breast invasive carcinoma | Female | <65 | I/II | Chemotherapy | taxotere | CR | |
| CSNK2A1 | SNV | Missense_Mutation | c.785N>G | p.Asn262Ser | p.N262S | P68400 | protein_coding | tolerated(0.13) | benign(0.006) | TCGA-BH-A18G-01 | Breast | breast invasive carcinoma | Female | >=65 | I/II | Unknown | Unknown | SD | |
| CSNK2A1 | SNV | Missense_Mutation | novel | c.134N>C | p.Leu45Ser | p.L45S | P68400 | protein_coding | deleterious(0) | probably_damaging(0.998) | TCGA-2W-A8YY-01 | Cervix | cervical & endocervical cancer | Female | <65 | I/II | Chemotherapy | cisplatin | CR |
| CSNK2A1 | SNV | Missense_Mutation | c.989N>T | p.Asp330Val | p.D330V | P68400 | protein_coding | deleterious(0.01) | benign(0.001) | TCGA-AA-3489-01 | Colorectum | colon adenocarcinoma | Male | >=65 | I/II | Unknown | Unknown | PD | |
| CSNK2A1 | SNV | Missense_Mutation | c.1154N>A | p.Ala385Asp | p.A385D | P68400 | protein_coding | deleterious_low_confidence(0) | benign(0.056) | TCGA-AA-3864-01 | Colorectum | colon adenocarcinoma | Male | >=65 | I/II | Unknown | Unknown | SD | |
| CSNK2A1 | SNV | Missense_Mutation | c.811N>T | p.Asp271Tyr | p.D271Y | P68400 | protein_coding | deleterious(0.01) | probably_damaging(0.991) | TCGA-AA-3949-01 | Colorectum | colon adenocarcinoma | Female | >=65 | III/IV | Unknown | Unknown | SD | |
| CSNK2A1 | SNV | Missense_Mutation | c.420T>G | p.Ile140Met | p.I140M | P68400 | protein_coding | deleterious(0) | possibly_damaging(0.787) | TCGA-AA-3984-01 | Colorectum | colon adenocarcinoma | Female | <65 | I/II | Unknown | Unknown | SD | |
| CSNK2A1 | SNV | Missense_Mutation | c.833G>A | p.Arg278Gln | p.R278Q | P68400 | protein_coding | deleterious(0) | possibly_damaging(0.874) | TCGA-AA-A010-01 | Colorectum | colon adenocarcinoma | Female | <65 | I/II | Chemotherapy | folinic | CR | |
| CSNK2A1 | SNV | Missense_Mutation | c.848N>A | p.Arg283His | p.R283H | P68400 | protein_coding | tolerated(0.06) | possibly_damaging(0.877) | TCGA-AZ-4315-01 | Colorectum | colon adenocarcinoma | Male | <65 | I/II | Unknown | Unknown | SD |
| Page: 1 2 3 4 |
Top |
Related drugs of malignant transformation related genes |
| Identification of chemicals and drugs interact with genes involved in malignant transfromation |
| (DGIdb 4.0) |
| Entrez ID | Symbol | Category | Interaction Types | Drug Claim Name | Drug Name | PMIDs |
| 1457 | CSNK2A1 | KINASE, TRANSCRIPTION FACTOR, ENZYME, DRUGGABLE GENOME, SERINE THREONINE KINASE, TUMOR SUPPRESSOR | inhibitor | 249565806 | SILMITASERTIB | |
| 1457 | CSNK2A1 | KINASE, TRANSCRIPTION FACTOR, ENZYME, DRUGGABLE GENOME, SERINE THREONINE KINASE, TUMOR SUPPRESSOR | CX-4945 | SILMITASERTIB | ||
| 1457 | CSNK2A1 | KINASE, TRANSCRIPTION FACTOR, ENZYME, DRUGGABLE GENOME, SERINE THREONINE KINASE, TUMOR SUPPRESSOR | TAMATINIB | R-406 | ||
| 1457 | CSNK2A1 | KINASE, TRANSCRIPTION FACTOR, ENZYME, DRUGGABLE GENOME, SERINE THREONINE KINASE, TUMOR SUPPRESSOR | inhibitor | 249565820 | ||
| 1457 | CSNK2A1 | KINASE, TRANSCRIPTION FACTOR, ENZYME, DRUGGABLE GENOME, SERINE THREONINE KINASE, TUMOR SUPPRESSOR | AZAKENPAULLONE | AZAKENPAULLONE | ||
| 1457 | CSNK2A1 | KINASE, TRANSCRIPTION FACTOR, ENZYME, DRUGGABLE GENOME, SERINE THREONINE KINASE, TUMOR SUPPRESSOR | HEPARIN | HEPARIN | 7794926 | |
| 1457 | CSNK2A1 | KINASE, TRANSCRIPTION FACTOR, ENZYME, DRUGGABLE GENOME, SERINE THREONINE KINASE, TUMOR SUPPRESSOR | inhibitor | HESPERADIN | HESPERADIN | 19035792 |
| 1457 | CSNK2A1 | KINASE, TRANSCRIPTION FACTOR, ENZYME, DRUGGABLE GENOME, SERINE THREONINE KINASE, TUMOR SUPPRESSOR | MLN-8054 | MLN-8054 | ||
| 1457 | CSNK2A1 | KINASE, TRANSCRIPTION FACTOR, ENZYME, DRUGGABLE GENOME, SERINE THREONINE KINASE, TUMOR SUPPRESSOR | SP-600125 | SP-600125 | ||
| 1457 | CSNK2A1 | KINASE, TRANSCRIPTION FACTOR, ENZYME, DRUGGABLE GENOME, SERINE THREONINE KINASE, TUMOR SUPPRESSOR | CYC-116 | CYC-116 |
| Page: 1 2 3 |

Copyright 2023-Present -The University of Texas Health Science Center at Houston |