
|
|||||
|
 | |
| |
| |
| |
| |
| |
|
Gene: CSNK1G3 |
Gene summary for CSNK1G3 |
| Gene information | Species | Human | Gene symbol | CSNK1G3 | Gene ID | 1456 |
| Gene name | casein kinase 1 gamma 3 | |
| Gene Alias | CKI-gamma 3 | |
| Cytomap | 5q23.2 | |
| Gene Type | protein-coding | GO ID | GO:0006464 | UniProtAcc | Q9Y6M4 |
Top |
Malignant transformation analysis |
| Identification of the aberrant gene expression in precancerous and cancerous lesions by comparing the gene expression of stem-like cells in diseased tissues with normal stem cells |
| Entrez ID | Symbol | Replicates | Species | Organ | Tissue | Adj P-value | Log2FC | Malignancy |
| 1456 | CSNK1G3 | HTA11_3410_2000001011 | Human | Colorectum | AD | 9.66e-19 | -6.35e-01 | 0.0155 |
| 1456 | CSNK1G3 | HTA11_2487_2000001011 | Human | Colorectum | SER | 6.45e-04 | -4.77e-01 | -0.1808 |
| 1456 | CSNK1G3 | HTA11_2951_2000001011 | Human | Colorectum | AD | 4.04e-02 | -6.76e-01 | 0.0216 |
| 1456 | CSNK1G3 | HTA11_1938_2000001011 | Human | Colorectum | AD | 3.95e-03 | -4.24e-01 | -0.0811 |
| 1456 | CSNK1G3 | HTA11_3361_2000001011 | Human | Colorectum | AD | 2.59e-06 | -5.86e-01 | -0.1207 |
| 1456 | CSNK1G3 | HTA11_696_2000001011 | Human | Colorectum | AD | 6.01e-11 | -4.27e-01 | -0.1464 |
| 1456 | CSNK1G3 | HTA11_866_2000001011 | Human | Colorectum | AD | 1.79e-09 | -4.06e-01 | -0.1001 |
| 1456 | CSNK1G3 | HTA11_1391_2000001011 | Human | Colorectum | AD | 1.93e-13 | -5.93e-01 | -0.059 |
| 1456 | CSNK1G3 | HTA11_5216_2000001011 | Human | Colorectum | SER | 3.92e-02 | -6.76e-01 | -0.1462 |
| 1456 | CSNK1G3 | HTA11_866_3004761011 | Human | Colorectum | AD | 2.34e-11 | -5.49e-01 | 0.096 |
| 1456 | CSNK1G3 | HTA11_8622_2000001021 | Human | Colorectum | SER | 2.46e-04 | -6.71e-01 | 0.0528 |
| 1456 | CSNK1G3 | HTA11_10711_2000001011 | Human | Colorectum | AD | 1.31e-05 | -5.22e-01 | 0.0338 |
| 1456 | CSNK1G3 | HTA11_7696_3000711011 | Human | Colorectum | AD | 1.09e-16 | -5.30e-01 | 0.0674 |
| 1456 | CSNK1G3 | HTA11_6818_2000001021 | Human | Colorectum | AD | 4.84e-03 | -5.13e-01 | 0.0588 |
| 1456 | CSNK1G3 | HTA11_99999970781_79442 | Human | Colorectum | MSS | 2.02e-13 | -3.95e-01 | 0.294 |
| 1456 | CSNK1G3 | HTA11_99999971662_82457 | Human | Colorectum | MSS | 3.81e-09 | -4.38e-01 | 0.3859 |
| 1456 | CSNK1G3 | HTA11_99999974143_84620 | Human | Colorectum | MSS | 3.79e-23 | -5.73e-01 | 0.3005 |
| 1456 | CSNK1G3 | A002-C-010 | Human | Colorectum | FAP | 4.96e-02 | -1.80e-01 | 0.242 |
| 1456 | CSNK1G3 | A001-C-207 | Human | Colorectum | FAP | 2.01e-02 | -2.11e-01 | 0.1278 |
| 1456 | CSNK1G3 | A015-C-203 | Human | Colorectum | FAP | 1.78e-34 | -5.25e-01 | -0.1294 |
| Page: 1 2 3 4 5 6 7 8 |
| Tissue | Expression Dynamics | Abbreviation |
| Colorectum (GSE201348) |  | FAP: Familial adenomatous polyposis |
| CRC: Colorectal cancer | ||
| Colorectum (HTA11) |  | AD: Adenomas |
| SER: Sessile serrated lesions | ||
| MSI-H: Microsatellite-high colorectal cancer | ||
| MSS: Microsatellite stable colorectal cancer | ||
| Esophagus | 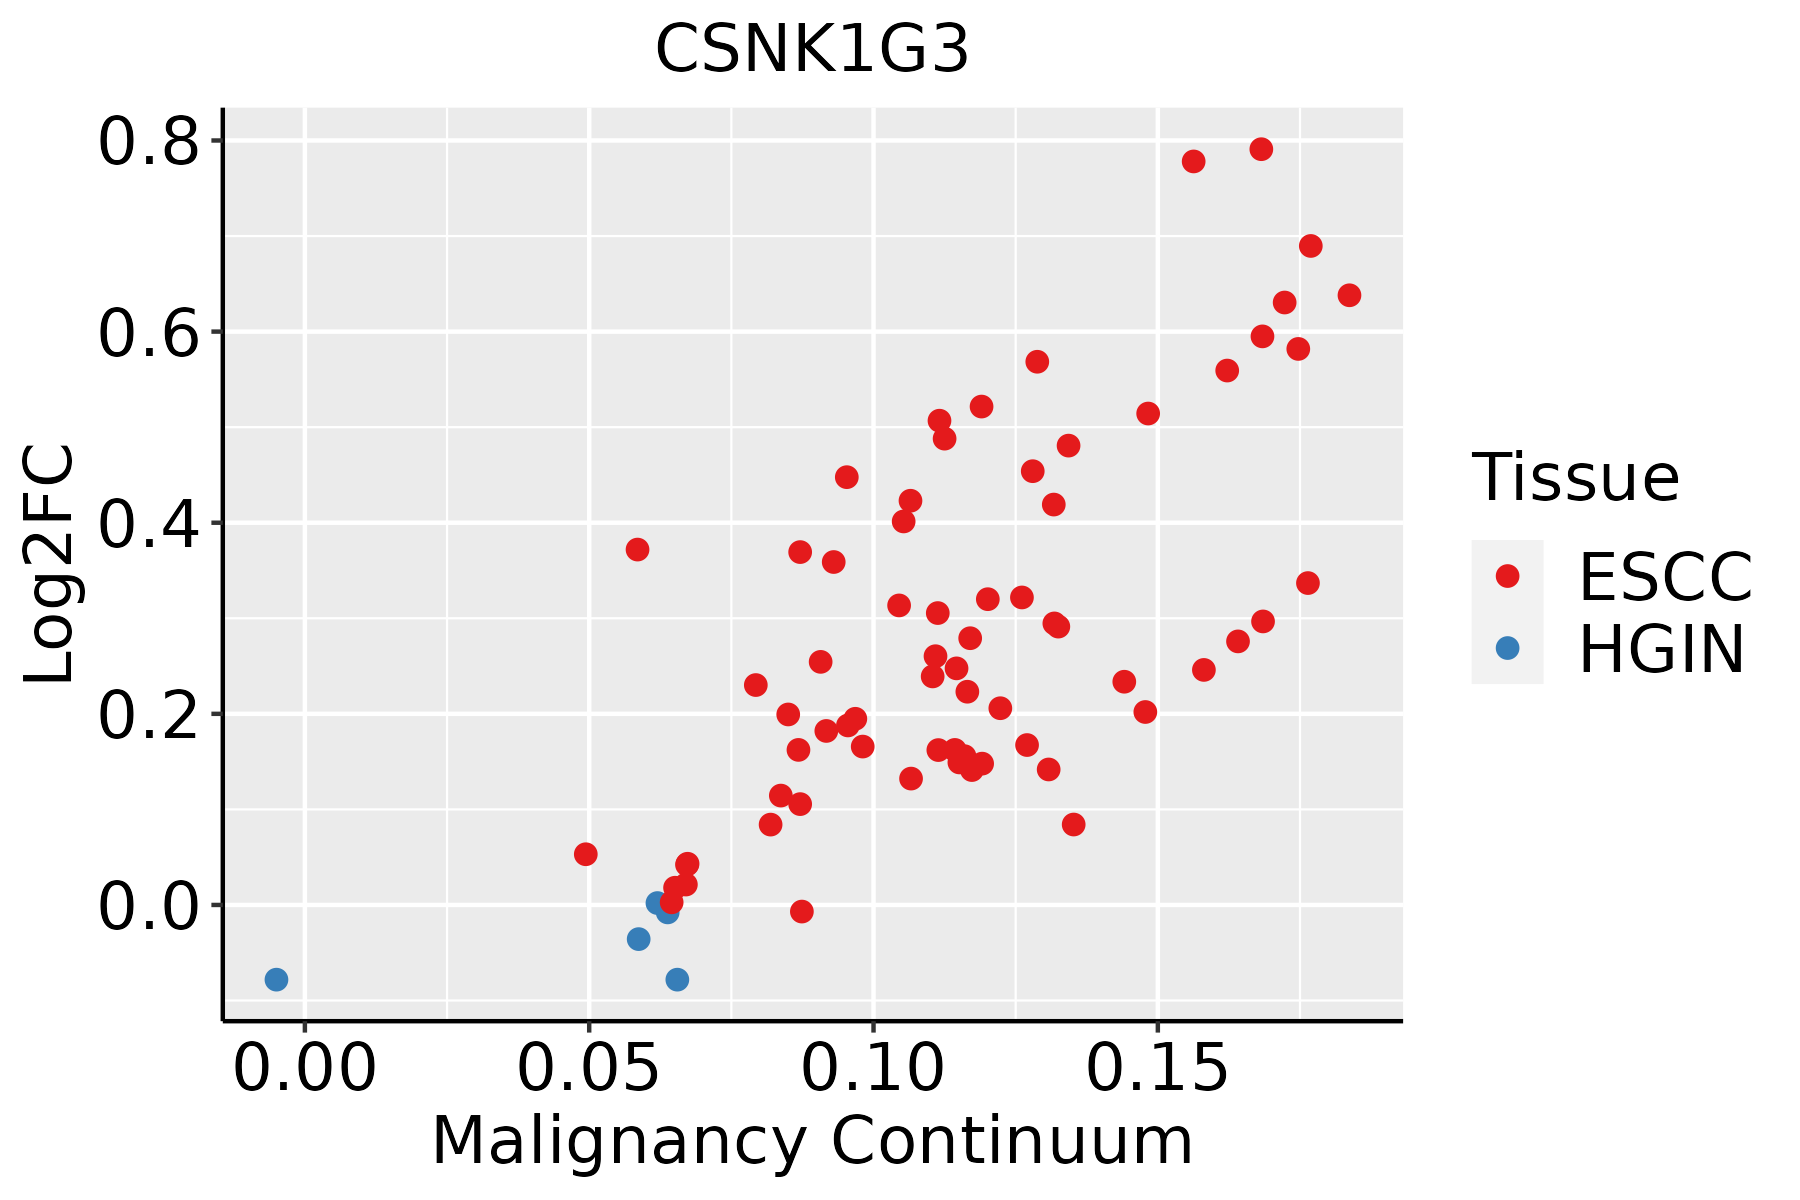 | ESCC: Esophageal squamous cell carcinoma |
| HGIN: High-grade intraepithelial neoplasias | ||
| LGIN: Low-grade intraepithelial neoplasias | ||
| Liver | 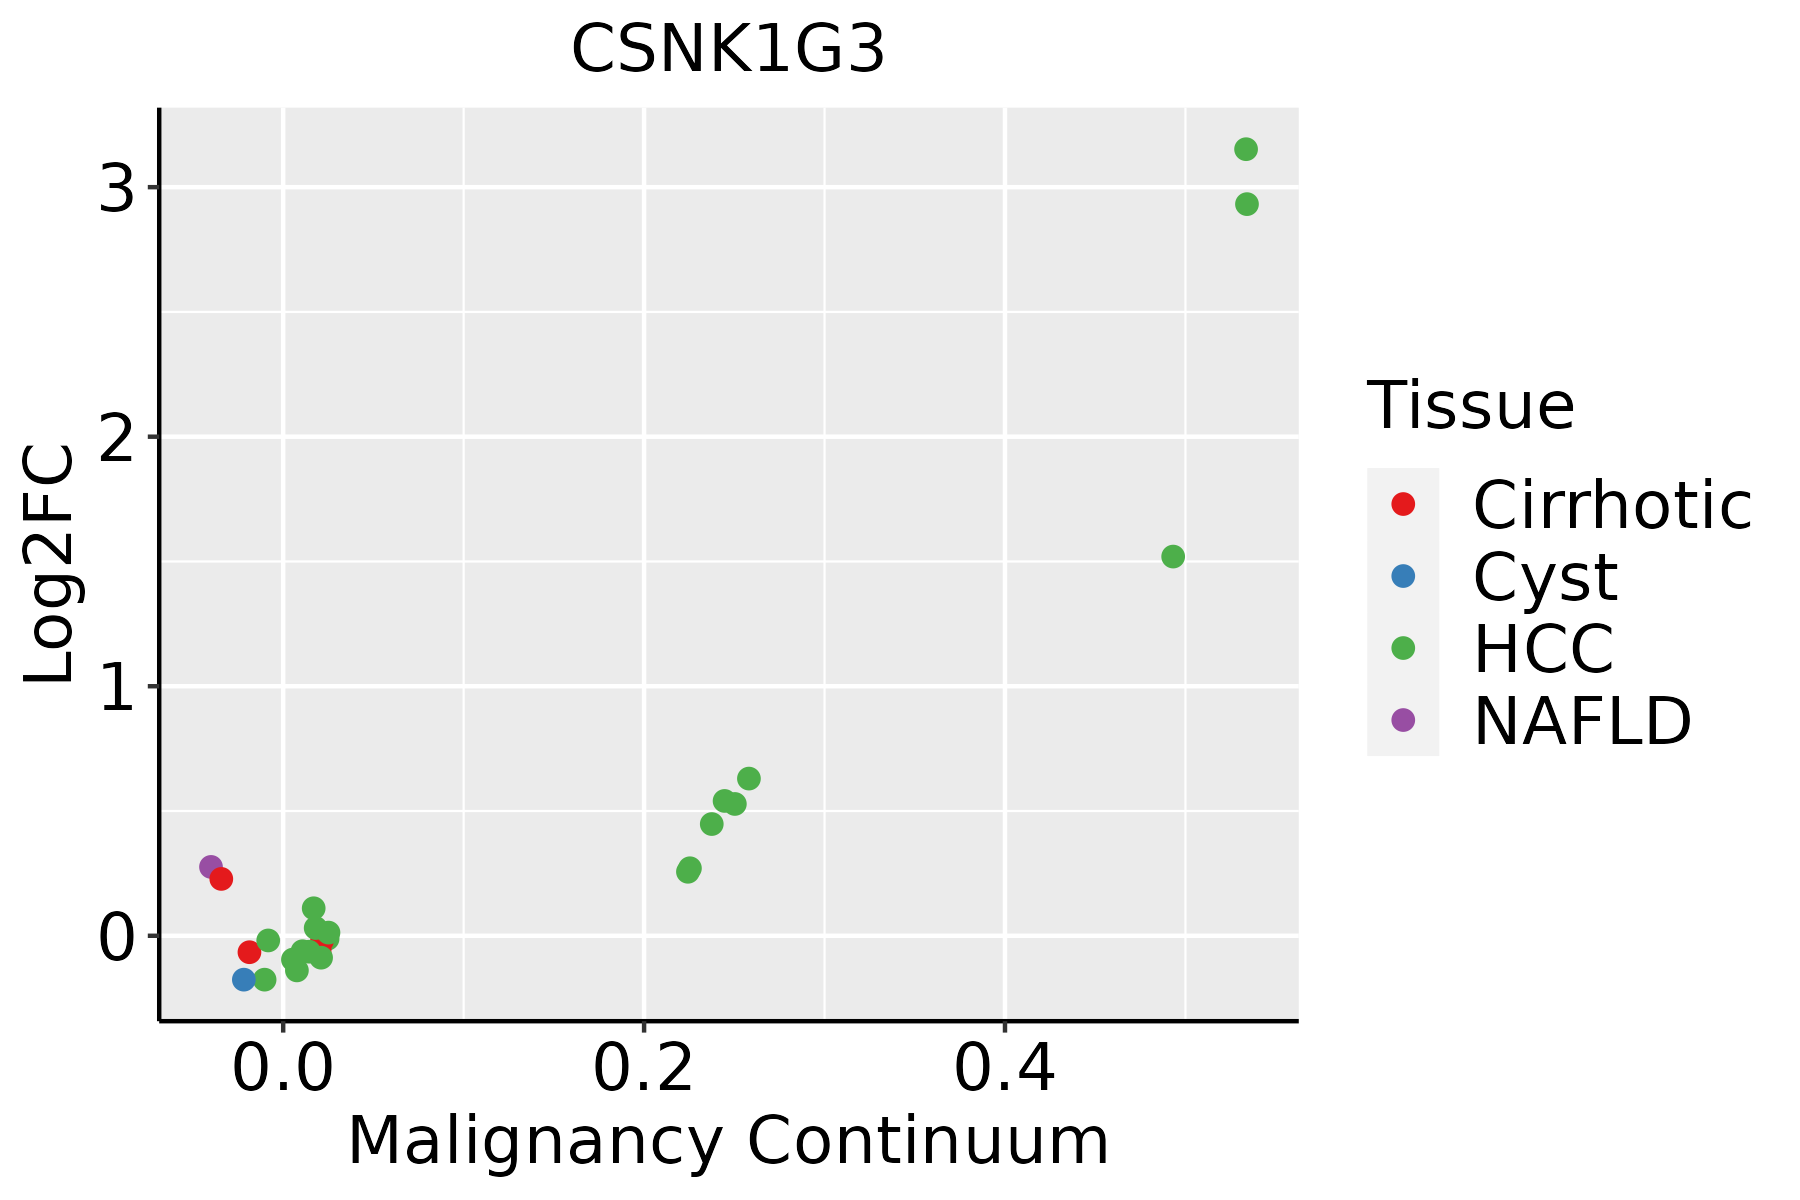 | HCC: Hepatocellular carcinoma |
| NAFLD: Non-alcoholic fatty liver disease | ||
| Oral Cavity | 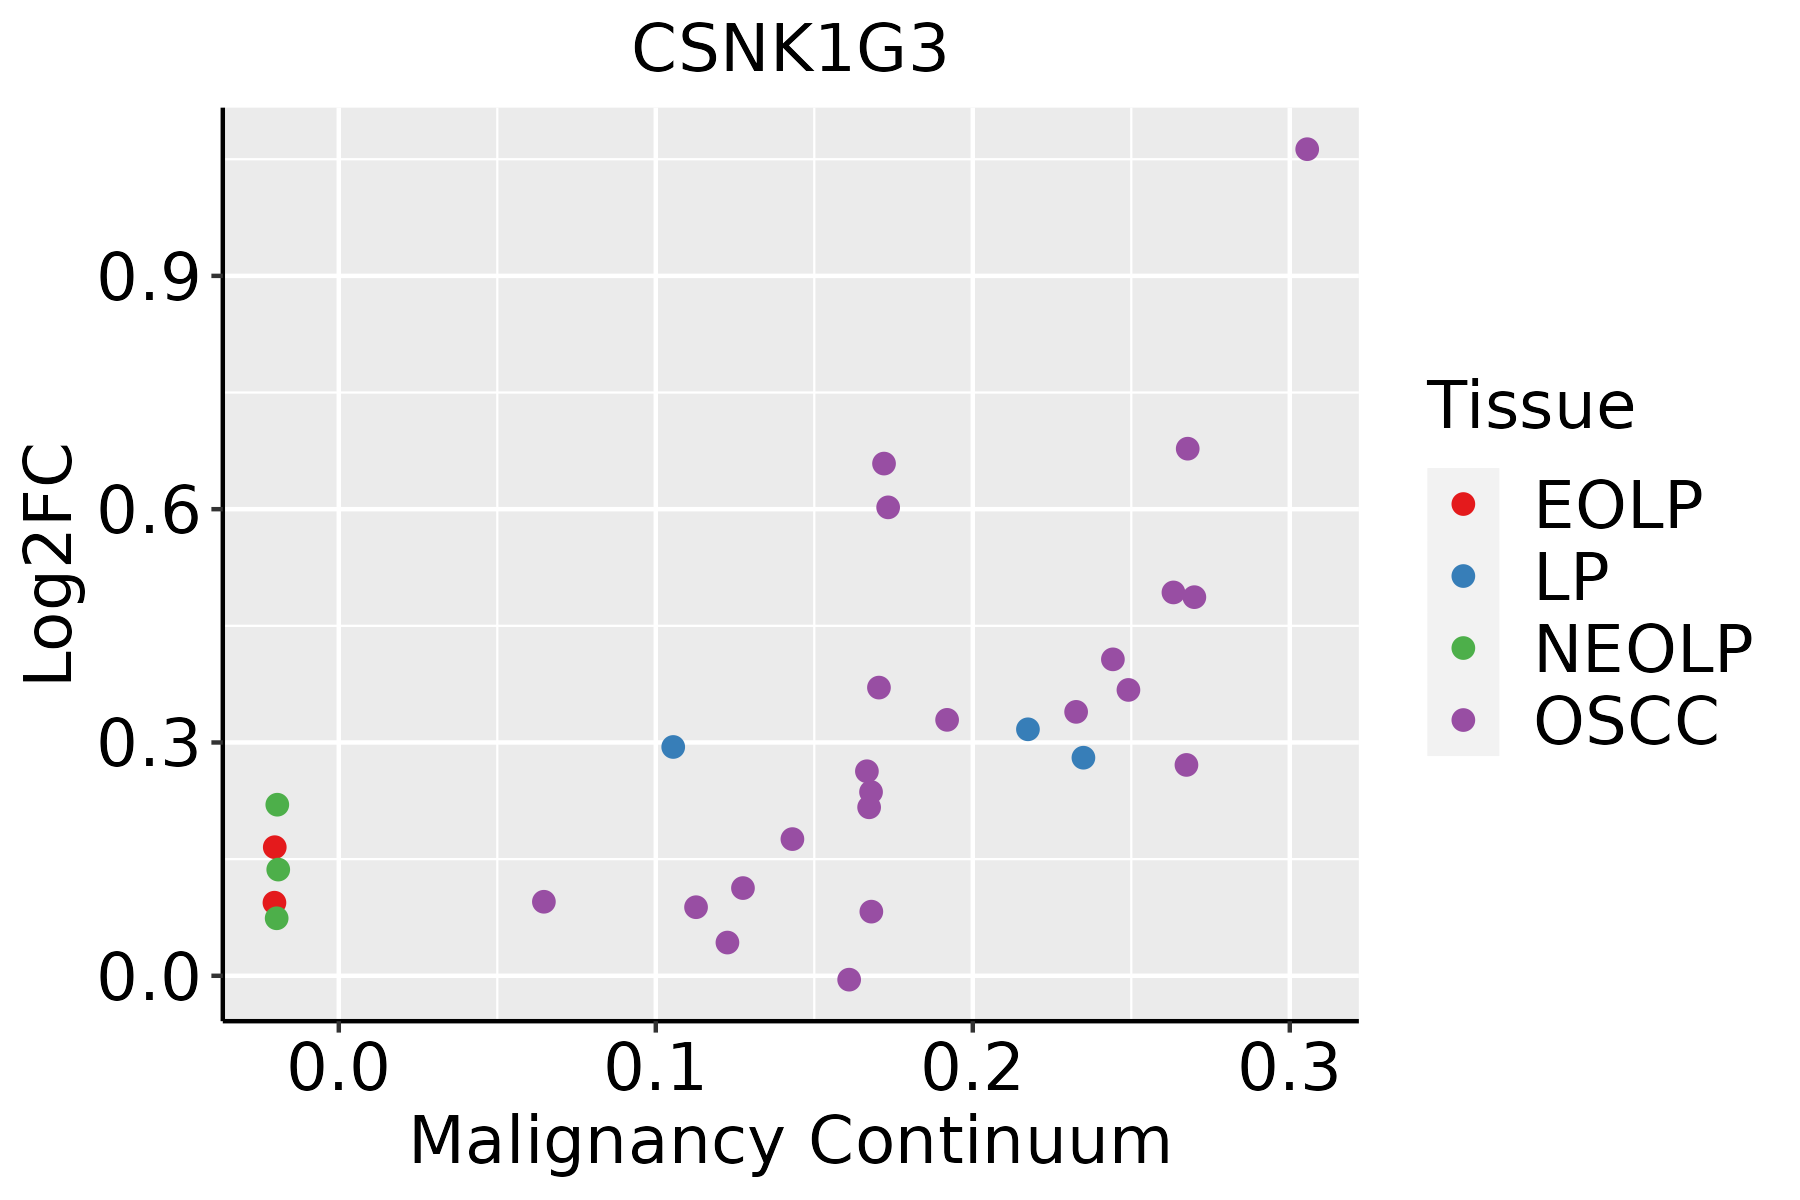 | EOLP: Erosive Oral lichen planus |
| LP: leukoplakia | ||
| NEOLP: Non-erosive oral lichen planus | ||
| OSCC: Oral squamous cell carcinoma | ||
| Skin | 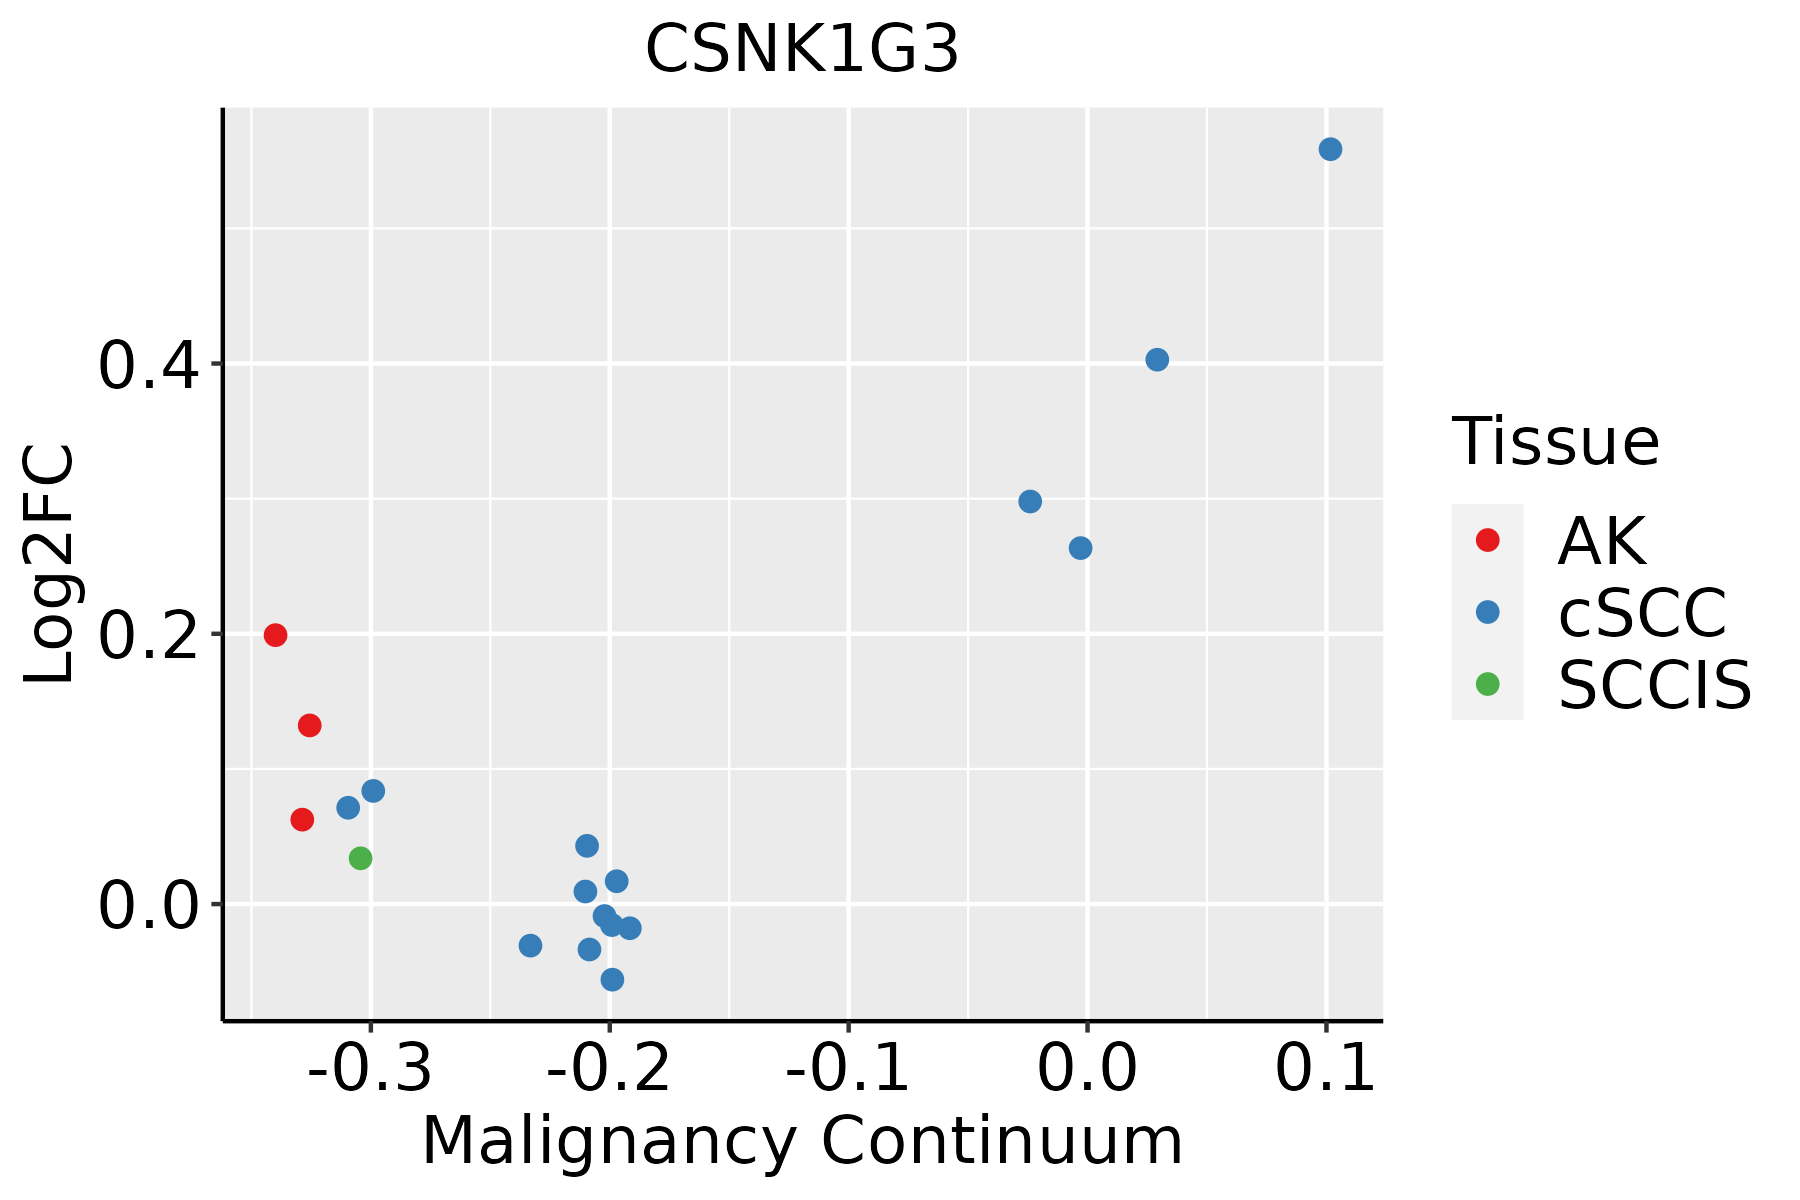 | AK: Actinic keratosis |
| cSCC: Cutaneous squamous cell carcinoma | ||
| SCCIS:squamous cell carcinoma in situ | ||
| Thyroid |  | ATC: Anaplastic thyroid cancer |
| HT: Hashimoto's thyroiditis | ||
| PTC: Papillary thyroid cancer |
| ∗log2FC in expression of this searched gene in stem-like cells from each diseased tissue sample relative to stem-like cells in normal samples in each tissue plotted against the malignancy continuum. Samples are colored based on if they are from different disease stage. |
Top |
Malignant transformation related pathway analysis |
| Find out the enriched GO biological processes and KEGG pathways involved in transition from healthy to precancer to cancer |
| Tissue | Disease Stage | Enriched GO biological Processes |
| Colorectum | AD |  |
| Colorectum | SER |  |
| Colorectum | MSS |  |
| Colorectum | MSI-H |  |
| Colorectum | FAP |  |
| ∗Top 15 enriched GO BP terms are showed in the bar plot of each disease state in each tissue. Each row represents a significant GO biological process which is colored according to the -log10(p.adjust). |
| Page: 1 2 3 4 5 6 7 8 9 |
| GO ID | Tissue | Disease Stage | Description | Gene Ratio | Bg Ratio | pvalue | p.adjust | Count |
| GO:0030111 | Colorectum | AD | regulation of Wnt signaling pathway | 102/3918 | 328/18723 | 8.51e-06 | 2.03e-04 | 102 |
| GO:0016055 | Colorectum | AD | Wnt signaling pathway | 130/3918 | 444/18723 | 1.60e-05 | 3.37e-04 | 130 |
| GO:0198738 | Colorectum | AD | cell-cell signaling by wnt | 130/3918 | 446/18723 | 2.02e-05 | 4.10e-04 | 130 |
| GO:0060070 | Colorectum | AD | canonical Wnt signaling pathway | 90/3918 | 303/18723 | 1.76e-04 | 2.38e-03 | 90 |
| GO:0060828 | Colorectum | AD | regulation of canonical Wnt signaling pathway | 77/3918 | 253/18723 | 2.19e-04 | 2.87e-03 | 77 |
| GO:0030177 | Colorectum | AD | positive regulation of Wnt signaling pathway | 45/3918 | 140/18723 | 1.23e-03 | 1.09e-02 | 45 |
| GO:0018105 | Colorectum | AD | peptidyl-serine phosphorylation | 88/3918 | 315/18723 | 1.73e-03 | 1.43e-02 | 88 |
| GO:0018209 | Colorectum | AD | peptidyl-serine modification | 92/3918 | 338/18723 | 3.19e-03 | 2.36e-02 | 92 |
| GO:00160551 | Colorectum | SER | Wnt signaling pathway | 97/2897 | 444/18723 | 2.02e-04 | 3.68e-03 | 97 |
| GO:01987381 | Colorectum | SER | cell-cell signaling by wnt | 97/2897 | 446/18723 | 2.39e-04 | 4.11e-03 | 97 |
| GO:00301111 | Colorectum | SER | regulation of Wnt signaling pathway | 75/2897 | 328/18723 | 2.47e-04 | 4.20e-03 | 75 |
| GO:00600701 | Colorectum | SER | canonical Wnt signaling pathway | 66/2897 | 303/18723 | 2.10e-03 | 2.06e-02 | 66 |
| GO:00608281 | Colorectum | SER | regulation of canonical Wnt signaling pathway | 56/2897 | 253/18723 | 3.03e-03 | 2.67e-02 | 56 |
| GO:0090263 | Colorectum | SER | positive regulation of canonical Wnt signaling pathway | 27/2897 | 106/18723 | 5.12e-03 | 3.92e-02 | 27 |
| GO:00181051 | Colorectum | SER | peptidyl-serine phosphorylation | 66/2897 | 315/18723 | 5.47e-03 | 4.06e-02 | 66 |
| GO:00301112 | Colorectum | MSS | regulation of Wnt signaling pathway | 98/3467 | 328/18723 | 3.37e-07 | 1.36e-05 | 98 |
| GO:00160552 | Colorectum | MSS | Wnt signaling pathway | 124/3467 | 444/18723 | 6.06e-07 | 2.26e-05 | 124 |
| GO:01987382 | Colorectum | MSS | cell-cell signaling by wnt | 124/3467 | 446/18723 | 7.83e-07 | 2.77e-05 | 124 |
| GO:00600702 | Colorectum | MSS | canonical Wnt signaling pathway | 86/3467 | 303/18723 | 1.58e-05 | 3.56e-04 | 86 |
| GO:00608282 | Colorectum | MSS | regulation of canonical Wnt signaling pathway | 74/3467 | 253/18723 | 1.99e-05 | 4.26e-04 | 74 |
| Page: 1 2 3 4 5 6 7 |
| Pathway ID | Tissue | Disease Stage | Description | Gene Ratio | Bg Ratio | pvalue | p.adjust | qvalue | Count |
| Page: 1 |
Top |
Cell-cell communication analysis |
| Identification of potential cell-cell interactions between two cell types and their ligand-receptor pairs for different disease states |
| Ligand | Receptor | LRpair | Pathway | Tissue | Disease Stage |
| Page: 1 |
Top |
Single-cell gene regulatory network inference analysis |
| Find out the significant the regulons (TFs) and the target genes of each regulon across cell types for different disease states |
| TF | Cell Type | Tissue | Disease Stage | Target Gene | RSS | Regulon Activity |
| ∗The dot plots of a searched regulon are shown for all cell subpopulations in each disease state of each tissue based on the regulon specific score inferred using pySCENIC and by calculating the average expression. |
| Page: 1 |
Top |
Somatic mutation of malignant transformation related genes |
| Annotation of somatic variants for genes involved in malignant transformation |
| Hugo Symbol | Variant Class | Variant Classification | dbSNP RS | HGVSc | HGVSp | HGVSp Short | SWISSPROT | BIOTYPE | SIFT | PolyPhen | Tumor Sample Barcode | Tissue | Histology | Sex | Age | Stage | Therapy Types | Drugs | Outcome |
| CSNK1G3 | SNV | Missense_Mutation | c.439N>G | p.Ile147Val | p.I147V | Q9Y6M4 | protein_coding | tolerated(0.16) | benign(0.023) | TCGA-A8-A096-01 | Breast | breast invasive carcinoma | Female | >=65 | I/II | Unknown | Unknown | SD | |
| CSNK1G3 | SNV | Missense_Mutation | novel | c.464N>T | p.Ser155Leu | p.S155L | Q9Y6M4 | protein_coding | deleterious(0.03) | benign(0.14) | TCGA-C5-A8YQ-01 | Cervix | cervical & endocervical cancer | Female | >=65 | I/II | Chemotherapy | cisplatin | PD |
| CSNK1G3 | SNV | Missense_Mutation | c.1018N>A | p.Asp340Asn | p.D340N | Q9Y6M4 | protein_coding | tolerated(0.06) | possibly_damaging(0.543) | TCGA-FU-A40J-01 | Cervix | cervical & endocervical cancer | Female | <65 | III/IV | Chemotherapy | carboplatin | CR | |
| CSNK1G3 | SNV | Missense_Mutation | c.301N>G | p.Gln101Glu | p.Q101E | Q9Y6M4 | protein_coding | tolerated(0.19) | benign(0.042) | TCGA-IR-A3LK-01 | Cervix | cervical & endocervical cancer | Female | >=65 | I/II | Chemotherapy | cisplatin | PD | |
| CSNK1G3 | SNV | Missense_Mutation | c.710A>G | p.His237Arg | p.H237R | Q9Y6M4 | protein_coding | deleterious(0) | probably_damaging(0.966) | TCGA-A6-2681-01 | Colorectum | colon adenocarcinoma | Female | >=65 | I/II | Unknown | Unknown | PD | |
| CSNK1G3 | SNV | Missense_Mutation | c.224C>A | p.Pro75His | p.P75H | Q9Y6M4 | protein_coding | deleterious(0) | probably_damaging(0.918) | TCGA-AA-3492-01 | Colorectum | colon adenocarcinoma | Female | >=65 | I/II | Unknown | Unknown | SD | |
| CSNK1G3 | SNV | Missense_Mutation | c.191A>G | p.Tyr64Cys | p.Y64C | Q9Y6M4 | protein_coding | deleterious(0.01) | probably_damaging(0.963) | TCGA-AA-3815-01 | Colorectum | colon adenocarcinoma | Female | >=65 | I/II | Unknown | Unknown | SD | |
| CSNK1G3 | SNV | Missense_Mutation | c.881N>C | p.Asp294Ala | p.D294A | Q9Y6M4 | protein_coding | deleterious(0.01) | possibly_damaging(0.829) | TCGA-AA-A010-01 | Colorectum | colon adenocarcinoma | Female | <65 | I/II | Chemotherapy | folinic | CR | |
| CSNK1G3 | SNV | Missense_Mutation | novel | c.245N>C | p.Gln82Pro | p.Q82P | Q9Y6M4 | protein_coding | deleterious(0) | possibly_damaging(0.875) | TCGA-CA-6717-01 | Colorectum | colon adenocarcinoma | Male | <65 | I/II | Chemotherapy | oxaliplatin | CR |
| CSNK1G3 | SNV | Missense_Mutation | novel | c.760N>A | p.Ala254Thr | p.A254T | Q9Y6M4 | protein_coding | deleterious(0.01) | probably_damaging(0.971) | TCGA-CK-5913-01 | Colorectum | colon adenocarcinoma | Female | <65 | I/II | Unknown | Unknown | SD |
| Page: 1 2 3 4 5 6 7 |
Top |
Related drugs of malignant transformation related genes |
| Identification of chemicals and drugs interact with genes involved in malignant transfromation |
| (DGIdb 4.0) |
| Entrez ID | Symbol | Category | Interaction Types | Drug Claim Name | Drug Name | PMIDs |
| 1456 | CSNK1G3 | SERINE THREONINE KINASE, DRUGGABLE GENOME, KINASE, ENZYME | TAK-715 | TAK-715 | ||
| 1456 | CSNK1G3 | SERINE THREONINE KINASE, DRUGGABLE GENOME, KINASE, ENZYME | CENISERTIB | CENISERTIB | ||
| 1456 | CSNK1G3 | SERINE THREONINE KINASE, DRUGGABLE GENOME, KINASE, ENZYME | inhibitor | 249565894 | ||
| 1456 | CSNK1G3 | SERINE THREONINE KINASE, DRUGGABLE GENOME, KINASE, ENZYME | SP-600125 | SP-600125 | ||
| 1456 | CSNK1G3 | SERINE THREONINE KINASE, DRUGGABLE GENOME, KINASE, ENZYME | PHA-767491 | CHEMBL225519 | ||
| 1456 | CSNK1G3 | SERINE THREONINE KINASE, DRUGGABLE GENOME, KINASE, ENZYME | GS 6201 | GS 6201 |
| Page: 1 |

Copyright 2023-Present -The University of Texas Health Science Center at Houston |