| Tissue | Expression Dynamics | Abbreviation |
| Esophagus | 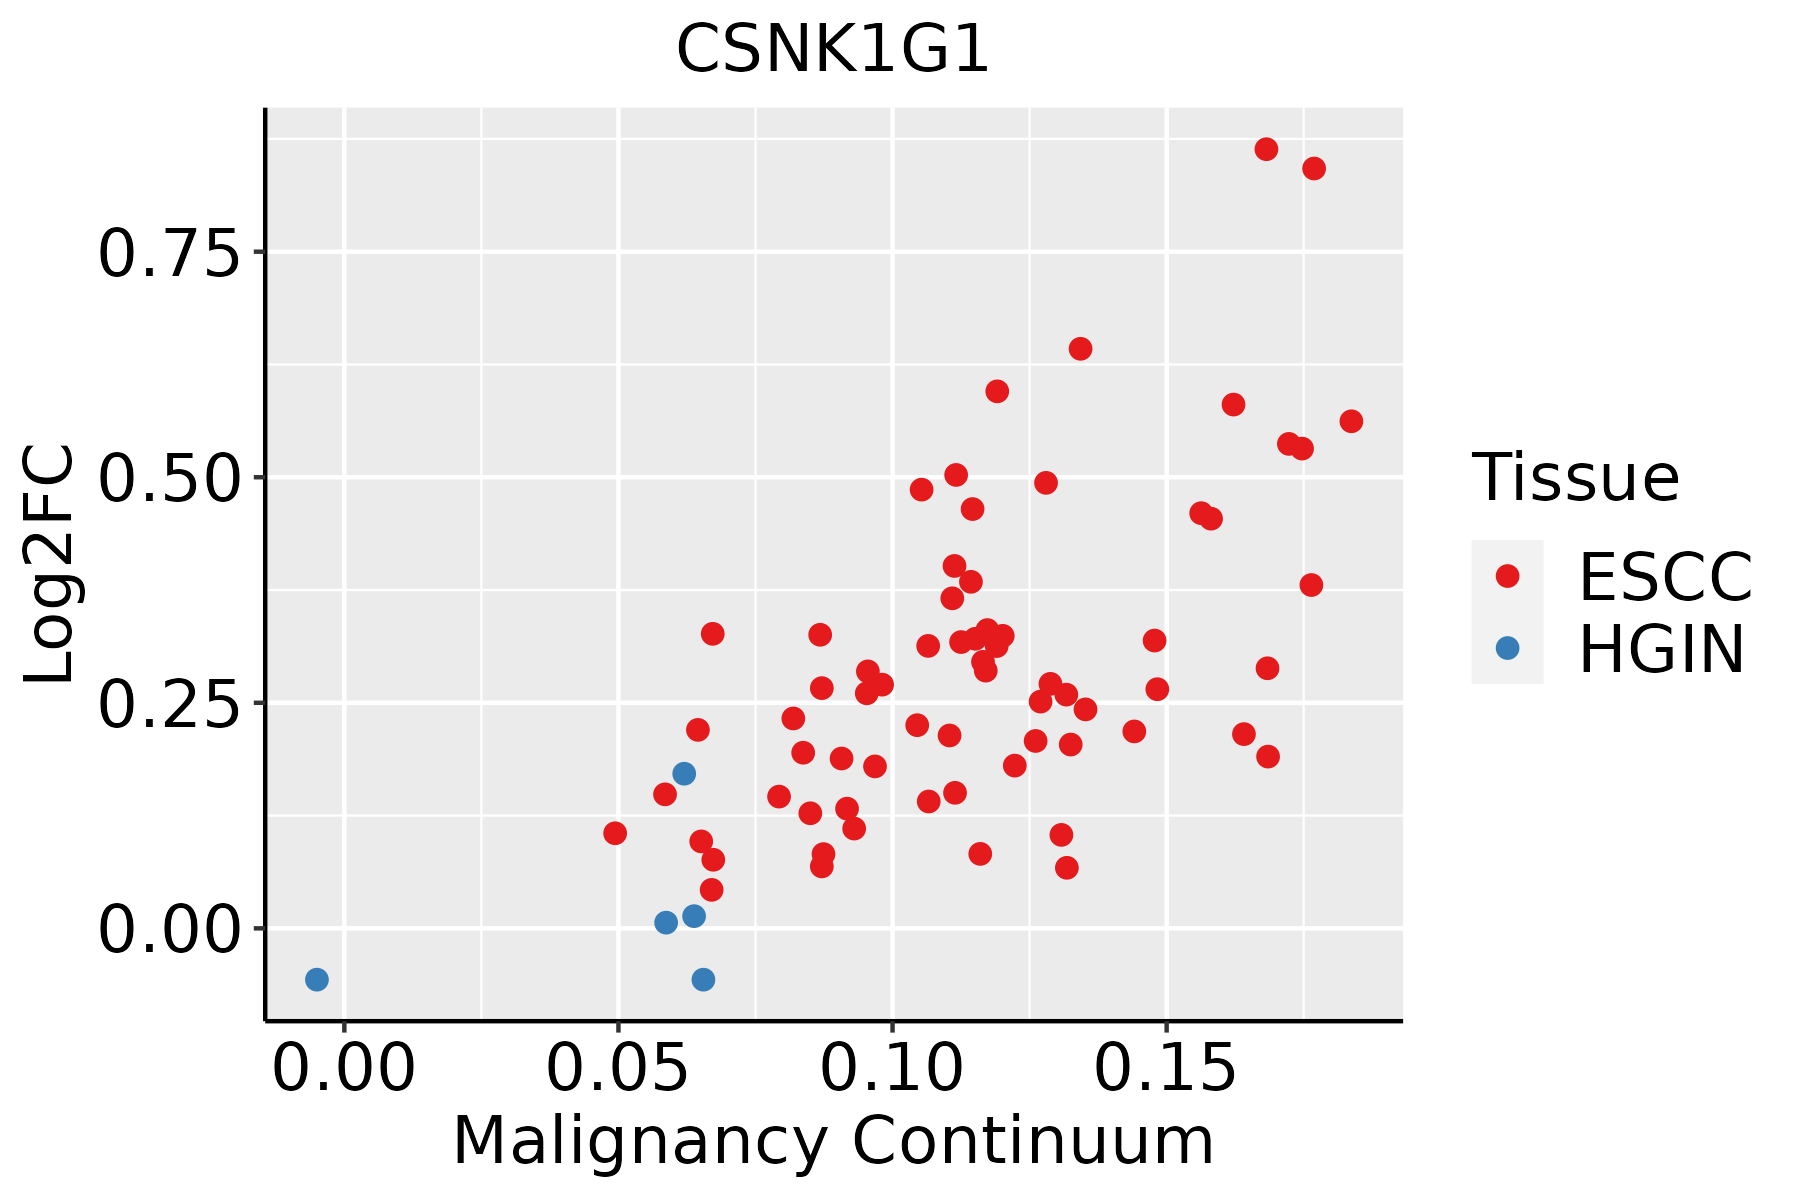 | ESCC: Esophageal squamous cell carcinoma |
| HGIN: High-grade intraepithelial neoplasias |
| LGIN: Low-grade intraepithelial neoplasias |
| Liver |  | HCC: Hepatocellular carcinoma |
| NAFLD: Non-alcoholic fatty liver disease |
| Lung | 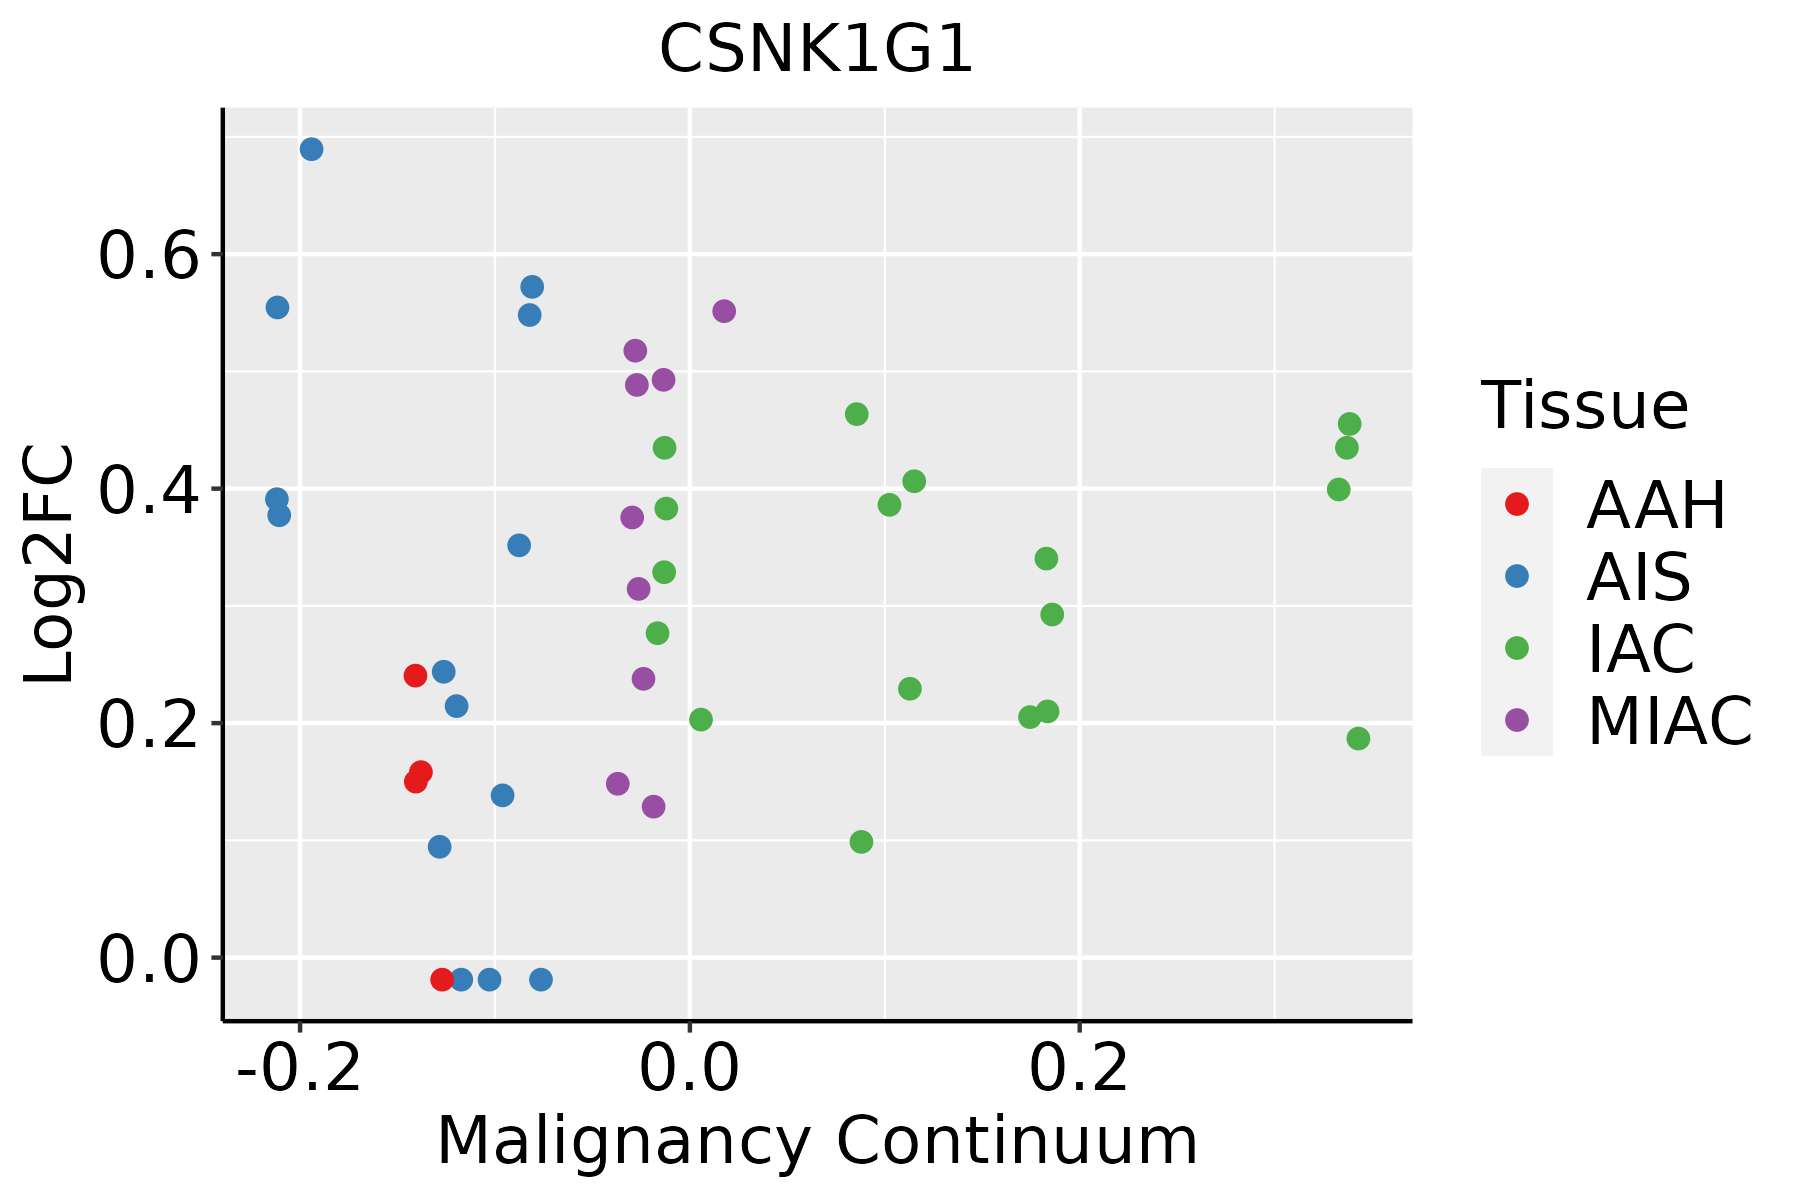 | AAH: Atypical adenomatous hyperplasia |
| AIS: Adenocarcinoma in situ |
| IAC: Invasive lung adenocarcinoma |
| MIA: Minimally invasive adenocarcinoma |
| Oral Cavity |  | EOLP: Erosive Oral lichen planus |
| LP: leukoplakia |
| NEOLP: Non-erosive oral lichen planus |
| OSCC: Oral squamous cell carcinoma |
| Prostate | 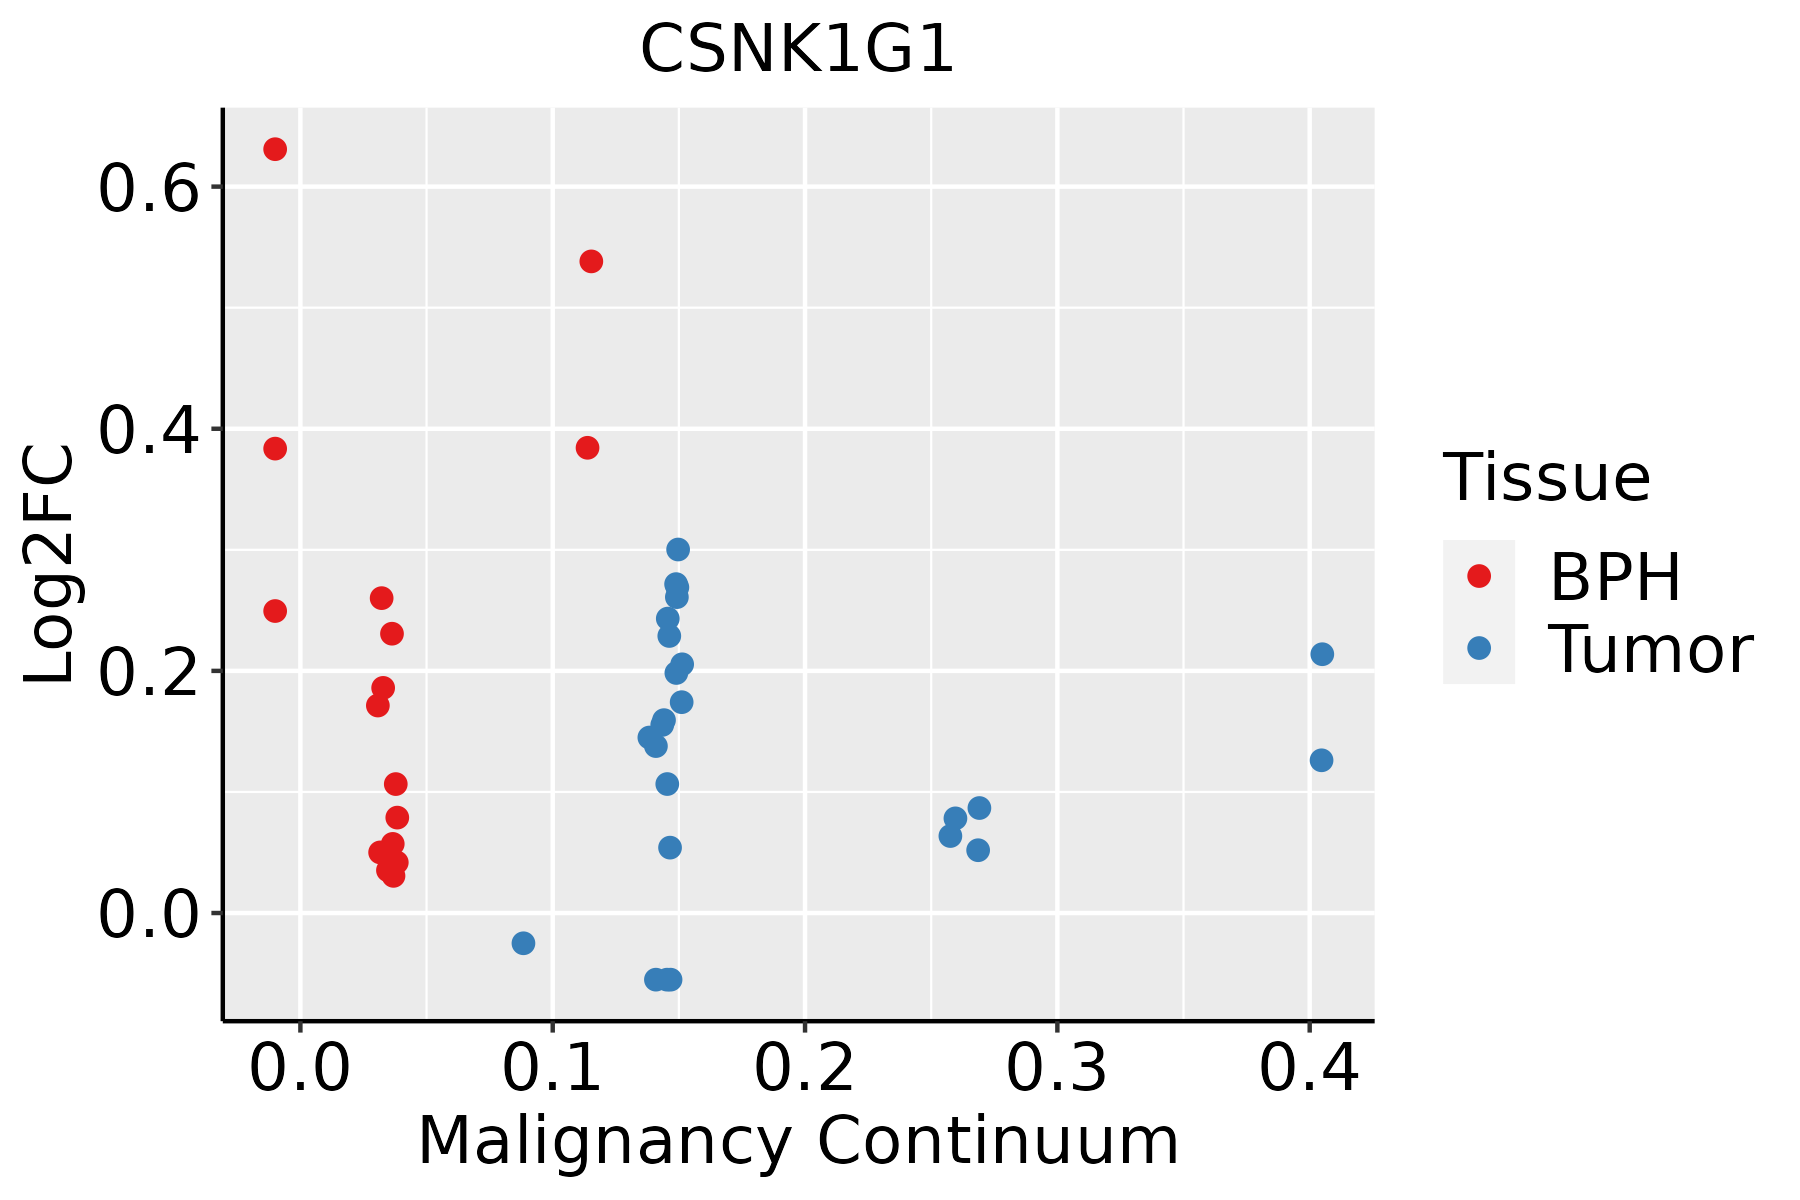 | BPH: Benign Prostatic Hyperplasia |
| GO ID | Tissue | Disease Stage | Description | Gene Ratio | Bg Ratio | pvalue | p.adjust | Count |
| GO:001605517 | Esophagus | ESCC | Wnt signaling pathway | 268/8552 | 444/18723 | 2.32e-10 | 6.58e-09 | 268 |
| GO:019873817 | Esophagus | ESCC | cell-cell signaling by wnt | 269/8552 | 446/18723 | 2.41e-10 | 6.79e-09 | 269 |
| GO:003011117 | Esophagus | ESCC | regulation of Wnt signaling pathway | 194/8552 | 328/18723 | 5.39e-07 | 7.14e-06 | 194 |
| GO:006007016 | Esophagus | ESCC | canonical Wnt signaling pathway | 180/8552 | 303/18723 | 9.15e-07 | 1.17e-05 | 180 |
| GO:006082817 | Esophagus | ESCC | regulation of canonical Wnt signaling pathway | 153/8552 | 253/18723 | 1.38e-06 | 1.67e-05 | 153 |
| GO:00182099 | Esophagus | ESCC | peptidyl-serine modification | 196/8552 | 338/18723 | 3.07e-06 | 3.47e-05 | 196 |
| GO:001810515 | Esophagus | ESCC | peptidyl-serine phosphorylation | 184/8552 | 315/18723 | 3.22e-06 | 3.61e-05 | 184 |
| GO:009026316 | Esophagus | ESCC | positive regulation of canonical Wnt signaling pathway | 69/8552 | 106/18723 | 4.22e-05 | 3.39e-04 | 69 |
| GO:003017716 | Esophagus | ESCC | positive regulation of Wnt signaling pathway | 87/8552 | 140/18723 | 6.18e-05 | 4.73e-04 | 87 |
| GO:019873821 | Liver | HCC | cell-cell signaling by wnt | 247/7958 | 446/18723 | 2.11e-08 | 4.96e-07 | 247 |
| GO:001605521 | Liver | HCC | Wnt signaling pathway | 245/7958 | 444/18723 | 3.68e-08 | 8.09e-07 | 245 |
| GO:003011121 | Liver | HCC | regulation of Wnt signaling pathway | 180/7958 | 328/18723 | 3.62e-06 | 4.72e-05 | 180 |
| GO:001810511 | Liver | HCC | peptidyl-serine phosphorylation | 169/7958 | 315/18723 | 3.86e-05 | 3.81e-04 | 169 |
| GO:006007021 | Liver | HCC | canonical Wnt signaling pathway | 162/7958 | 303/18723 | 7.00e-05 | 6.32e-04 | 162 |
| GO:006082821 | Liver | HCC | regulation of canonical Wnt signaling pathway | 137/7958 | 253/18723 | 1.15e-04 | 9.70e-04 | 137 |
| GO:001820911 | Liver | HCC | peptidyl-serine modification | 177/7958 | 338/18723 | 1.45e-04 | 1.17e-03 | 177 |
| GO:003017721 | Liver | HCC | positive regulation of Wnt signaling pathway | 81/7958 | 140/18723 | 1.73e-04 | 1.36e-03 | 81 |
| GO:009026321 | Liver | HCC | positive regulation of canonical Wnt signaling pathway | 62/7958 | 106/18723 | 6.44e-04 | 3.99e-03 | 62 |
| GO:00160556 | Lung | IAC | Wnt signaling pathway | 95/2061 | 444/18723 | 1.13e-10 | 2.80e-08 | 95 |
| GO:01987386 | Lung | IAC | cell-cell signaling by wnt | 95/2061 | 446/18723 | 1.46e-10 | 3.48e-08 | 95 |
| Hugo Symbol | Variant Class | Variant Classification | dbSNP RS | HGVSc | HGVSp | HGVSp Short | SWISSPROT | BIOTYPE | SIFT | PolyPhen | Tumor Sample Barcode | Tissue | Histology | Sex | Age | Stage | Therapy Types | Drugs | Outcome |
| CSNK1G1 | SNV | Missense_Mutation | novel | c.904N>T | p.Pro302Ser | p.P302S | Q9HCP0 | protein_coding | deleterious(0.03) | possibly_damaging(0.839) | TCGA-2W-A8YY-01 | Cervix | cervical & endocervical cancer | Female | <65 | I/II | Chemotherapy | cisplatin | CR |
| CSNK1G1 | SNV | Missense_Mutation | rs779009615 | c.488N>A | p.Arg163Gln | p.R163Q | Q9HCP0 | protein_coding | deleterious(0) | probably_damaging(0.997) | TCGA-MA-AA41-01 | Cervix | cervical & endocervical cancer | Female | <65 | I/II | Unknown | Unknown | SD |
| CSNK1G1 | SNV | Missense_Mutation | novel | c.898N>C | p.Glu300Gln | p.E300Q | Q9HCP0 | protein_coding | deleterious(0.02) | benign(0.41) | TCGA-VS-A958-01 | Cervix | cervical & endocervical cancer | Female | <65 | I/II | Chemotherapy | cisplatin | CR |
| CSNK1G1 | SNV | Missense_Mutation | | c.1100G>A | p.Arg367Gln | p.R367Q | Q9HCP0 | protein_coding | tolerated(0.11) | benign(0.246) | TCGA-G4-6306-01 | Colorectum | colon adenocarcinoma | Male | >=65 | I/II | Unknown | Unknown | SD |
| CSNK1G1 | SNV | Missense_Mutation | novel | c.581N>G | p.Tyr194Cys | p.Y194C | Q9HCP0 | protein_coding | deleterious(0) | probably_damaging(1) | TCGA-AJ-A3EL-01 | Endometrium | uterine corpus endometrioid carcinoma | Female | <65 | I/II | Unknown | Unknown | SD |
| CSNK1G1 | SNV | Missense_Mutation | | c.508T>G | p.Phe170Val | p.F170V | Q9HCP0 | protein_coding | deleterious(0.02) | probably_damaging(0.997) | TCGA-AP-A051-01 | Endometrium | uterine corpus endometrioid carcinoma | Female | >=65 | I/II | Unknown | Unknown | SD |
| CSNK1G1 | SNV | Missense_Mutation | | c.38G>A | p.Arg13Gln | p.R13Q | Q9HCP0 | protein_coding | deleterious_low_confidence(0.03) | benign(0.145) | TCGA-AP-A0LM-01 | Endometrium | uterine corpus endometrioid carcinoma | Female | <65 | III/IV | Chemotherapy | cisplatin | SD |
| CSNK1G1 | SNV | Missense_Mutation | rs145663344 | c.766N>A | p.Ala256Thr | p.A256T | Q9HCP0 | protein_coding | deleterious(0.01) | probably_damaging(0.973) | TCGA-AP-A1DK-01 | Endometrium | uterine corpus endometrioid carcinoma | Female | <65 | I/II | Unknown | Unknown | SD |
| CSNK1G1 | SNV | Missense_Mutation | rs377487424 | c.452G>A | p.Arg151Gln | p.R151Q | Q9HCP0 | protein_coding | deleterious(0) | probably_damaging(0.995) | TCGA-AP-A1E0-01 | Endometrium | uterine corpus endometrioid carcinoma | Female | <65 | III/IV | Chemotherapy | paclitaxel | SD |
| CSNK1G1 | SNV | Missense_Mutation | | c.692N>A | p.Arg231Lys | p.R231K | Q9HCP0 | protein_coding | deleterious(0) | probably_damaging(0.979) | TCGA-AX-A06F-01 | Endometrium | uterine corpus endometrioid carcinoma | Female | <65 | III/IV | Chemotherapy | carboplatin | SD |
| Entrez ID | Symbol | Category | Interaction Types | Drug Claim Name | Drug Name | PMIDs |
| 53944 | CSNK1G1 | SERINE THREONINE KINASE, KINASE, DRUGGABLE GENOME, ENZYME | inhibitor | 249565843 | | |
| 53944 | CSNK1G1 | SERINE THREONINE KINASE, KINASE, DRUGGABLE GENOME, ENZYME | | PF-562271 | PF-00562271 | |
| 53944 | CSNK1G1 | SERINE THREONINE KINASE, KINASE, DRUGGABLE GENOME, ENZYME | | CENISERTIB | CENISERTIB | |
| 53944 | CSNK1G1 | SERINE THREONINE KINASE, KINASE, DRUGGABLE GENOME, ENZYME | | ALSTERPAULLONE | ALSTERPAULLONE | |
| 53944 | CSNK1G1 | SERINE THREONINE KINASE, KINASE, DRUGGABLE GENOME, ENZYME | | ILORASERTIB | ILORASERTIB | |
| 53944 | CSNK1G1 | SERINE THREONINE KINASE, KINASE, DRUGGABLE GENOME, ENZYME | | CHIR-99021 | CHIR-99021 | |
| 53944 | CSNK1G1 | SERINE THREONINE KINASE, KINASE, DRUGGABLE GENOME, ENZYME | inhibitor | 363894217 | VORUCICLIB | |
| 53944 | CSNK1G1 | SERINE THREONINE KINASE, KINASE, DRUGGABLE GENOME, ENZYME | | CYC-116 | CYC-116 | |
| 53944 | CSNK1G1 | SERINE THREONINE KINASE, KINASE, DRUGGABLE GENOME, ENZYME | | PHA-767491 | CHEMBL225519 | |
| 53944 | CSNK1G1 | SERINE THREONINE KINASE, KINASE, DRUGGABLE GENOME, ENZYME | | (RS)-ROSCOVITINE | (RS)-ROSCOVITINE | |


