
|
|||||
|
 | |
| |
| |
| |
| |
| |
|
Gene: CSNK1D |
Gene summary for CSNK1D |
| Gene information | Species | Human | Gene symbol | CSNK1D | Gene ID | 1453 |
| Gene name | casein kinase 1 delta | |
| Gene Alias | ASPS | |
| Cytomap | 17q25.3 | |
| Gene Type | protein-coding | GO ID | GO:0000226 | UniProtAcc | P48730 |
Top |
Malignant transformation analysis |
| Identification of the aberrant gene expression in precancerous and cancerous lesions by comparing the gene expression of stem-like cells in diseased tissues with normal stem cells |
| Entrez ID | Symbol | Replicates | Species | Organ | Tissue | Adj P-value | Log2FC | Malignancy |
| 1453 | CSNK1D | HTA11_2487_2000001011 | Human | Colorectum | SER | 6.88e-05 | 4.42e-01 | -0.1808 |
| 1453 | CSNK1D | HTA11_1938_2000001011 | Human | Colorectum | AD | 3.35e-06 | 5.30e-01 | -0.0811 |
| 1453 | CSNK1D | HTA11_347_2000001011 | Human | Colorectum | AD | 2.01e-07 | 4.15e-01 | -0.1954 |
| 1453 | CSNK1D | HTA11_696_2000001011 | Human | Colorectum | AD | 5.18e-05 | 4.51e-01 | -0.1464 |
| 1453 | CSNK1D | HTA11_1391_2000001011 | Human | Colorectum | AD | 6.41e-08 | 5.92e-01 | -0.059 |
| 1453 | CSNK1D | HTA11_866_3004761011 | Human | Colorectum | AD | 2.03e-05 | 3.96e-01 | 0.096 |
| 1453 | CSNK1D | HTA11_6818_2000001021 | Human | Colorectum | AD | 3.30e-03 | 4.35e-01 | 0.0588 |
| 1453 | CSNK1D | HTA11_99999965104_69814 | Human | Colorectum | MSS | 1.35e-04 | 5.38e-01 | 0.281 |
| 1453 | CSNK1D | HTA11_99999971662_82457 | Human | Colorectum | MSS | 2.48e-09 | 6.21e-01 | 0.3859 |
| 1453 | CSNK1D | HTA11_99999973899_84307 | Human | Colorectum | MSS | 1.27e-04 | 6.42e-01 | 0.2585 |
| 1453 | CSNK1D | HTA11_99999974143_84620 | Human | Colorectum | MSS | 1.44e-08 | 4.52e-01 | 0.3005 |
| 1453 | CSNK1D | A015-C-203 | Human | Colorectum | FAP | 7.78e-07 | -6.37e-02 | -0.1294 |
| 1453 | CSNK1D | A002-C-205 | Human | Colorectum | FAP | 3.21e-04 | -5.61e-02 | -0.1236 |
| 1453 | CSNK1D | A015-C-006 | Human | Colorectum | FAP | 2.18e-02 | -8.81e-02 | -0.0994 |
| 1453 | CSNK1D | A002-C-114 | Human | Colorectum | FAP | 1.83e-02 | -3.31e-02 | -0.1561 |
| 1453 | CSNK1D | A015-C-104 | Human | Colorectum | FAP | 5.40e-09 | 3.09e-02 | -0.1899 |
| 1453 | CSNK1D | A002-C-016 | Human | Colorectum | FAP | 1.99e-05 | -1.27e-01 | 0.0521 |
| 1453 | CSNK1D | A002-C-116 | Human | Colorectum | FAP | 1.62e-06 | -9.44e-02 | -0.0452 |
| 1453 | CSNK1D | A018-E-020 | Human | Colorectum | FAP | 2.22e-02 | -7.00e-02 | -0.2034 |
| 1453 | CSNK1D | F034 | Human | Colorectum | FAP | 1.43e-02 | -7.29e-02 | -0.0665 |
| Page: 1 2 3 4 5 6 7 8 |
| Tissue | Expression Dynamics | Abbreviation |
| Colorectum (GSE201348) |  | FAP: Familial adenomatous polyposis |
| CRC: Colorectal cancer | ||
| Colorectum (HTA11) |  | AD: Adenomas |
| SER: Sessile serrated lesions | ||
| MSI-H: Microsatellite-high colorectal cancer | ||
| MSS: Microsatellite stable colorectal cancer | ||
| Esophagus | 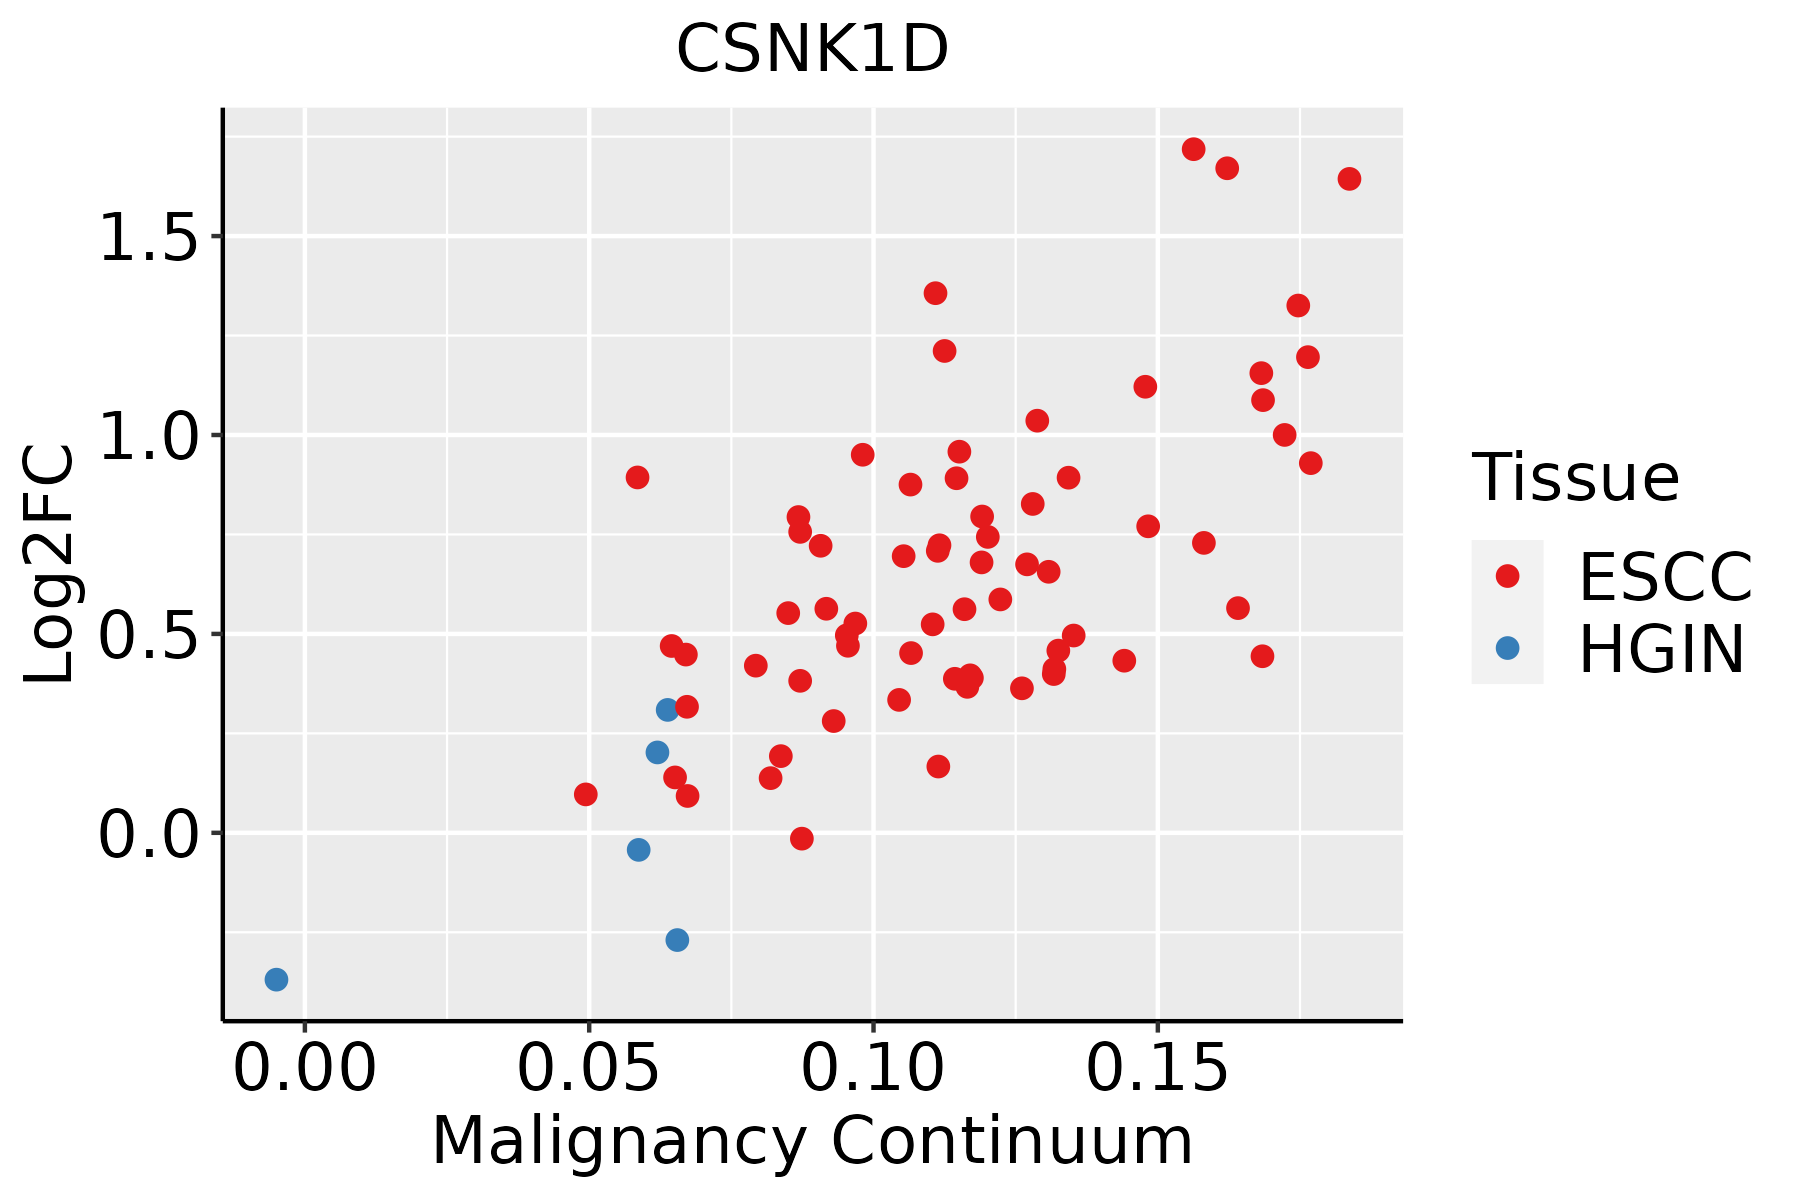 | ESCC: Esophageal squamous cell carcinoma |
| HGIN: High-grade intraepithelial neoplasias | ||
| LGIN: Low-grade intraepithelial neoplasias | ||
| Liver |  | HCC: Hepatocellular carcinoma |
| NAFLD: Non-alcoholic fatty liver disease | ||
| Oral Cavity | 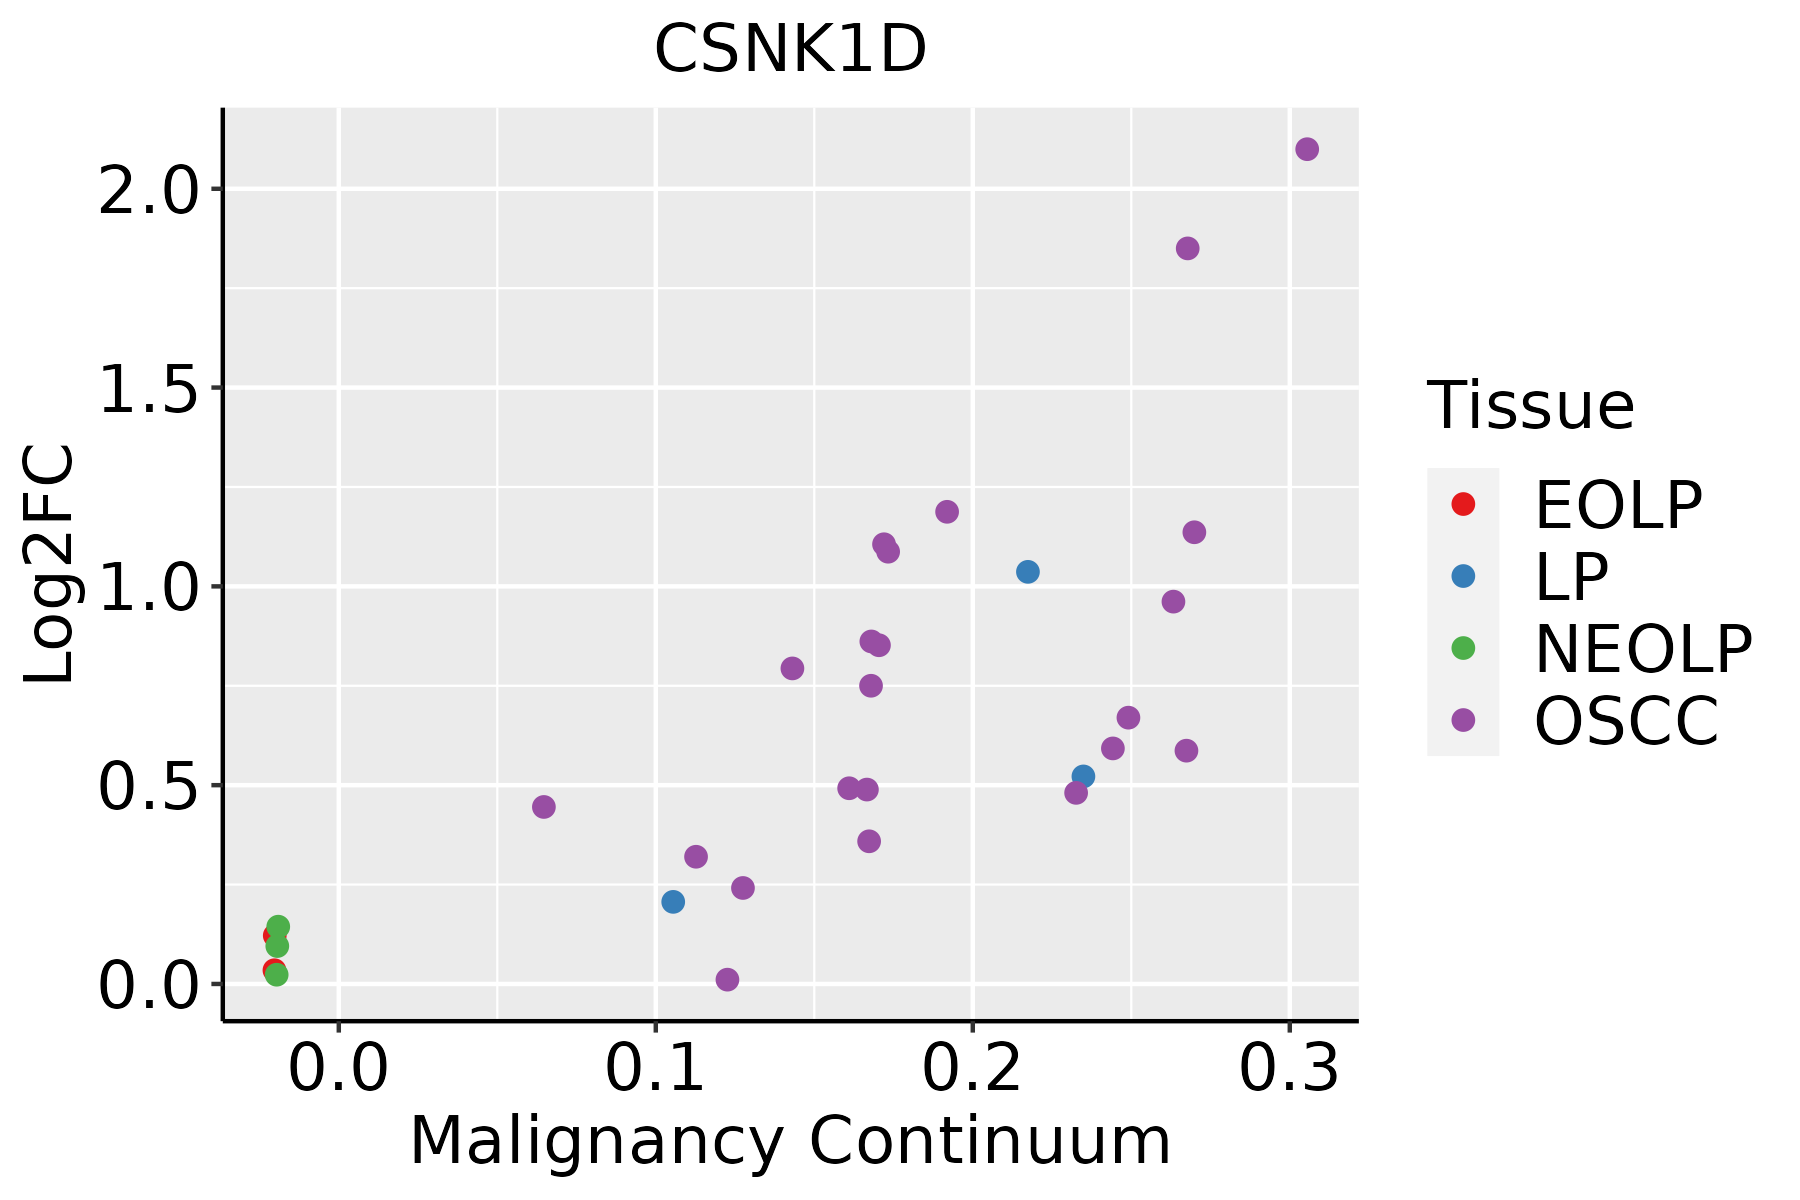 | EOLP: Erosive Oral lichen planus |
| LP: leukoplakia | ||
| NEOLP: Non-erosive oral lichen planus | ||
| OSCC: Oral squamous cell carcinoma | ||
| Prostate | 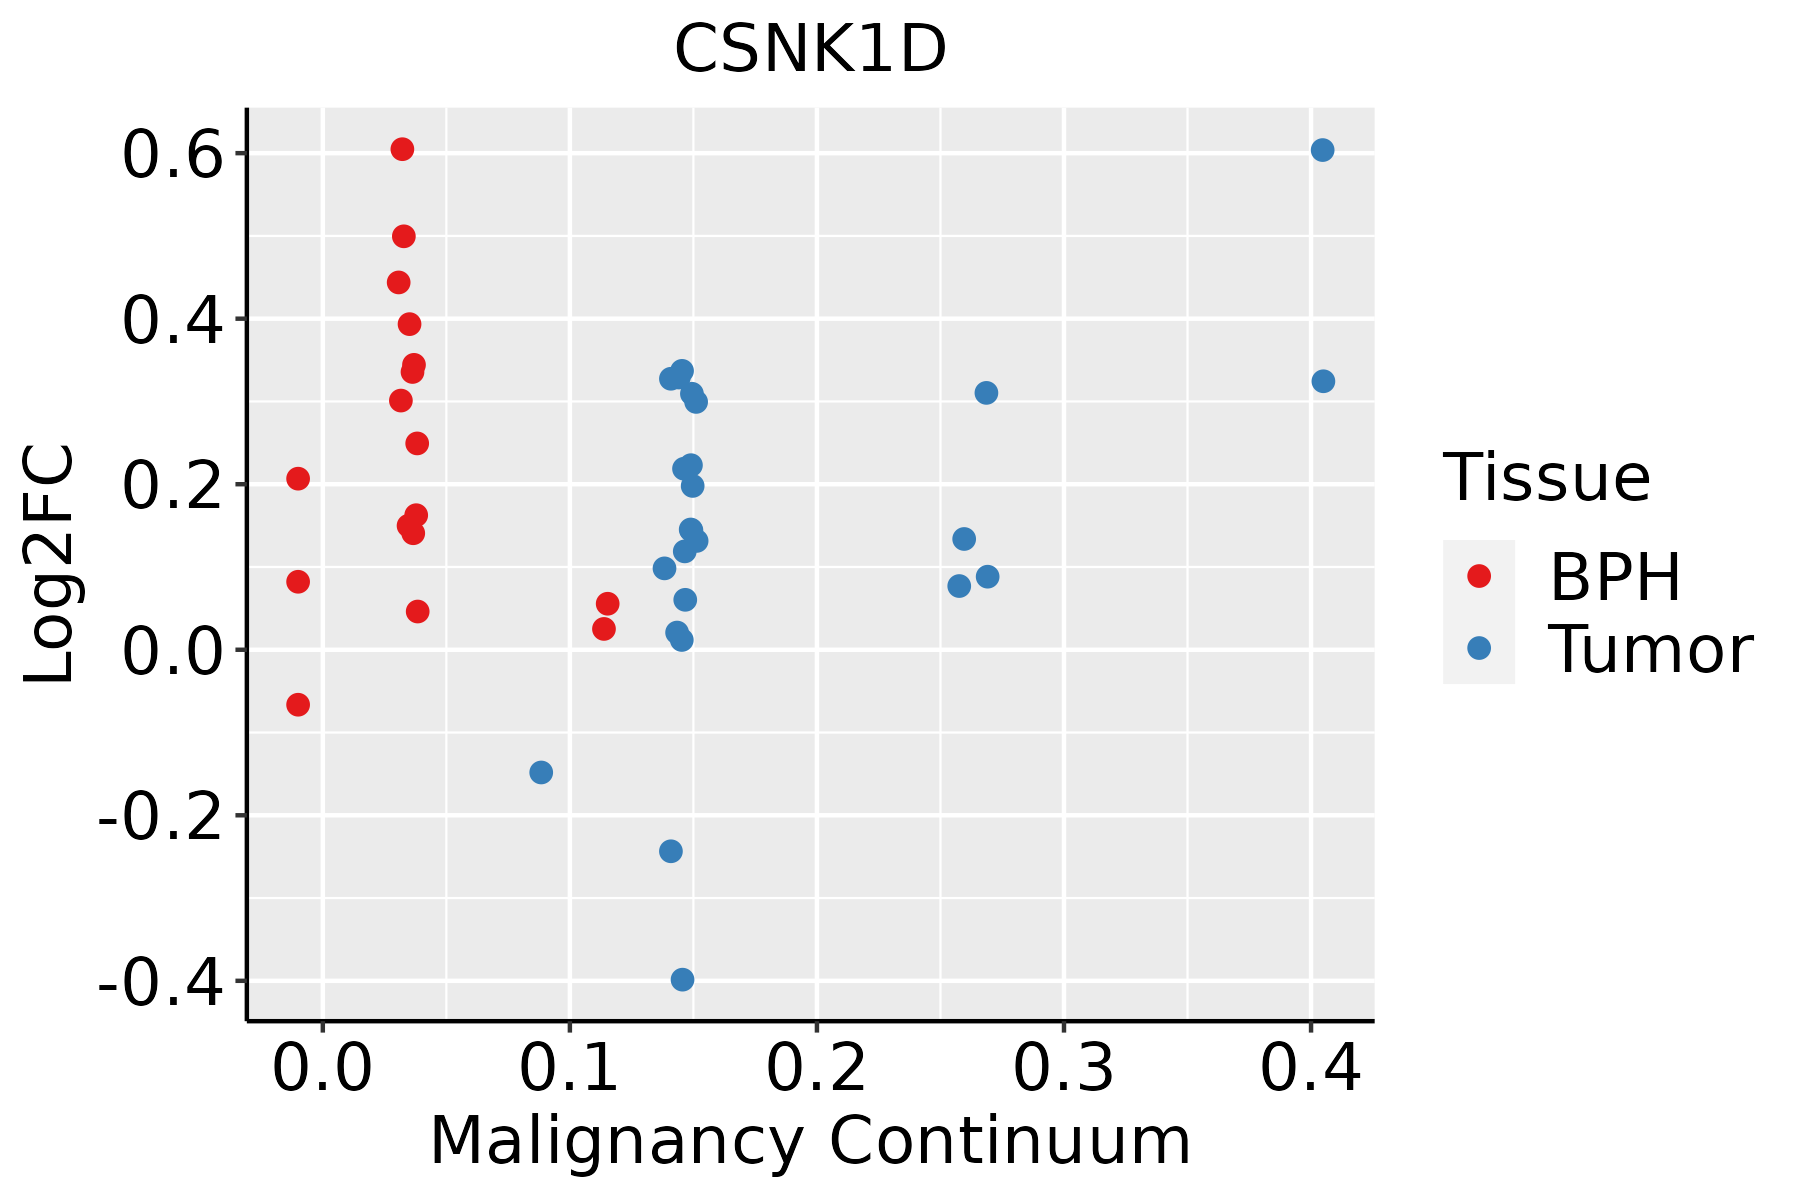 | BPH: Benign Prostatic Hyperplasia |
| Skin | 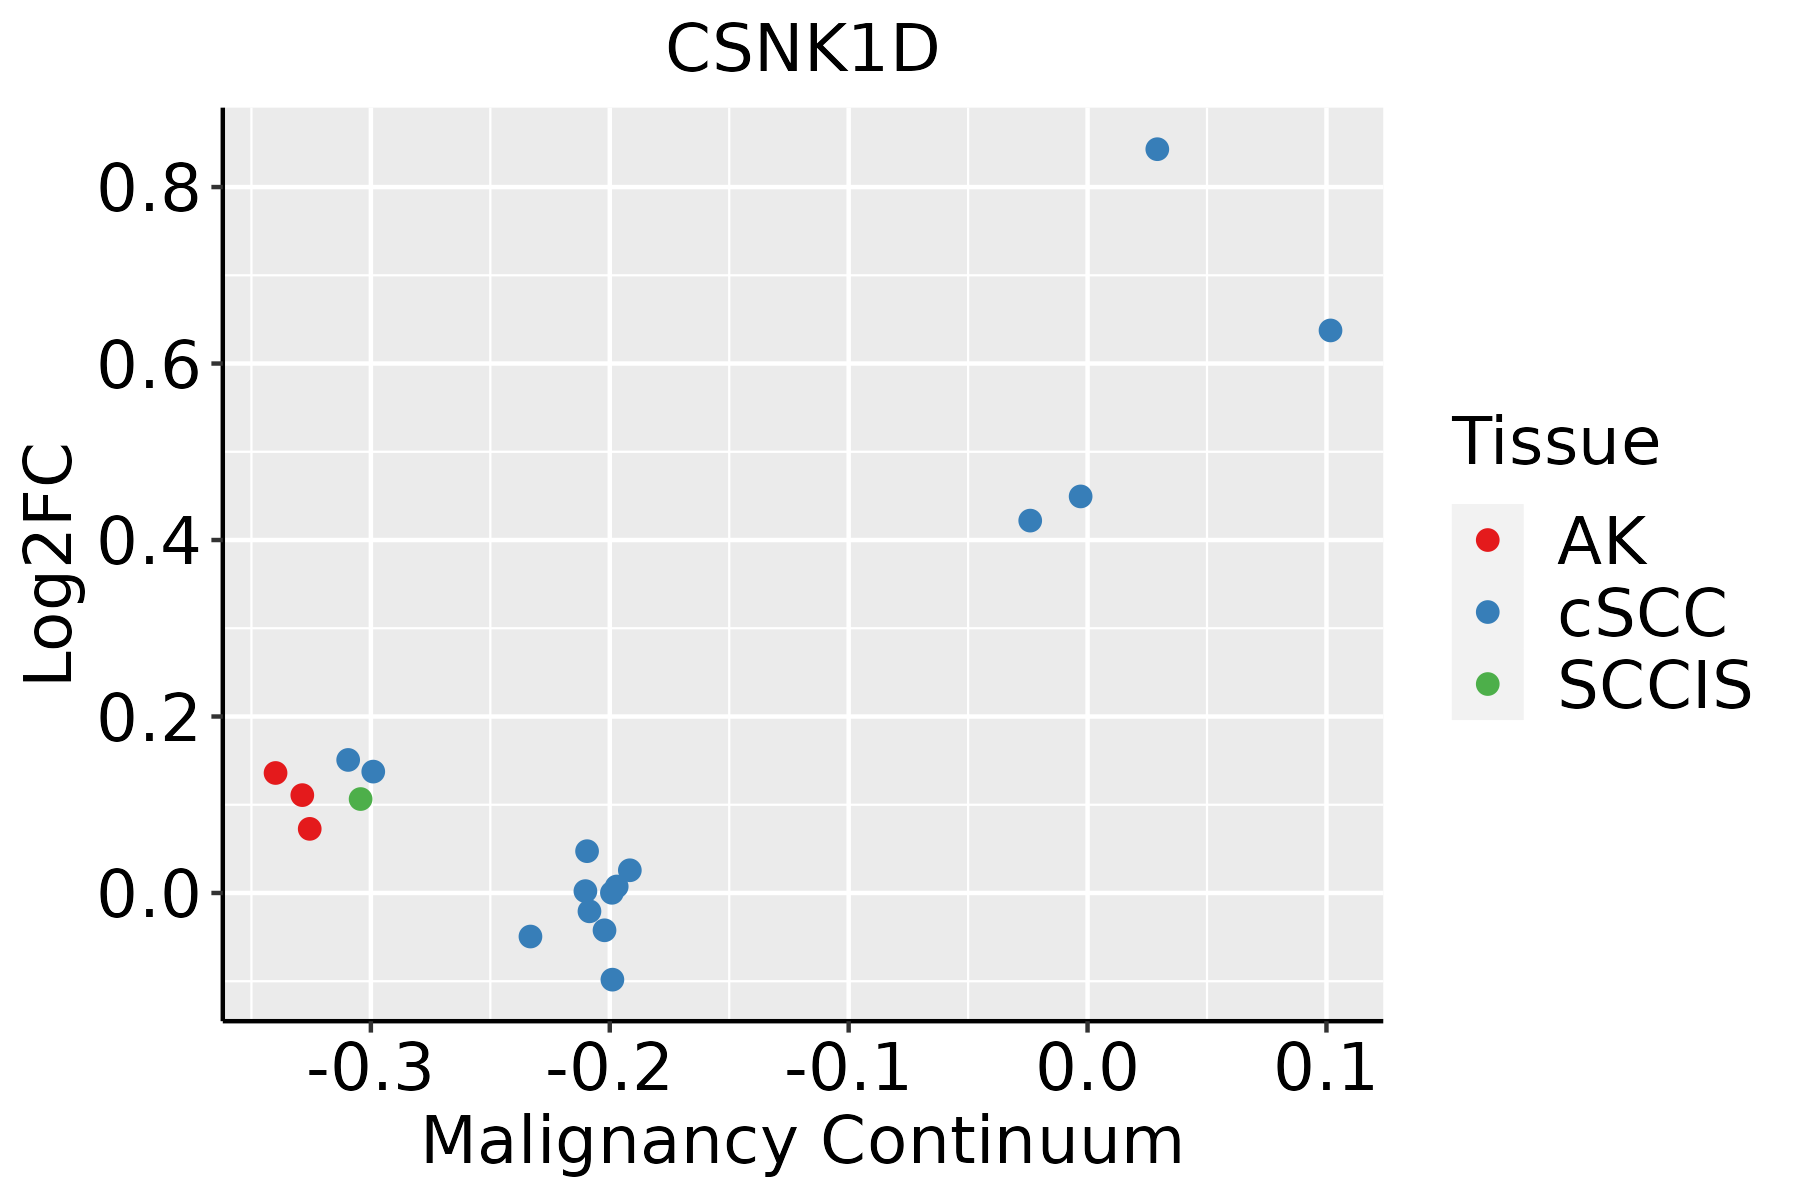 | AK: Actinic keratosis |
| cSCC: Cutaneous squamous cell carcinoma | ||
| SCCIS:squamous cell carcinoma in situ | ||
| Thyroid | 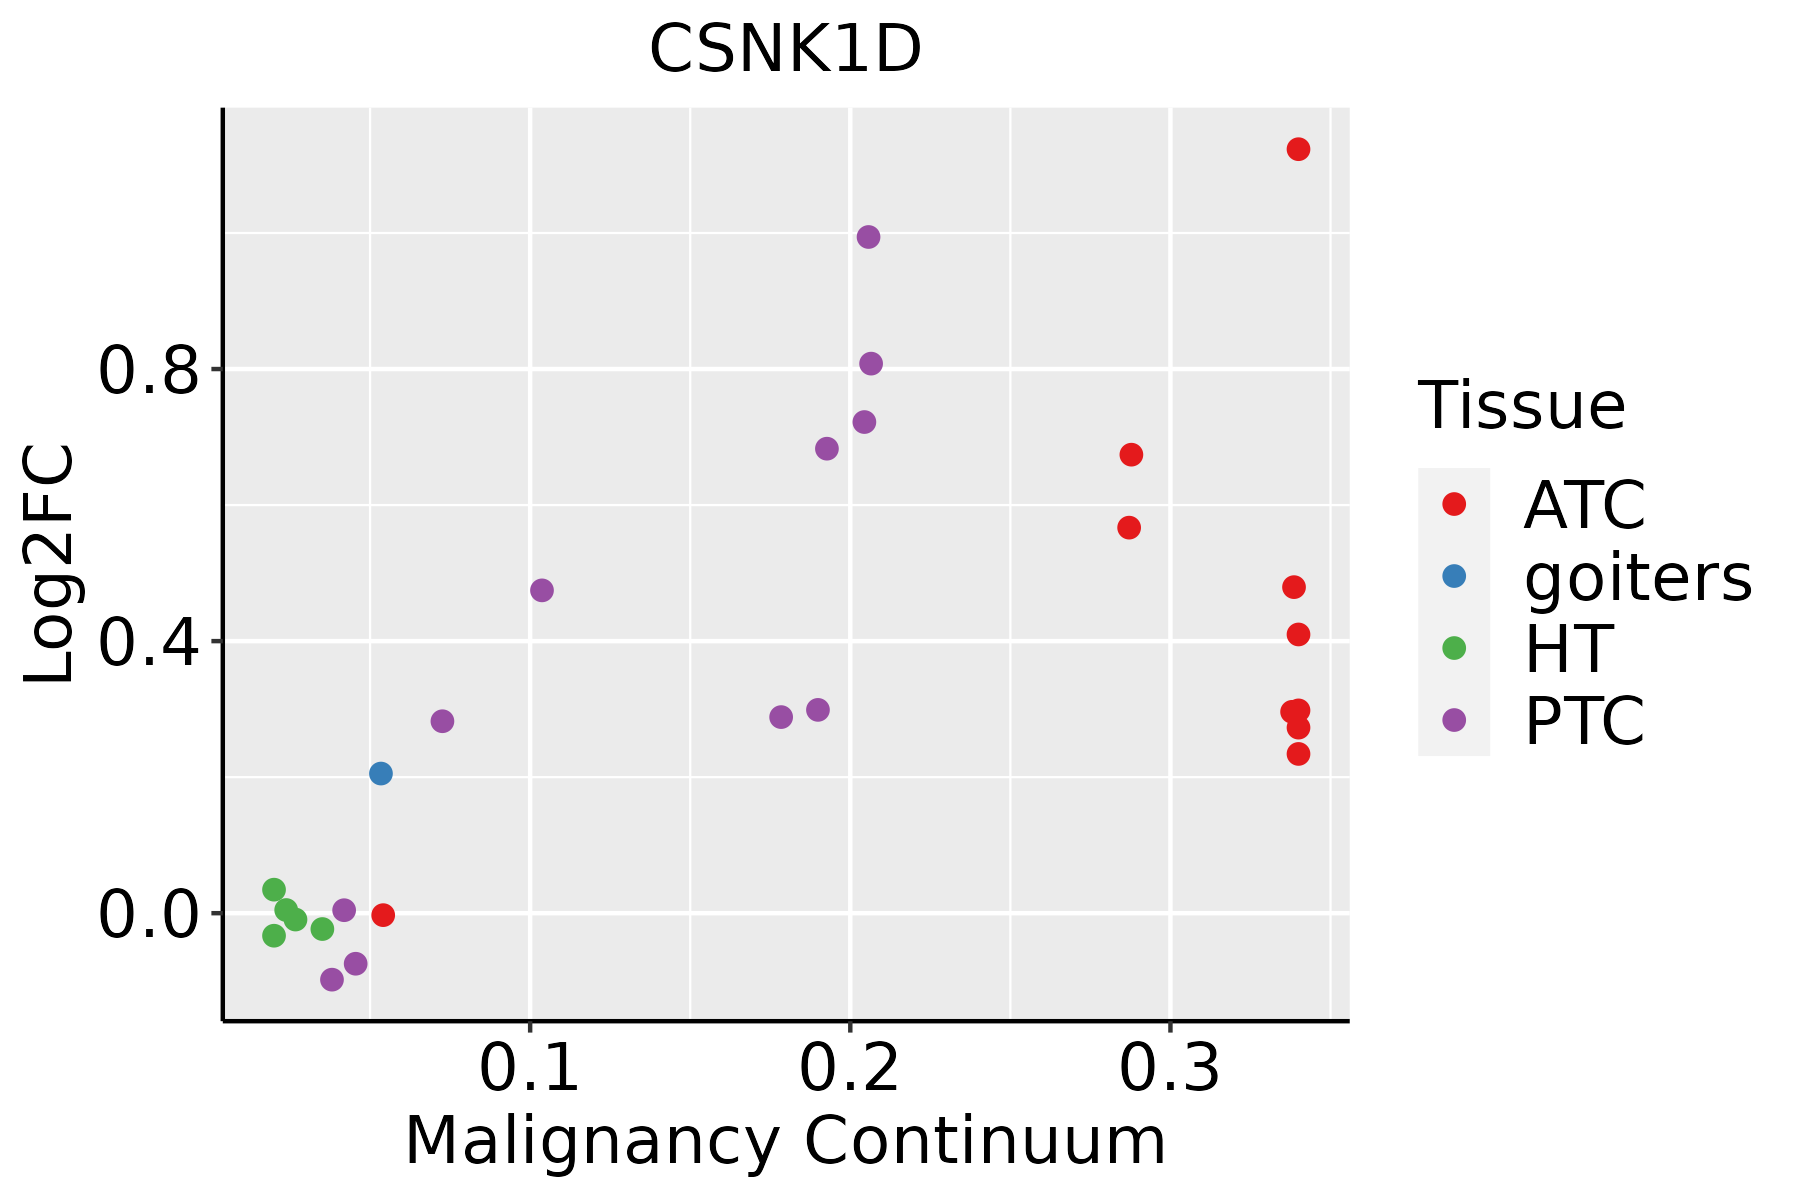 | ATC: Anaplastic thyroid cancer |
| HT: Hashimoto's thyroiditis | ||
| PTC: Papillary thyroid cancer |
| ∗log2FC in expression of this searched gene in stem-like cells from each diseased tissue sample relative to stem-like cells in normal samples in each tissue plotted against the malignancy continuum. Samples are colored based on if they are from different disease stage. |
Top |
Malignant transformation related pathway analysis |
| Find out the enriched GO biological processes and KEGG pathways involved in transition from healthy to precancer to cancer |
| Tissue | Disease Stage | Enriched GO biological Processes |
| Colorectum | AD |  |
| Colorectum | SER |  |
| Colorectum | MSS |  |
| Colorectum | MSI-H |  |
| Colorectum | FAP |  |
| ∗Top 15 enriched GO BP terms are showed in the bar plot of each disease state in each tissue. Each row represents a significant GO biological process which is colored according to the -log10(p.adjust). |
| Page: 1 2 3 4 5 6 7 8 9 |
| GO ID | Tissue | Disease Stage | Description | Gene Ratio | Bg Ratio | pvalue | p.adjust | Count |
| GO:0042176 | Colorectum | AD | regulation of protein catabolic process | 160/3918 | 391/18723 | 1.06e-19 | 7.34e-17 | 160 |
| GO:0009896 | Colorectum | AD | positive regulation of catabolic process | 180/3918 | 492/18723 | 4.33e-16 | 1.94e-13 | 180 |
| GO:1903362 | Colorectum | AD | regulation of cellular protein catabolic process | 109/3918 | 255/18723 | 2.14e-15 | 6.08e-13 | 109 |
| GO:0010498 | Colorectum | AD | proteasomal protein catabolic process | 174/3918 | 490/18723 | 3.18e-14 | 7.66e-12 | 174 |
| GO:0031331 | Colorectum | AD | positive regulation of cellular catabolic process | 156/3918 | 427/18723 | 4.68e-14 | 1.05e-11 | 156 |
| GO:1903050 | Colorectum | AD | regulation of proteolysis involved in cellular protein catabolic process | 92/3918 | 221/18723 | 2.04e-12 | 3.19e-10 | 92 |
| GO:0051258 | Colorectum | AD | protein polymerization | 112/3918 | 297/18723 | 1.85e-11 | 2.27e-09 | 112 |
| GO:0045732 | Colorectum | AD | positive regulation of protein catabolic process | 92/3918 | 231/18723 | 3.85e-11 | 4.47e-09 | 92 |
| GO:0043161 | Colorectum | AD | proteasome-mediated ubiquitin-dependent protein catabolic process | 141/3918 | 412/18723 | 1.77e-10 | 1.68e-08 | 141 |
| GO:0048193 | Colorectum | AD | Golgi vesicle transport | 109/3918 | 296/18723 | 1.80e-10 | 1.68e-08 | 109 |
| GO:0045862 | Colorectum | AD | positive regulation of proteolysis | 129/3918 | 372/18723 | 4.04e-10 | 3.46e-08 | 129 |
| GO:0061136 | Colorectum | AD | regulation of proteasomal protein catabolic process | 75/3918 | 187/18723 | 1.65e-09 | 1.20e-07 | 75 |
| GO:2000058 | Colorectum | AD | regulation of ubiquitin-dependent protein catabolic process | 68/3918 | 164/18723 | 1.82e-09 | 1.31e-07 | 68 |
| GO:0051656 | Colorectum | AD | establishment of organelle localization | 131/3918 | 390/18723 | 3.00e-09 | 2.06e-07 | 131 |
| GO:1903364 | Colorectum | AD | positive regulation of cellular protein catabolic process | 62/3918 | 155/18723 | 4.66e-08 | 2.51e-06 | 62 |
| GO:0006900 | Colorectum | AD | vesicle budding from membrane | 32/3918 | 61/18723 | 5.38e-08 | 2.81e-06 | 32 |
| GO:0016050 | Colorectum | AD | vesicle organization | 101/3918 | 300/18723 | 1.65e-07 | 7.17e-06 | 101 |
| GO:0032434 | Colorectum | AD | regulation of proteasomal ubiquitin-dependent protein catabolic process | 54/3918 | 134/18723 | 2.51e-07 | 1.02e-05 | 54 |
| GO:1903052 | Colorectum | AD | positive regulation of proteolysis involved in cellular protein catabolic process | 53/3918 | 133/18723 | 4.93e-07 | 1.85e-05 | 53 |
| GO:2000060 | Colorectum | AD | positive regulation of ubiquitin-dependent protein catabolic process | 44/3918 | 107/18723 | 1.65e-06 | 5.03e-05 | 44 |
| Page: 1 2 3 4 5 6 7 8 9 10 11 12 13 14 15 16 17 18 19 20 21 22 23 24 25 26 27 28 29 30 31 32 33 34 35 36 37 38 39 |
| Pathway ID | Tissue | Disease Stage | Description | Gene Ratio | Bg Ratio | pvalue | p.adjust | qvalue | Count |
| hsa04390 | Colorectum | MSS | Hippo signaling pathway | 48/1875 | 157/8465 | 8.32e-03 | 3.10e-02 | 1.90e-02 | 48 |
| hsa043901 | Colorectum | MSS | Hippo signaling pathway | 48/1875 | 157/8465 | 8.32e-03 | 3.10e-02 | 1.90e-02 | 48 |
| hsa043902 | Colorectum | FAP | Hippo signaling pathway | 41/1404 | 157/8465 | 1.49e-03 | 7.91e-03 | 4.81e-03 | 41 |
| hsa043903 | Colorectum | FAP | Hippo signaling pathway | 41/1404 | 157/8465 | 1.49e-03 | 7.91e-03 | 4.81e-03 | 41 |
| hsa0439018 | Esophagus | ESCC | Hippo signaling pathway | 92/4205 | 157/8465 | 1.46e-02 | 3.31e-02 | 1.69e-02 | 92 |
| hsa0439019 | Esophagus | ESCC | Hippo signaling pathway | 92/4205 | 157/8465 | 1.46e-02 | 3.31e-02 | 1.69e-02 | 92 |
| hsa0439016 | Oral cavity | OSCC | Hippo signaling pathway | 86/3704 | 157/8465 | 3.30e-03 | 8.24e-03 | 4.20e-03 | 86 |
| hsa0439017 | Oral cavity | OSCC | Hippo signaling pathway | 86/3704 | 157/8465 | 3.30e-03 | 8.24e-03 | 4.20e-03 | 86 |
| hsa0439010 | Prostate | BPH | Hippo signaling pathway | 52/1718 | 157/8465 | 9.93e-05 | 6.00e-04 | 3.71e-04 | 52 |
| hsa047104 | Prostate | BPH | Circadian rhythm | 15/1718 | 34/8465 | 1.40e-03 | 5.85e-03 | 3.62e-03 | 15 |
| hsa0439015 | Prostate | BPH | Hippo signaling pathway | 52/1718 | 157/8465 | 9.93e-05 | 6.00e-04 | 3.71e-04 | 52 |
| hsa0471011 | Prostate | BPH | Circadian rhythm | 15/1718 | 34/8465 | 1.40e-03 | 5.85e-03 | 3.62e-03 | 15 |
| hsa0439024 | Prostate | Tumor | Hippo signaling pathway | 54/1791 | 157/8465 | 7.52e-05 | 5.30e-04 | 3.28e-04 | 54 |
| hsa0471021 | Prostate | Tumor | Circadian rhythm | 14/1791 | 34/8465 | 6.44e-03 | 2.16e-02 | 1.34e-02 | 14 |
| hsa0439034 | Prostate | Tumor | Hippo signaling pathway | 54/1791 | 157/8465 | 7.52e-05 | 5.30e-04 | 3.28e-04 | 54 |
| hsa0471031 | Prostate | Tumor | Circadian rhythm | 14/1791 | 34/8465 | 6.44e-03 | 2.16e-02 | 1.34e-02 | 14 |
| Page: 1 |
Top |
Cell-cell communication analysis |
| Identification of potential cell-cell interactions between two cell types and their ligand-receptor pairs for different disease states |
| Ligand | Receptor | LRpair | Pathway | Tissue | Disease Stage |
| Page: 1 |
Top |
Single-cell gene regulatory network inference analysis |
| Find out the significant the regulons (TFs) and the target genes of each regulon across cell types for different disease states |
| TF | Cell Type | Tissue | Disease Stage | Target Gene | RSS | Regulon Activity |
| ∗The dot plots of a searched regulon are shown for all cell subpopulations in each disease state of each tissue based on the regulon specific score inferred using pySCENIC and by calculating the average expression. |
| Page: 1 |
Top |
Somatic mutation of malignant transformation related genes |
| Annotation of somatic variants for genes involved in malignant transformation |
| Hugo Symbol | Variant Class | Variant Classification | dbSNP RS | HGVSc | HGVSp | HGVSp Short | SWISSPROT | BIOTYPE | SIFT | PolyPhen | Tumor Sample Barcode | Tissue | Histology | Sex | Age | Stage | Therapy Types | Drugs | Outcome |
| CSNK1D | deletion | Frame_Shift_Del | novel | c.697delA | p.Met233CysfsTer20 | p.M233Cfs*20 | P48730 | protein_coding | TCGA-EW-A2FV-01 | Breast | breast invasive carcinoma | Female | <65 | III/IV | Chemotherapy | docetaxel | SD | ||
| CSNK1D | SNV | Missense_Mutation | c.870N>T | p.Trp290Cys | p.W290C | P48730 | protein_coding | deleterious_low_confidence(0) | probably_damaging(0.999) | TCGA-C5-A1BQ-01 | Cervix | cervical & endocervical cancer | Female | >=65 | III/IV | Chemotherapy | cisplatin | CR | |
| CSNK1D | SNV | Missense_Mutation | c.1094G>C | p.Arg365Thr | p.R365T | P48730 | protein_coding | deleterious_low_confidence(0.05) | benign(0.03) | TCGA-JW-A5VL-01 | Cervix | cervical & endocervical cancer | Female | <65 | I/II | Unknown | Unknown | SD | |
| CSNK1D | SNV | Missense_Mutation | novel | c.379N>T | p.Arg127Trp | p.R127W | P48730 | protein_coding | deleterious_low_confidence(0) | probably_damaging(1) | TCGA-VS-A958-01 | Cervix | cervical & endocervical cancer | Female | <65 | I/II | Chemotherapy | cisplatin | CR |
| CSNK1D | SNV | Missense_Mutation | novel | c.1085N>A | p.Gly362Asp | p.G362D | P48730 | protein_coding | tolerated_low_confidence(0.23) | benign(0.192) | TCGA-VS-A9UJ-01 | Cervix | cervical & endocervical cancer | Female | <65 | I/II | Unknown | Unknown | PD |
| CSNK1D | deletion | Frame_Shift_Del | c.1072delN | p.Arg358GlyfsTer12 | p.R358Gfs*12 | P48730 | protein_coding | TCGA-EA-A410-01 | Cervix | cervical & endocervical cancer | Female | <65 | I/II | Unknown | Unknown | SD | |||
| CSNK1D | SNV | Missense_Mutation | c.344G>A | p.Arg115His | p.R115H | P48730 | protein_coding | deleterious_low_confidence(0) | probably_damaging(0.995) | TCGA-A6-5661-01 | Colorectum | colon adenocarcinoma | Female | >=65 | I/II | Unknown | Unknown | SD | |
| CSNK1D | SNV | Missense_Mutation | c.293G>T | p.Arg98Met | p.R98M | P48730 | protein_coding | deleterious_low_confidence(0) | probably_damaging(0.994) | TCGA-AA-3821-01 | Colorectum | colon adenocarcinoma | Female | >=65 | I/II | Unknown | Unknown | SD | |
| CSNK1D | SNV | Missense_Mutation | c.479N>C | p.Arg160Pro | p.R160P | P48730 | protein_coding | deleterious_low_confidence(0) | probably_damaging(0.941) | TCGA-AA-3864-01 | Colorectum | colon adenocarcinoma | Male | >=65 | I/II | Unknown | Unknown | SD | |
| CSNK1D | SNV | Missense_Mutation | rs765104663 | c.712N>A | p.Glu238Lys | p.E238K | P48730 | protein_coding | deleterious_low_confidence(0) | possibly_damaging(0.647) | TCGA-AZ-4315-01 | Colorectum | colon adenocarcinoma | Male | <65 | I/II | Unknown | Unknown | SD |
| Page: 1 2 3 4 5 |
Top |
Related drugs of malignant transformation related genes |
| Identification of chemicals and drugs interact with genes involved in malignant transfromation |
| (DGIdb 4.0) |
| Entrez ID | Symbol | Category | Interaction Types | Drug Claim Name | Drug Name | PMIDs |
| 1453 | CSNK1D | DRUGGABLE GENOME, KINASE, SERINE THREONINE KINASE, ENZYME | SB-203580 | SB-203580 | ||
| 1453 | CSNK1D | DRUGGABLE GENOME, KINASE, SERINE THREONINE KINASE, ENZYME | TAK-715 | TAK-715 | ||
| 1453 | CSNK1D | DRUGGABLE GENOME, KINASE, SERINE THREONINE KINASE, ENZYME | GEFITINIB | GEFITINIB | ||
| 1453 | CSNK1D | DRUGGABLE GENOME, KINASE, SERINE THREONINE KINASE, ENZYME | ALSTERPAULLONE | ALSTERPAULLONE | ||
| 1453 | CSNK1D | DRUGGABLE GENOME, KINASE, SERINE THREONINE KINASE, ENZYME | inhibitor | 178102608 | IC261 | |
| 1453 | CSNK1D | DRUGGABLE GENOME, KINASE, SERINE THREONINE KINASE, ENZYME | (RS)-ROSCOVITINE | (RS)-ROSCOVITINE | ||
| 1453 | CSNK1D | DRUGGABLE GENOME, KINASE, SERINE THREONINE KINASE, ENZYME | BMS-345541 | BMS-345541 | ||
| 1453 | CSNK1D | DRUGGABLE GENOME, KINASE, SERINE THREONINE KINASE, ENZYME | CYC-116 | CYC-116 | ||
| 1453 | CSNK1D | DRUGGABLE GENOME, KINASE, SERINE THREONINE KINASE, ENZYME | DOVITINIB | DOVITINIB | ||
| 1453 | CSNK1D | DRUGGABLE GENOME, KINASE, SERINE THREONINE KINASE, ENZYME | CENISERTIB | CENISERTIB |
| Page: 1 2 3 |

Copyright 2023-Present -The University of Texas Health Science Center at Houston |