Schematic overview of the cellular and molecular mechanisms involved in the cancer progression, including the proposed cellular and molecular mechanisms in cancer cells trajectory. AT1: alveolar type 1 cells; AT2: alveolar type 2 cells; AAH: atypical adenomatous hyperplasia; AIS: adenocarcinoma in situ; MIA: minimally invasive adenocarcinoma; IA: invasive adenocarcinoma; EMT: epithelial-mesenchymal transition

Home

Download

Statistics

Help

Contact

Center for Computational Systems Medicine
leaf

Gene summary

leaf

Malignant transformation analysis

leaf

Malignant transformation related pathway analysis

leaf

Cell-cell communication analysis

leaf

Single-cell gene regulatory network inference analysis

leaf

Somatic mutation of malignant transformation related genes

leaf

Related drugs of malignant transformation related genes

Gene: CSNK1A1

Gene summary for CSNK1A1

check button Gene summary.

Gene informationSpeciesHuman
Gene symbol

CSNK1A1

Gene ID

1452

Gene namecasein kinase 1 alpha 1
Gene AliasCK1
Cytomap5q32
Gene Typeprotein-coding
GO ID

GO:0006464

UniProtAcc

P48729


Top

Malignant transformation analysis

check button Identification of the aberrant gene expression in precancerous and cancerous lesions by comparing the gene expression of stem-like cells in diseased tissues with normal stem cells
check button Malignant transformation involving gene list.
Entrez IDSymbolReplicatesSpeciesOrganTissueAdj P-valueLog2FCMalignancy
1452CSNK1A1GSM4909286HumanBreastIDC3.97e-14-5.53e-010.1081
1452CSNK1A1GSM4909288HumanBreastIDC6.30e-04-2.45e-010.0988
1452CSNK1A1GSM4909293HumanBreastIDC7.40e-124.31e-010.1581
1452CSNK1A1GSM4909294HumanBreastIDC9.44e-05-1.24e-010.2022
1452CSNK1A1GSM4909296HumanBreastIDC1.12e-13-3.17e-010.1524
1452CSNK1A1GSM4909297HumanBreastIDC1.95e-26-3.80e-020.1517
1452CSNK1A1GSM4909298HumanBreastIDC3.44e-053.03e-010.1551
1452CSNK1A1GSM4909303HumanBreastIDC3.45e-033.43e-010.0438
1452CSNK1A1GSM4909309HumanBreastIDC6.50e-04-2.01e-010.0483
1452CSNK1A1GSM4909311HumanBreastIDC3.83e-47-6.05e-010.1534
1452CSNK1A1GSM4909312HumanBreastIDC1.44e-14-5.05e-020.1552
1452CSNK1A1GSM4909313HumanBreastIDC3.84e-041.42e-010.0391
1452CSNK1A1GSM4909316HumanBreastIDC1.18e-04-2.00e-010.21
1452CSNK1A1GSM4909319HumanBreastIDC4.20e-54-5.98e-010.1563
1452CSNK1A1GSM4909320HumanBreastIDC1.55e-09-4.96e-010.1575
1452CSNK1A1GSM4909321HumanBreastIDC2.13e-22-2.64e-010.1559
1452CSNK1A1brca10HumanBreastPrecancer1.39e-06-3.91e-01-0.0029
1452CSNK1A1NCCBC11HumanBreastDCIS5.24e-051.65e-010.1232
1452CSNK1A1NCCBC14HumanBreastDCIS2.82e-19-1.22e-010.2021
1452CSNK1A1NCCBC2HumanBreastDCIS1.38e-03-1.89e-030.1554
Page: 1 2 3 4 5 6 7 8 9 10 11 12 13 14 15 16 17 

check button Transcriptomic changes along malignancy continuum.
TissueExpression DynamicsAbbreviation
BreastThe image shows the transcriptomic changes along malignancy continuum.log2FC in expression of this searched gene in stem-like cells from each diseased tissue sample relative to stem-like cells in normal samples in each tissue plotted against the malignancy continuum. Samples are colored based on if they are from different disease stage.IDC: Invasive ductal carcinoma
DCIS: Ductal carcinoma in situ
Precancer(BRCA1-mut): Precancerous lesion from BRCA1 mutation carriers
Colorectum (GSE201348)The image shows the transcriptomic changes along malignancy continuum.log2FC in expression of this searched gene in stem-like cells from each diseased tissue sample relative to stem-like cells in normal samples in each tissue plotted against the malignancy continuum. Samples are colored based on if they are from different disease stage.
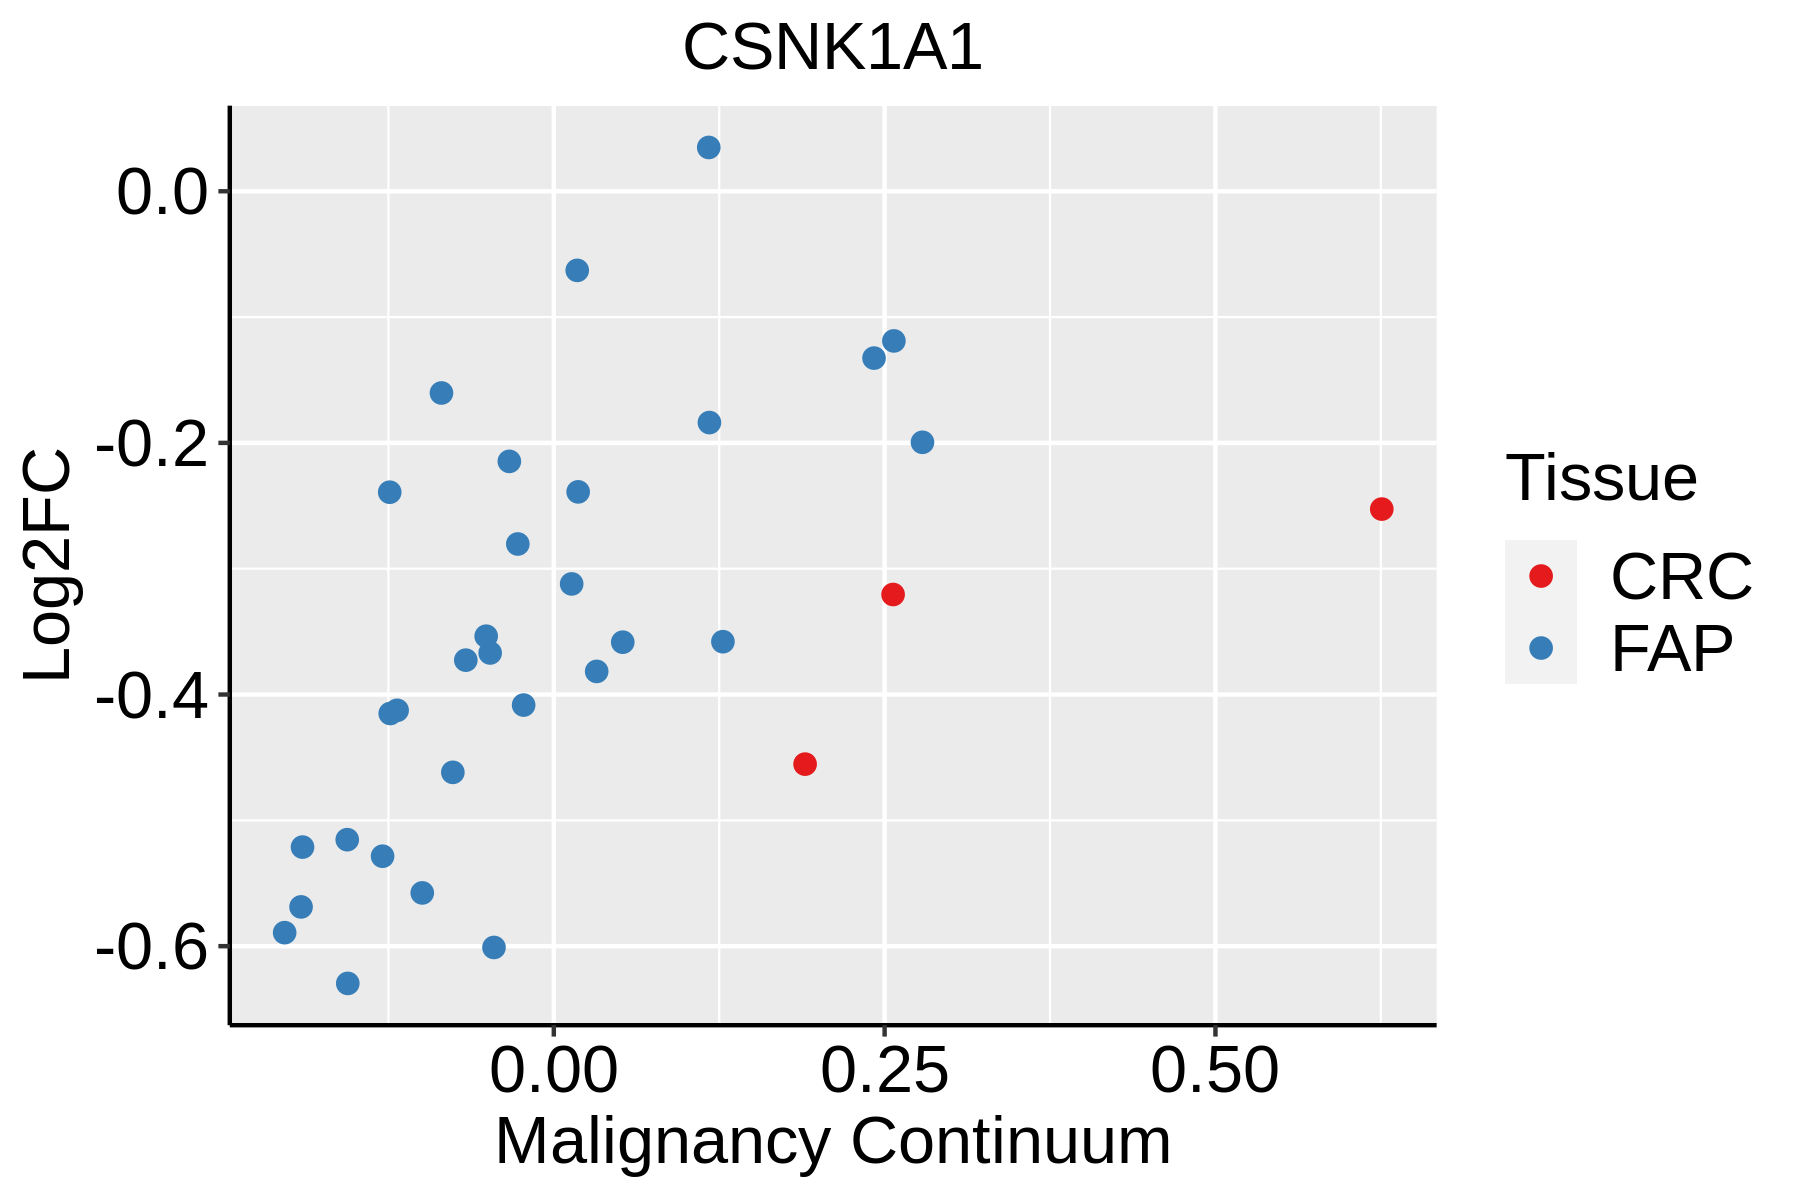
FAP: Familial adenomatous polyposis
CRC: Colorectal cancer
Colorectum (HTA11)The image shows the transcriptomic changes along malignancy continuum.log2FC in expression of this searched gene in stem-like cells from each diseased tissue sample relative to stem-like cells in normal samples in each tissue plotted against the malignancy continuum. Samples are colored based on if they are from different disease stage.AD: Adenomas
SER: Sessile serrated lesions
MSI-H: Microsatellite-high colorectal cancer
MSS: Microsatellite stable colorectal cancer
EndometriumThe image shows the transcriptomic changes along malignancy continuum.log2FC in expression of this searched gene in stem-like cells from each diseased tissue sample relative to stem-like cells in normal samples in each tissue plotted against the malignancy continuum. Samples are colored based on if they are from different disease stage.
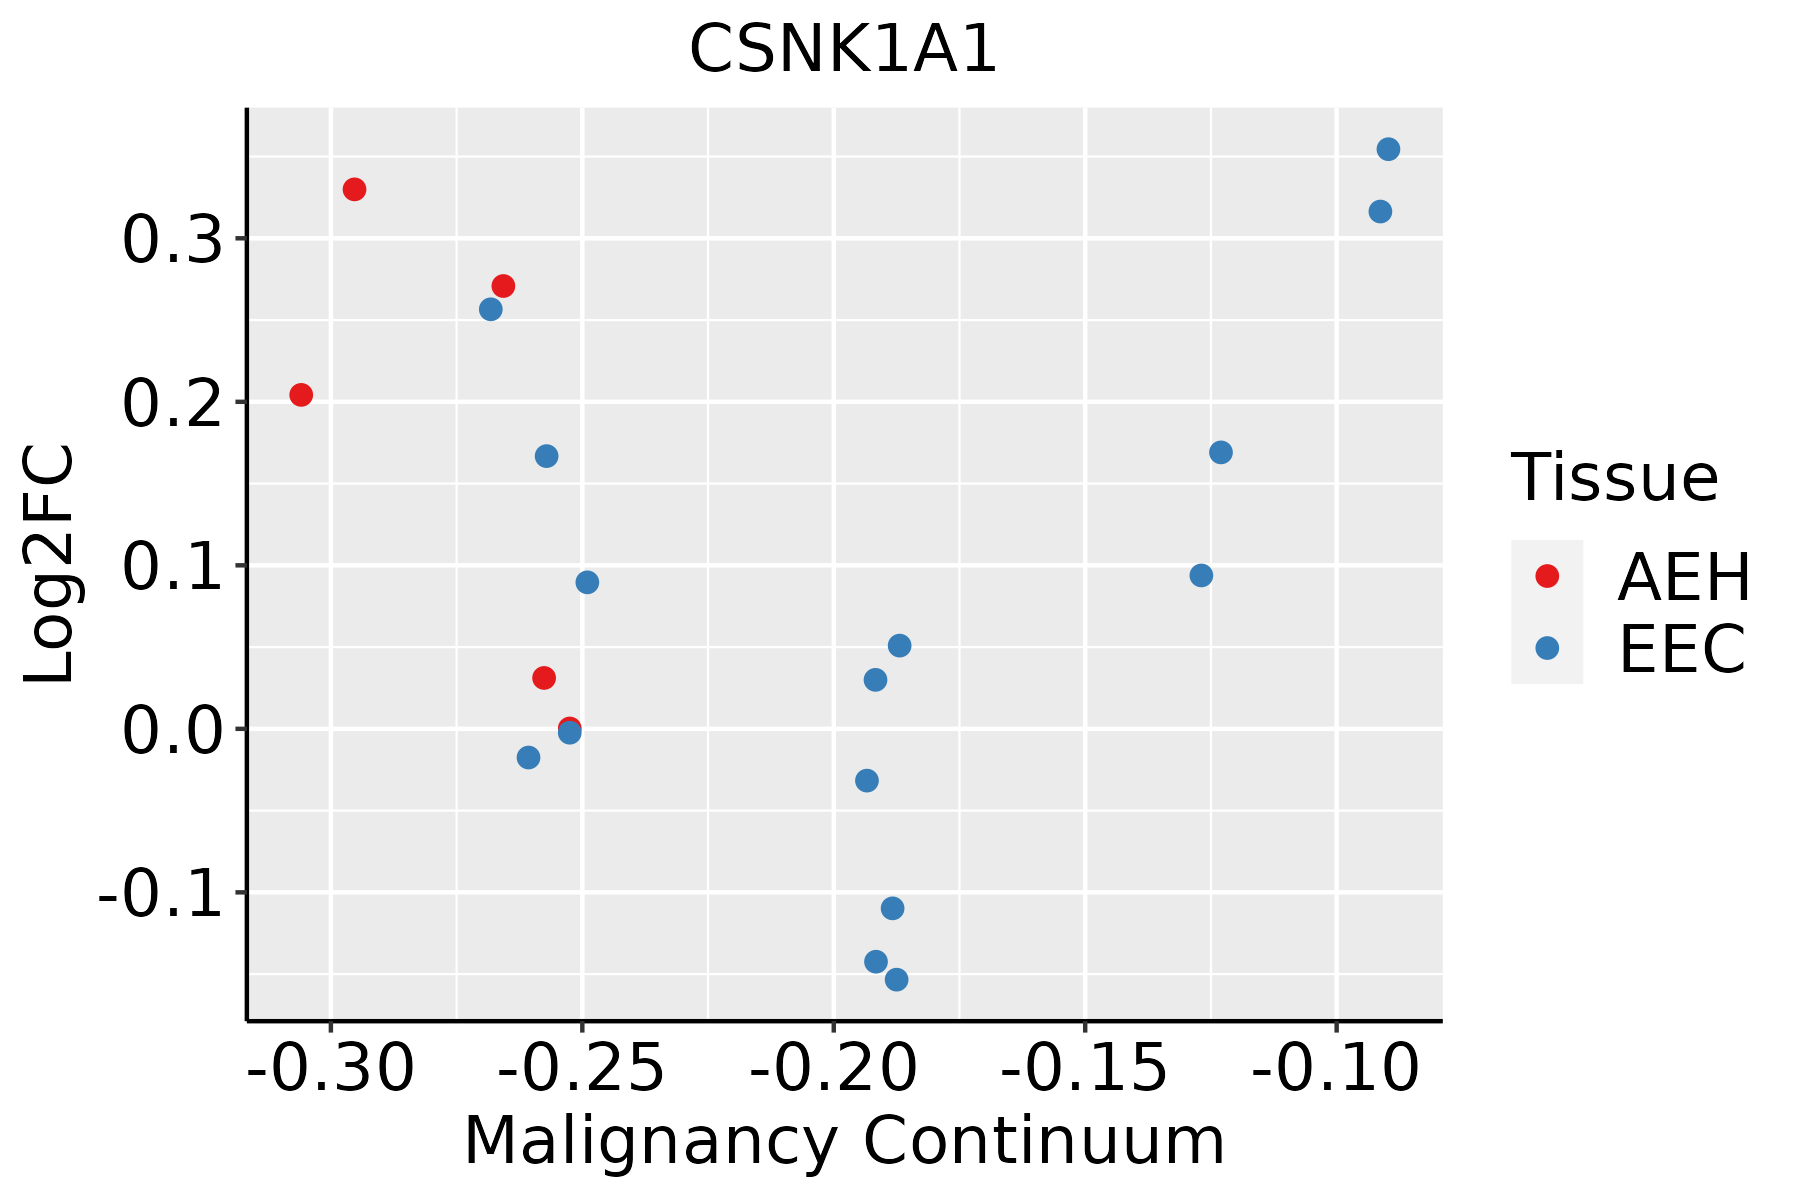
AEH: Atypical endometrial hyperplasia
EEC: Endometrioid Cancer
EsophagusThe image shows the transcriptomic changes along malignancy continuum.log2FC in expression of this searched gene in stem-like cells from each diseased tissue sample relative to stem-like cells in normal samples in each tissue plotted against the malignancy continuum. Samples are colored based on if they are from different disease stage.
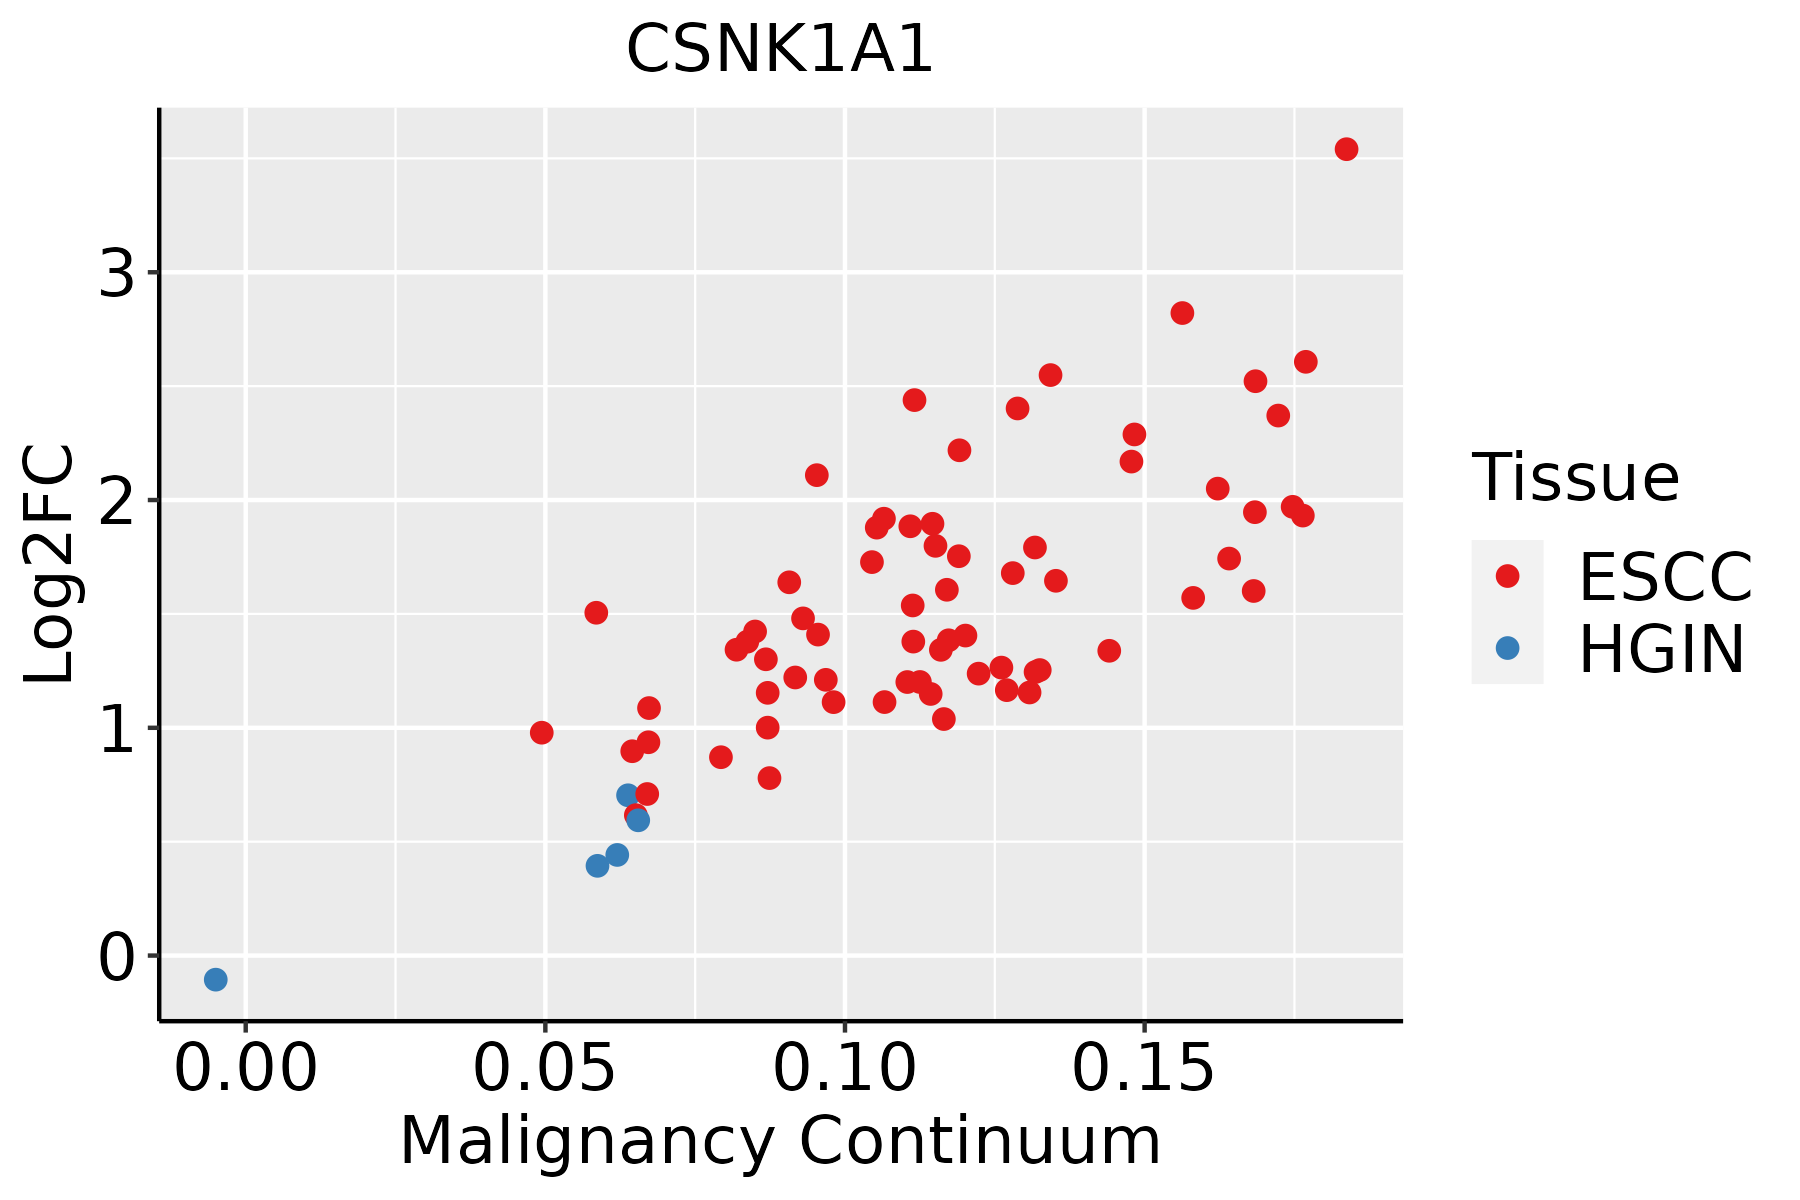
ESCC: Esophageal squamous cell carcinoma
HGIN: High-grade intraepithelial neoplasias
LGIN: Low-grade intraepithelial neoplasias
GCThe image shows the transcriptomic changes along malignancy continuum.log2FC in expression of this searched gene in stem-like cells from each diseased tissue sample relative to stem-like cells in normal samples in each tissue plotted against the malignancy continuum. Samples are colored based on if they are from different disease stage.
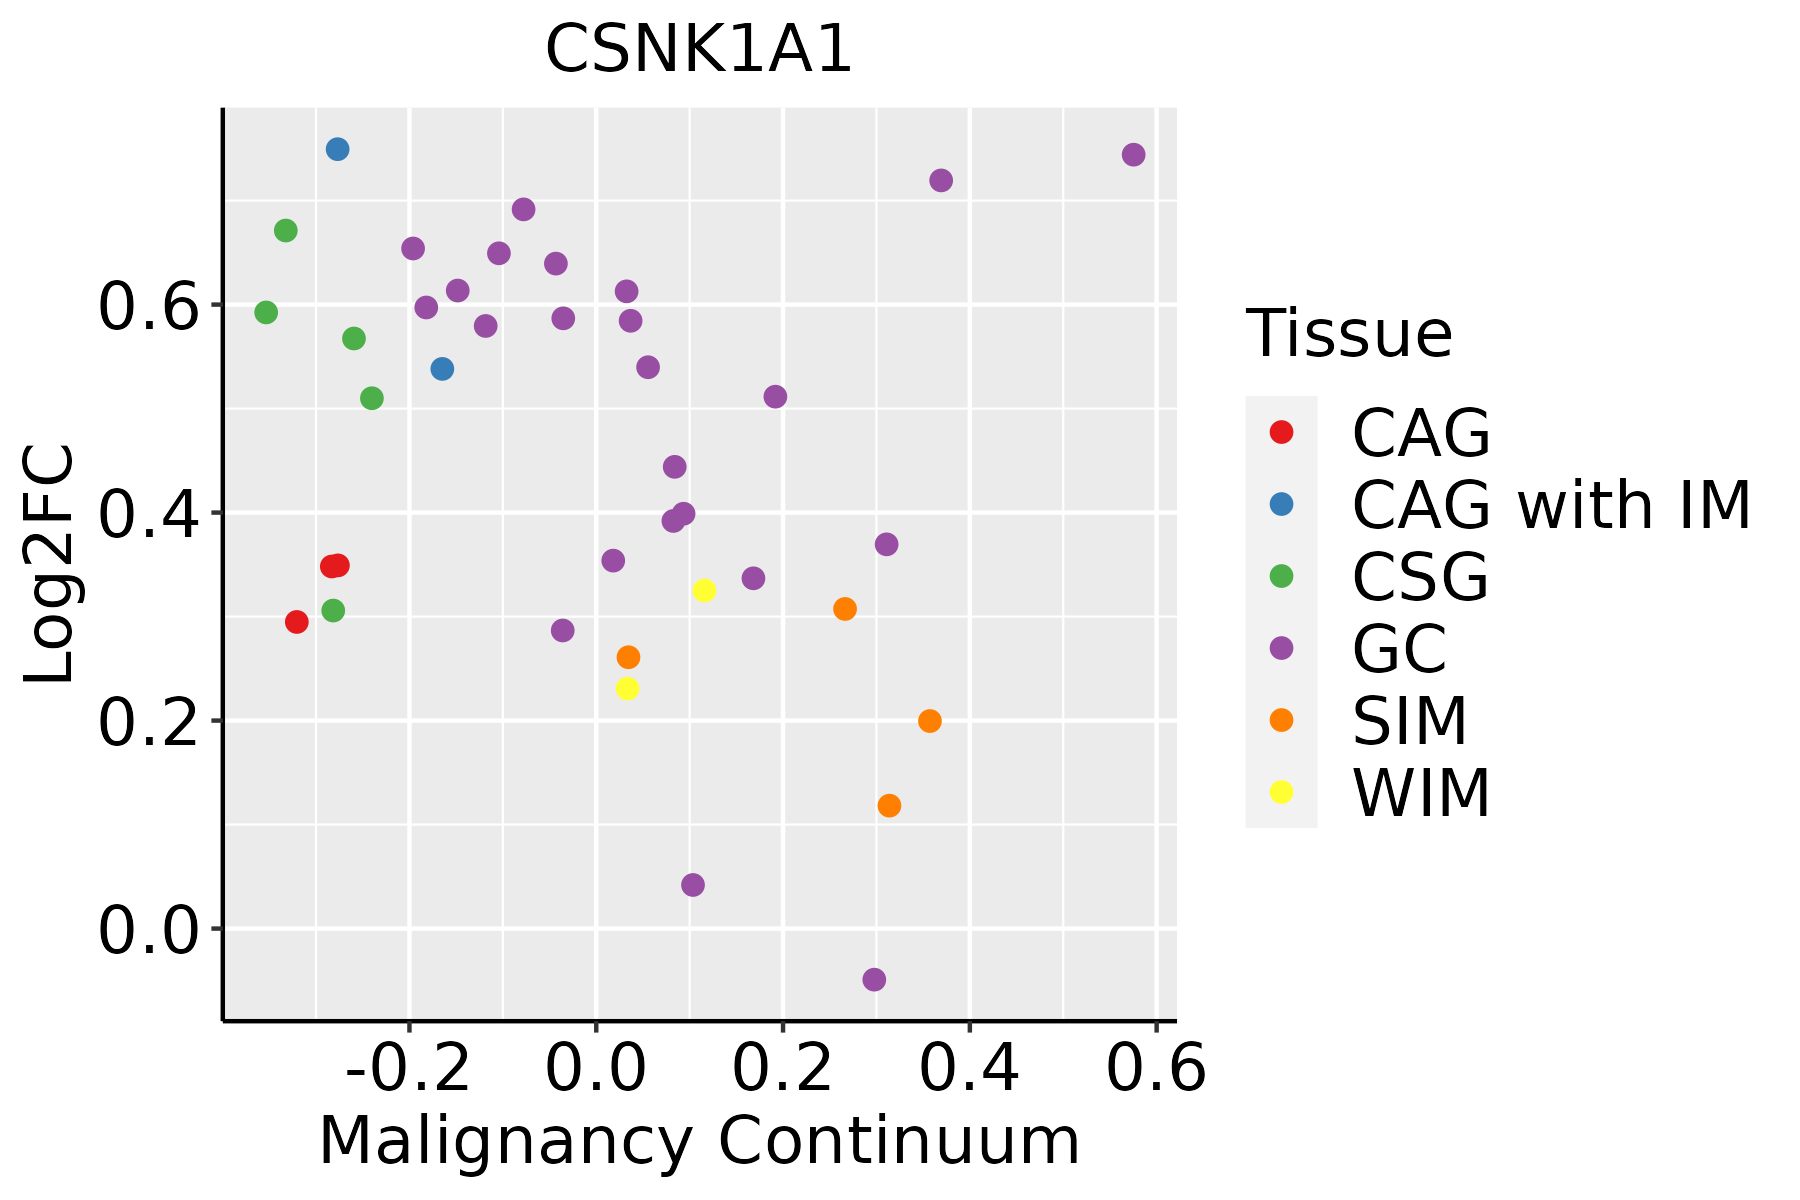
CAG: Chronic atrophic gastritis
CAG with IM: Chronic atrophic gastritis with intestinal metaplasia
CSG: Chronic superficial gastritis
GC: Gastric cancer
SIM: Severe intestinal metaplasia
WIM: Wild intestinal metaplasia
LiverThe image shows the transcriptomic changes along malignancy continuum.log2FC in expression of this searched gene in stem-like cells from each diseased tissue sample relative to stem-like cells in normal samples in each tissue plotted against the malignancy continuum. Samples are colored based on if they are from different disease stage.HCC: Hepatocellular carcinoma
NAFLD: Non-alcoholic fatty liver disease
LungThe image shows the transcriptomic changes along malignancy continuum.log2FC in expression of this searched gene in stem-like cells from each diseased tissue sample relative to stem-like cells in normal samples in each tissue plotted against the malignancy continuum. Samples are colored based on if they are from different disease stage.
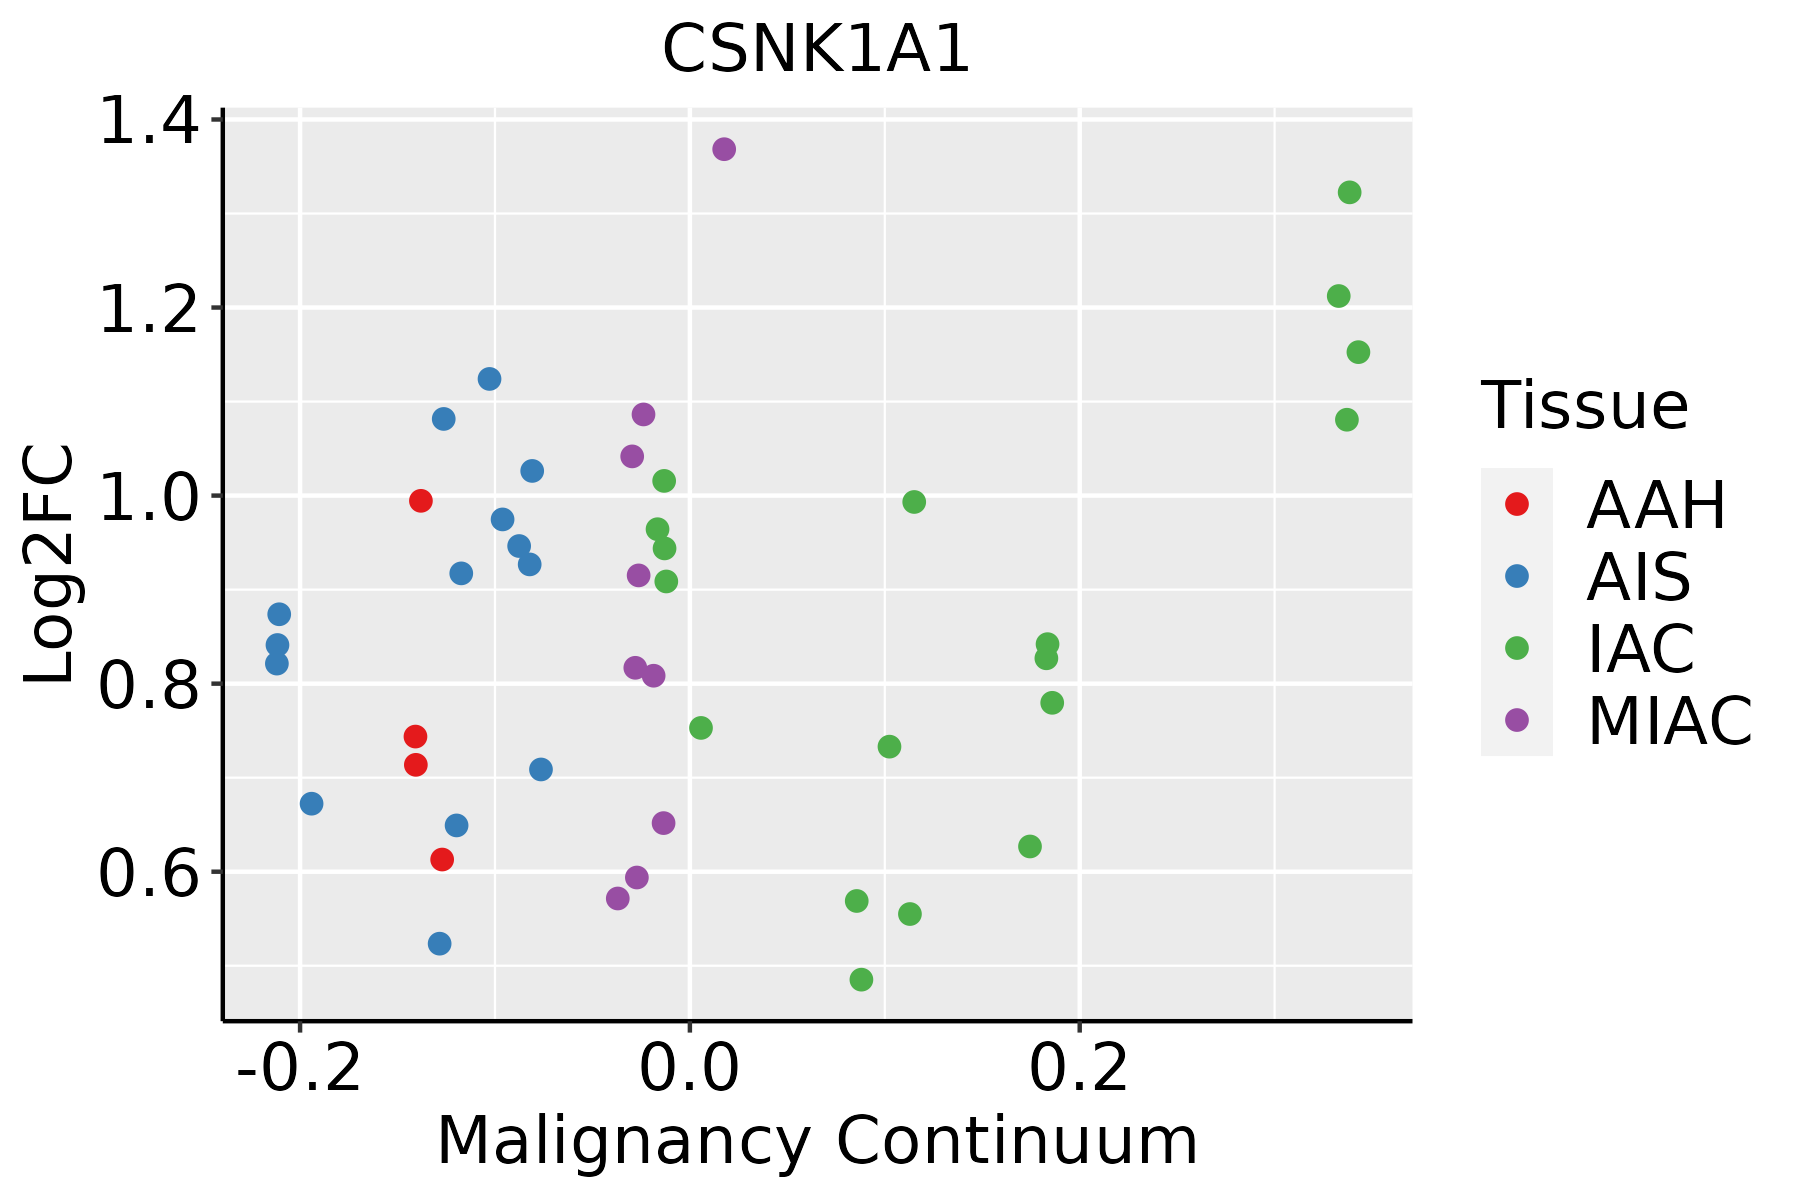
AAH: Atypical adenomatous hyperplasia
AIS: Adenocarcinoma in situ
IAC: Invasive lung adenocarcinoma
MIA: Minimally invasive adenocarcinoma
Oral CavityThe image shows the transcriptomic changes along malignancy continuum.log2FC in expression of this searched gene in stem-like cells from each diseased tissue sample relative to stem-like cells in normal samples in each tissue plotted against the malignancy continuum. Samples are colored based on if they are from different disease stage.
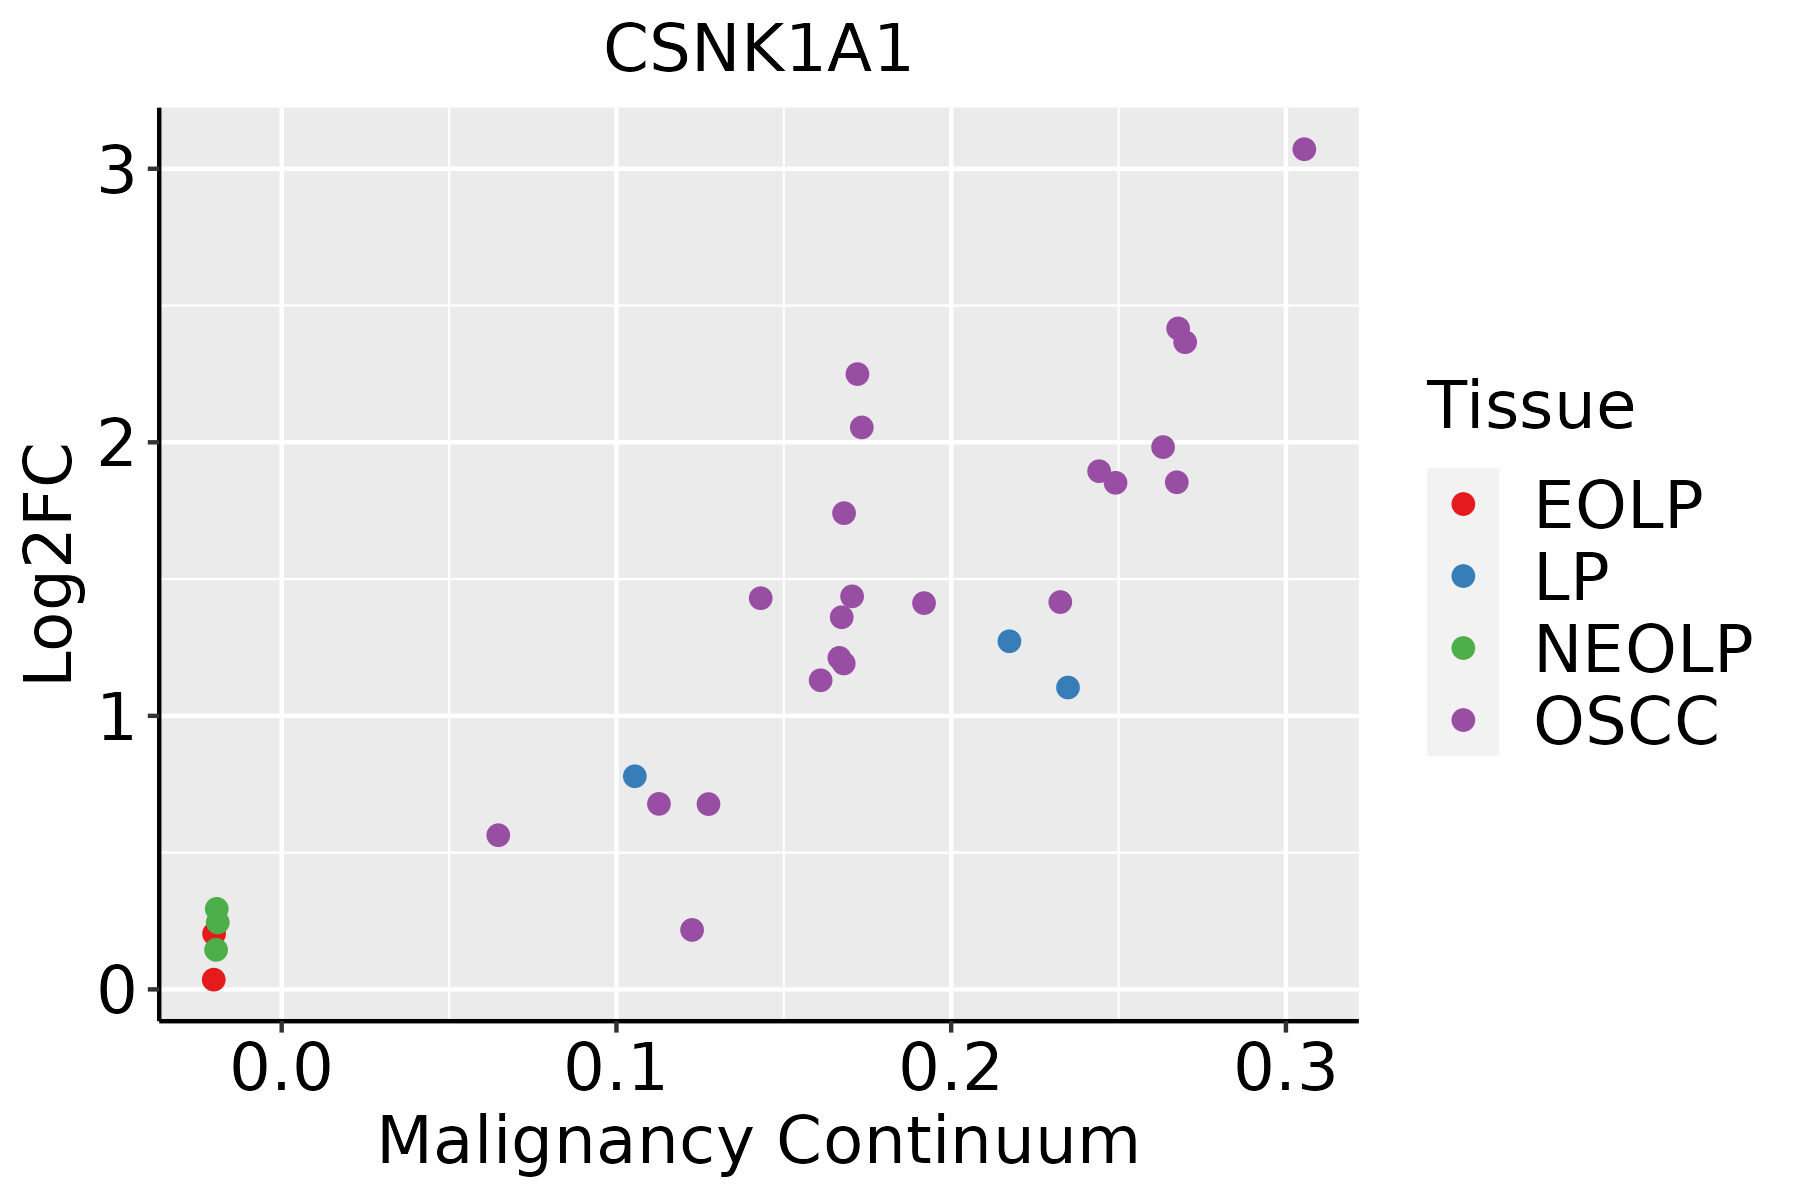
EOLP: Erosive Oral lichen planus
LP: leukoplakia
NEOLP: Non-erosive oral lichen planus
OSCC: Oral squamous cell carcinoma
ProstateThe image shows the transcriptomic changes along malignancy continuum.log2FC in expression of this searched gene in stem-like cells from each diseased tissue sample relative to stem-like cells in normal samples in each tissue plotted against the malignancy continuum. Samples are colored based on if they are from different disease stage.
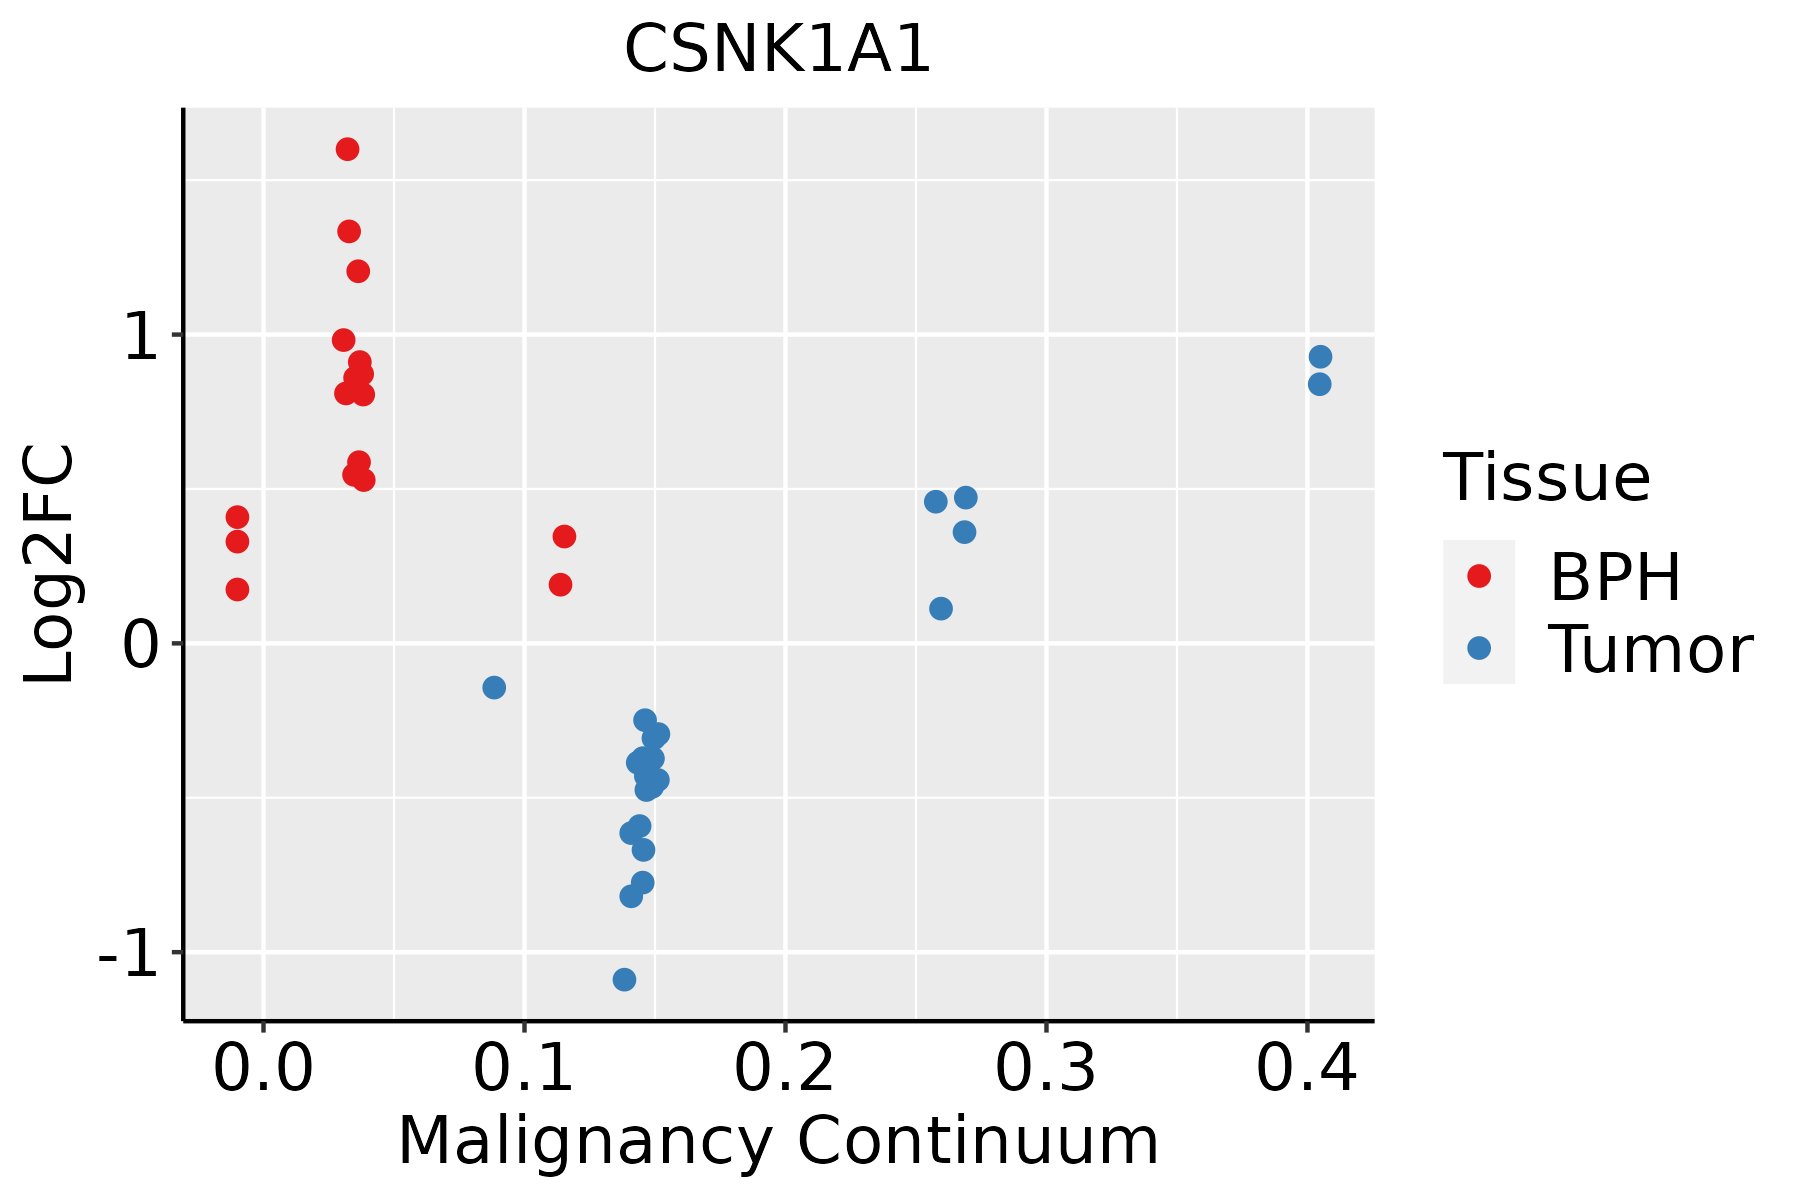
BPH: Benign Prostatic Hyperplasia
SkinThe image shows the transcriptomic changes along malignancy continuum.log2FC in expression of this searched gene in stem-like cells from each diseased tissue sample relative to stem-like cells in normal samples in each tissue plotted against the malignancy continuum. Samples are colored based on if they are from different disease stage.
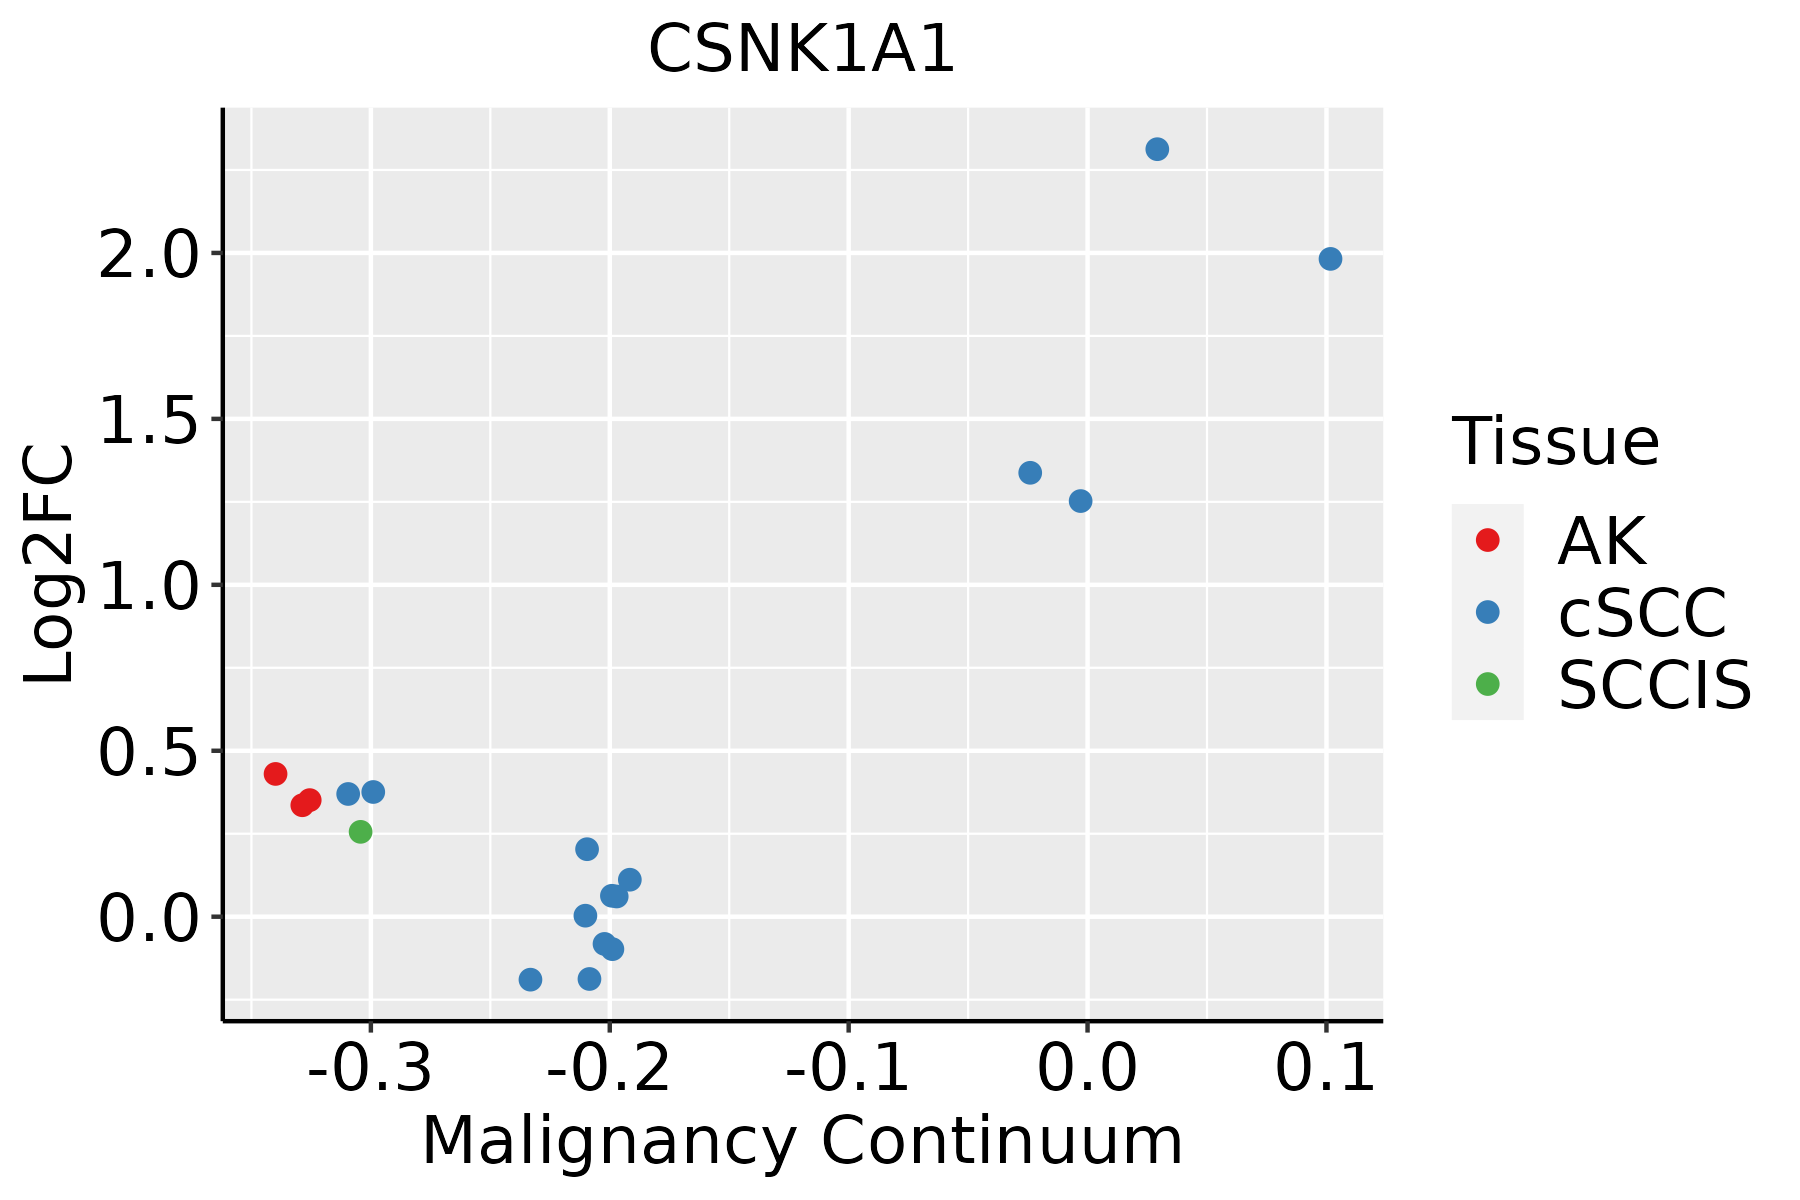
AK: Actinic keratosis
cSCC: Cutaneous squamous cell carcinoma
SCCIS:squamous cell carcinoma in situ
ThyroidThe image shows the transcriptomic changes along malignancy continuum.log2FC in expression of this searched gene in stem-like cells from each diseased tissue sample relative to stem-like cells in normal samples in each tissue plotted against the malignancy continuum. Samples are colored based on if they are from different disease stage.
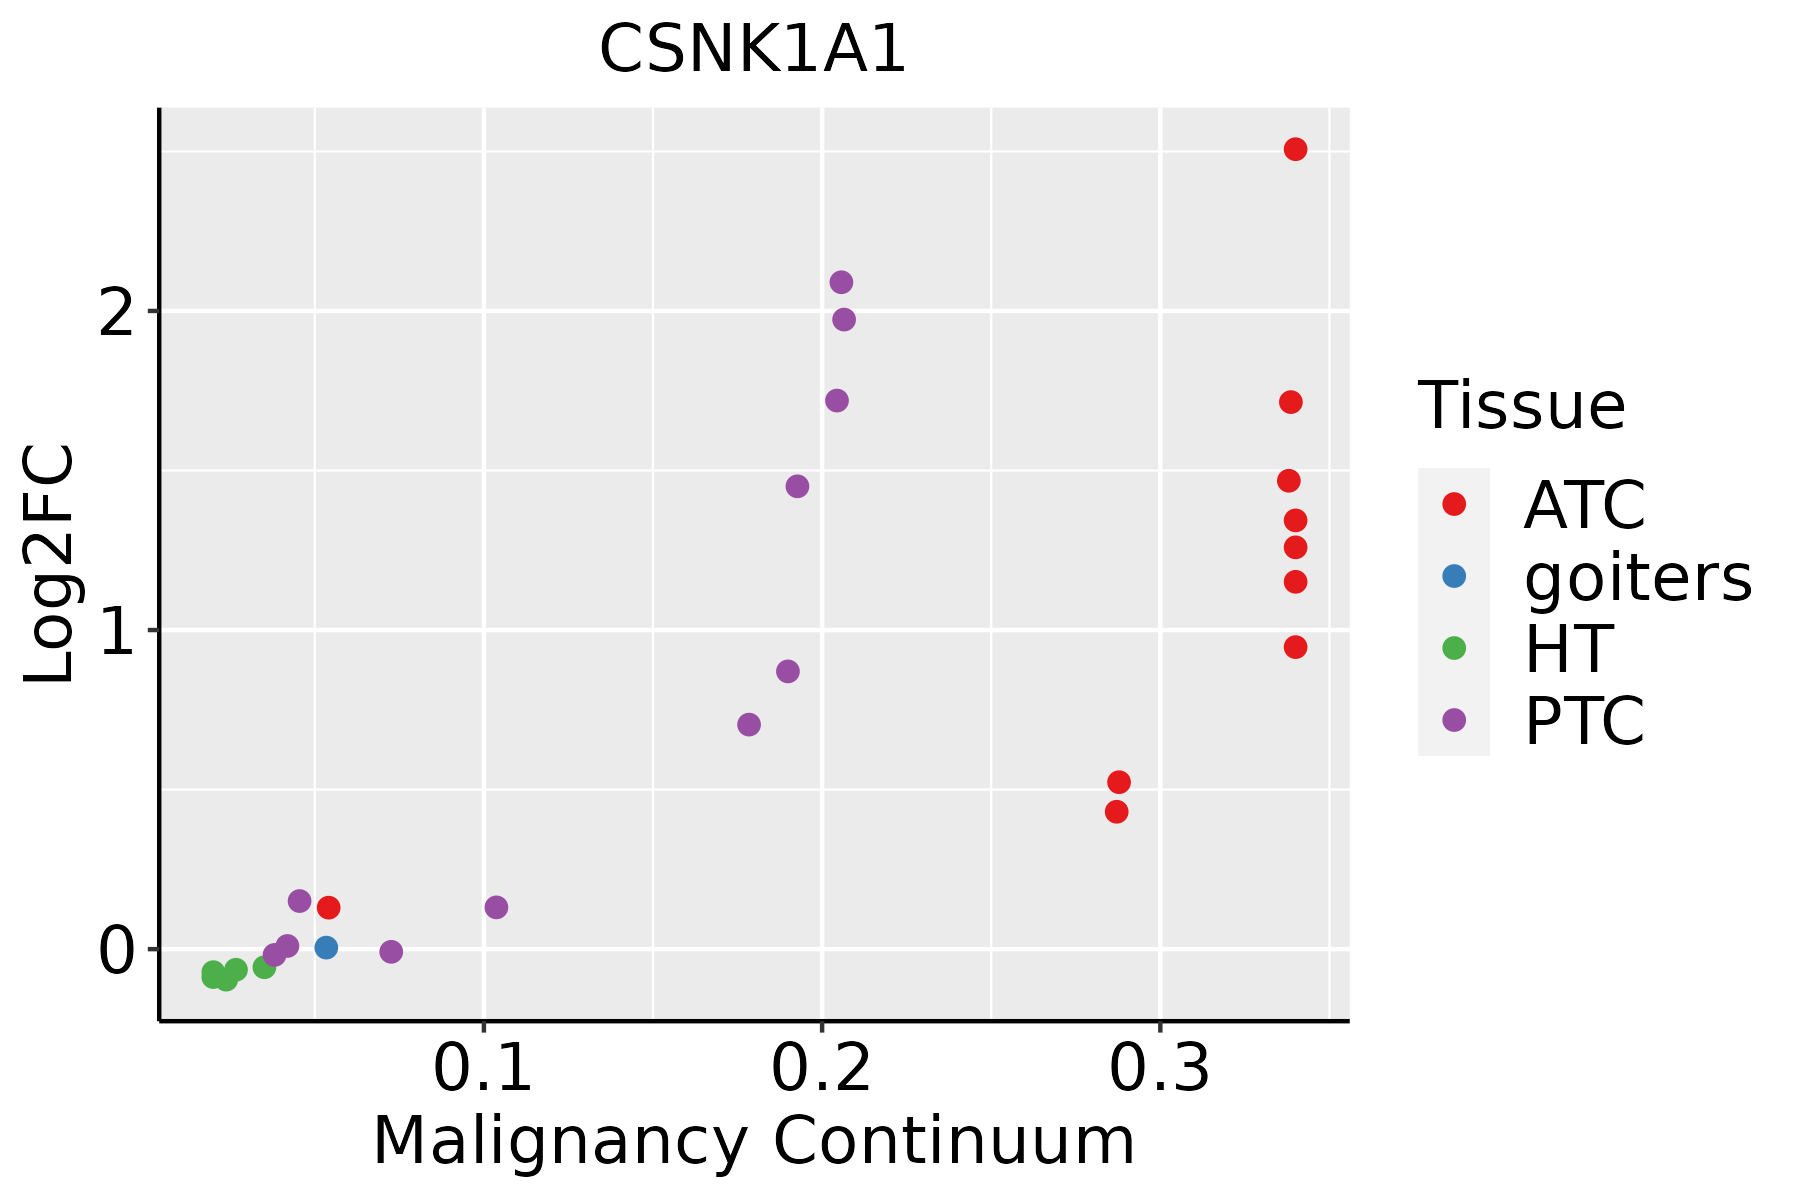
ATC: Anaplastic thyroid cancer
HT: Hashimoto's thyroiditis
PTC: Papillary thyroid cancer
∗log2FC in expression of this searched gene in stem-like cells from each diseased tissue sample relative to stem-like cells in normal samples in each tissue plotted against the malignancy continuum. Samples are colored based on if they are from different disease stage.

Top

Malignant transformation related pathway analysis

check buttonFind out the enriched GO biological processes and KEGG pathways involved in transition from healthy to precancer to cancer
check button Figure of enriched GO biological processes.
TissueDisease StageEnriched GO biological Processes
ColorectumADGO analysis - Figure of enriched GO biological processes: Top 15 enriched GO BP terms are showed in the bar plot of each disease state in each tissue. Each row represents a significant GO biological process which is colored according to the -log10(p.adjust).
ColorectumSERGO analysis - Figure of enriched GO biological processes: Top 15 enriched GO BP terms are showed in the bar plot of each disease state in each tissue. Each row represents a significant GO biological process which is colored according to the -log10(p.adjust).
ColorectumMSSGO analysis - Figure of enriched GO biological processes: Top 15 enriched GO BP terms are showed in the bar plot of each disease state in each tissue. Each row represents a significant GO biological process which is colored according to the -log10(p.adjust).
ColorectumMSI-HGO analysis - Figure of enriched GO biological processes: Top 15 enriched GO BP terms are showed in the bar plot of each disease state in each tissue. Each row represents a significant GO biological process which is colored according to the -log10(p.adjust).
ColorectumFAPGO analysis - Figure of enriched GO biological processes: Top 15 enriched GO BP terms are showed in the bar plot of each disease state in each tissue. Each row represents a significant GO biological process which is colored according to the -log10(p.adjust).
∗Top 15 enriched GO BP terms are showed in the bar plot of each disease state in each tissue. Each row represents a significant GO biological process which is colored according to the -log10(p.adjust).
Page: 1 2 3 4 5 6 7 8 9 

check button Enriched GO biological processes.
GO IDTissueDisease StageDescriptionGene RatioBg Ratiopvaluep.adjustCount
GO:00458629BreastPrecancerpositive regulation of proteolysis51/1080372/187237.77e-095.70e-0751
GO:00104989BreastPrecancerproteasomal protein catabolic process58/1080490/187231.54e-078.05e-0658
GO:19033629BreastPrecancerregulation of cellular protein catabolic process36/1080255/187236.03e-072.55e-0536
GO:00421769BreastPrecancerregulation of protein catabolic process47/1080391/187231.50e-065.58e-0547
GO:00510989BreastPrecancerregulation of binding44/1080363/187232.59e-068.65e-0544
GO:19030509BreastPrecancerregulation of proteolysis involved in cellular protein catabolic process31/1080221/187234.10e-061.27e-0431
GO:0045104BreastPrecancerintermediate filament cytoskeleton organization11/108051/187231.26e-042.22e-0311
GO:0045103BreastPrecancerintermediate filament-based process11/108052/187231.52e-042.60e-0311
GO:00611369BreastPrecancerregulation of proteasomal protein catabolic process24/1080187/187231.99e-043.14e-0324
GO:00431619BreastPrecancerproteasome-mediated ubiquitin-dependent protein catabolic process42/1080412/187232.49e-043.72e-0342
GO:00098969BreastPrecancerpositive regulation of catabolic process48/1080492/187232.62e-043.84e-0348
GO:00313319BreastPrecancerpositive regulation of cellular catabolic process43/1080427/187232.75e-044.00e-0343
GO:20000589BreastPrecancerregulation of ubiquitin-dependent protein catabolic process21/1080164/187235.00e-046.53e-0321
GO:19033649BreastPrecancerpositive regulation of cellular protein catabolic process20/1080155/187236.10e-047.67e-0320
GO:19030527BreastPrecancerpositive regulation of proteolysis involved in cellular protein catabolic process17/1080133/187231.68e-031.70e-0217
GO:00457329BreastPrecancerpositive regulation of protein catabolic process25/1080231/187231.87e-031.82e-0225
GO:19018007BreastPrecancerpositive regulation of proteasomal protein catabolic process15/1080114/187232.31e-032.15e-0215
GO:00324349BreastPrecancerregulation of proteasomal ubiquitin-dependent protein catabolic process16/1080134/187234.51e-033.50e-0216
GO:004586214BreastIDCpositive regulation of proteolysis66/1434372/187239.76e-111.29e-0866
GO:001049814BreastIDCproteasomal protein catabolic process75/1434490/187235.59e-094.41e-0775
Page: 1 2 3 4 5 6 7 8 9 10 11 12 13 14 15 16 17 18 19 20 21 22 23 24 25 26 27 28 29 30 31 32 33 34 35 36 37 38 39 40 41 

check button Enriched KEGG pathways.
Pathway IDTissueDisease StageDescriptionGene RatioBg Ratiopvaluep.adjustqvalueCount
hsa0501016BreastPrecancerAlzheimer disease103/684384/84651.03e-294.66e-283.57e-28103
hsa0501017BreastPrecancerAlzheimer disease103/684384/84651.03e-294.66e-283.57e-28103
hsa0501023BreastIDCAlzheimer disease107/867384/84651.70e-237.88e-225.90e-22107
hsa0502223BreastIDCPathways of neurodegeneration - multiple diseases116/867476/84653.63e-201.18e-188.82e-19116
hsa0501033BreastIDCAlzheimer disease107/867384/84651.70e-237.88e-225.90e-22107
hsa0502233BreastIDCPathways of neurodegeneration - multiple diseases116/867476/84653.63e-201.18e-188.82e-19116
hsa0501043BreastDCISAlzheimer disease105/846384/84653.23e-231.49e-211.10e-21105
hsa0502243BreastDCISPathways of neurodegeneration - multiple diseases114/846476/84654.74e-201.53e-181.13e-18114
hsa0501053BreastDCISAlzheimer disease105/846384/84653.23e-231.49e-211.10e-21105
hsa0502253BreastDCISPathways of neurodegeneration - multiple diseases114/846476/84654.74e-201.53e-181.13e-18114
hsa05010ColorectumADAlzheimer disease174/2092384/84651.82e-199.26e-185.91e-18174
hsa05022ColorectumADPathways of neurodegeneration - multiple diseases201/2092476/84654.54e-181.27e-168.09e-17201
hsa05225ColorectumADHepatocellular carcinoma59/2092168/84651.50e-038.69e-035.54e-0359
hsa04310ColorectumADWnt signaling pathway56/2092171/84651.03e-023.93e-022.51e-0256
hsa050101ColorectumADAlzheimer disease174/2092384/84651.82e-199.26e-185.91e-18174
hsa050221ColorectumADPathways of neurodegeneration - multiple diseases201/2092476/84654.54e-181.27e-168.09e-17201
hsa052251ColorectumADHepatocellular carcinoma59/2092168/84651.50e-038.69e-035.54e-0359
hsa043101ColorectumADWnt signaling pathway56/2092171/84651.03e-023.93e-022.51e-0256
hsa050102ColorectumSERAlzheimer disease146/1580384/84656.52e-202.40e-181.75e-18146
hsa050222ColorectumSERPathways of neurodegeneration - multiple diseases168/1580476/84656.23e-192.07e-171.50e-17168
Page: 1 2 3 4 5 6 7 8 9 

Top

Cell-cell communication analysis

check buttonIdentification of potential cell-cell interactions between two cell types and their ligand-receptor pairs for different disease states
LigandReceptorLRpairPathwayTissueDisease Stage
Page: 1 

Top

Single-cell gene regulatory network inference analysis

check buttonFind out the significant the regulons (TFs) and the target genes of each regulon across cell types for different disease states
TFCell TypeTissueDisease StageTarget GeneRSSRegulon Activity
∗The dot plots of a searched regulon are shown for all cell subpopulations in each disease state of each tissue based on the regulon specific score inferred using pySCENIC and by calculating the average expression.
Page: 1 

Top

Somatic mutation of malignant transformation related genes

check buttonAnnotation of somatic variants for genes involved in malignant transformation
Hugo SymbolVariant ClassVariant ClassificationdbSNP RSHGVScHGVSpHGVSp ShortSWISSPROTBIOTYPESIFTPolyPhenTumor Sample BarcodeTissueHistologySexAgeStageTherapy TypesDrugsOutcome
CSNK1A1SNVMissense_Mutationc.178N>Ap.Glu60Lysp.E60KP48729protein_codingdeleterious_low_confidence(0.02)probably_damaging(0.956)TCGA-AC-A23H-01Breastbreast invasive carcinomaFemale>=65I/IIUnknownUnknownPD
CSNK1A1insertionNonsense_Mutationnovelc.33_34insCTTGTTAAACACGTCCCATAAATGTCCCTTAGTCGAGp.Ile12LeufsTer7p.I12Lfs*7P48729protein_codingTCGA-A8-A06U-01Breastbreast invasive carcinomaFemale>=65I/IIUnknownUnknownSD
CSNK1A1insertionIn_Frame_Insnovelc.576_577insCCAp.Tyr192_Arg193insProp.Y192_R193insPP48729protein_codingTCGA-AO-A128-01Breastbreast invasive carcinomaFemale<65I/IIChemotherapydoxorubicinSD
CSNK1A1deletionFrame_Shift_Delnovelc.166delNp.Gln56SerfsTer33p.Q56Sfs*33P48729protein_codingTCGA-EW-A2FV-01Breastbreast invasive carcinomaFemale<65III/IVChemotherapydocetaxelSD
CSNK1A1SNVMissense_Mutationc.62G>Tp.Arg21Leup.R21LP48729protein_codingdeleterious_low_confidence(0)probably_damaging(0.91)TCGA-AA-3713-01Colorectumcolon adenocarcinomaMale>=65III/IVChemotherapy5-fluorouracilPR
CSNK1A1SNVMissense_Mutationc.929G>Ap.Arg310Hisp.R310HP48729protein_codingdeleterious_low_confidence(0)benign(0.062)TCGA-AA-3864-01Colorectumcolon adenocarcinomaMale>=65I/IIUnknownUnknownSD
CSNK1A1SNVMissense_Mutationrs865943998c.854C>Tp.Ala285Valp.A285VP48729protein_codingtolerated_low_confidence(0.13)benign(0.261)TCGA-AA-A022-01Colorectumcolon adenocarcinomaFemale>=65I/IIUnknownUnknownSD
CSNK1A1SNVMissense_Mutationnovelc.812N>Tp.Thr271Metp.T271MP48729protein_codingdeleterious_low_confidence(0)possibly_damaging(0.493)TCGA-A5-A0G1-01Endometriumuterine corpus endometrioid carcinomaFemale>=65I/IIUnknownUnknownSD
CSNK1A1SNVMissense_Mutationc.292N>Ap.Glu98Lysp.E98KP48729protein_codingdeleterious_low_confidence(0)probably_damaging(0.975)TCGA-AJ-A3EL-01Endometriumuterine corpus endometrioid carcinomaFemale<65I/IIUnknownUnknownSD
CSNK1A1SNVMissense_Mutationnovelc.874N>Tp.Arg292Cysp.R292CP48729protein_codingdeleterious_low_confidence(0)benign(0.062)TCGA-AX-A06F-01Endometriumuterine corpus endometrioid carcinomaFemale<65III/IVChemotherapycarboplatinSD
Page: 1 2 3 4 

Top

Related drugs of malignant transformation related genes

check buttonIdentification of chemicals and drugs interact with genes involved in malignant transfromation
(DGIdb 4.0)
Entrez IDSymbolCategoryInteraction TypesDrug Claim NameDrug NamePMIDs
1452CSNK1A1KINASE, SERINE THREONINE KINASE, DRUGGABLE GENOME, ENZYMESP-600125SP-600125
1452CSNK1A1KINASE, SERINE THREONINE KINASE, DRUGGABLE GENOME, ENZYMEinhibitor178102608IC261
1452CSNK1A1KINASE, SERINE THREONINE KINASE, DRUGGABLE GENOME, ENZYMEAZD-1775ADAVOSERTIB
1452CSNK1A1KINASE, SERINE THREONINE KINASE, DRUGGABLE GENOME, ENZYMEDNDI1417467CHEMBL1997335
1452CSNK1A1KINASE, SERINE THREONINE KINASE, DRUGGABLE GENOME, ENZYMESB-220025SB-220025
1452CSNK1A1KINASE, SERINE THREONINE KINASE, DRUGGABLE GENOME, ENZYMEinhibitor178102563
1452CSNK1A1KINASE, SERINE THREONINE KINASE, DRUGGABLE GENOME, ENZYME681640CHEMBL379975
1452CSNK1A1KINASE, SERINE THREONINE KINASE, DRUGGABLE GENOME, ENZYMEAG-1879CHEMBL406845
1452CSNK1A1KINASE, SERINE THREONINE KINASE, DRUGGABLE GENOME, ENZYMEPHA-767491CHEMBL225519
1452CSNK1A1KINASE, SERINE THREONINE KINASE, DRUGGABLE GENOME, ENZYMETAK-715TAK-715
Page: 1 2