
|
|||||
|
 | |
| |
| |
| |
| |
| |
|
Gene: CSKMT |
Gene summary for CSKMT |
| Gene information | Species | Human | Gene symbol | CSKMT | Gene ID | 751071 |
| Gene name | citrate synthase lysine methyltransferase | |
| Gene Alias | CS-KMT | |
| Cytomap | 11q12.3 | |
| Gene Type | protein-coding | GO ID | GO:0006464 | UniProtAcc | A8MUP2 |
Top |
Malignant transformation analysis |
| Identification of the aberrant gene expression in precancerous and cancerous lesions by comparing the gene expression of stem-like cells in diseased tissues with normal stem cells |
| Entrez ID | Symbol | Replicates | Species | Organ | Tissue | Adj P-value | Log2FC | Malignancy |
| 751071 | CSKMT | AEH-subject1 | Human | Endometrium | AEH | 1.10e-39 | 7.18e-01 | -0.3059 |
| 751071 | CSKMT | AEH-subject2 | Human | Endometrium | AEH | 9.27e-22 | 5.22e-01 | -0.2525 |
| 751071 | CSKMT | AEH-subject3 | Human | Endometrium | AEH | 1.92e-21 | 5.47e-01 | -0.2576 |
| 751071 | CSKMT | AEH-subject4 | Human | Endometrium | AEH | 2.95e-10 | 3.45e-01 | -0.2657 |
| 751071 | CSKMT | EEC-subject1 | Human | Endometrium | EEC | 8.77e-08 | 2.24e-01 | -0.2682 |
| 751071 | CSKMT | EEC-subject2 | Human | Endometrium | EEC | 4.20e-27 | 5.13e-01 | -0.2607 |
| 751071 | CSKMT | EEC-subject4 | Human | Endometrium | EEC | 3.71e-04 | 1.57e-01 | -0.2571 |
| 751071 | CSKMT | EEC-subject5 | Human | Endometrium | EEC | 8.77e-08 | 2.31e-01 | -0.249 |
| 751071 | CSKMT | GSM5276934 | Human | Endometrium | EEC | 1.56e-02 | 1.02e-01 | -0.0913 |
| 751071 | CSKMT | GSM5276935 | Human | Endometrium | EEC | 1.87e-06 | 1.53e-01 | -0.123 |
| 751071 | CSKMT | GSM5276937 | Human | Endometrium | EEC | 1.18e-02 | 1.18e-01 | -0.0897 |
| 751071 | CSKMT | GSM6177620_NYU_UCEC1_lib1_lib1 | Human | Endometrium | EEC | 4.69e-11 | 4.49e-01 | -0.1869 |
| 751071 | CSKMT | GSM6177621_NYU_UCEC2_lib1_lib1 | Human | Endometrium | EEC | 3.89e-10 | 3.44e-01 | -0.1934 |
| 751071 | CSKMT | GSM6177622_NYU_UCEC3_lib2_lib2 | Human | Endometrium | EEC | 1.45e-02 | 1.91e-01 | -0.1916 |
| 751071 | CSKMT | GSM6177623_NYU_UCEC3_Vis | Human | Endometrium | EEC | 8.70e-09 | 2.64e-01 | -0.1269 |
| 751071 | CSKMT | LZE4T | Human | Esophagus | ESCC | 2.35e-12 | 3.54e-01 | 0.0811 |
| 751071 | CSKMT | LZE5T | Human | Esophagus | ESCC | 1.57e-03 | 2.22e-01 | 0.0514 |
| 751071 | CSKMT | LZE7T | Human | Esophagus | ESCC | 4.33e-11 | 5.50e-01 | 0.0667 |
| 751071 | CSKMT | LZE8T | Human | Esophagus | ESCC | 5.66e-07 | 2.44e-01 | 0.067 |
| 751071 | CSKMT | LZE20T | Human | Esophagus | ESCC | 1.97e-04 | 1.86e-01 | 0.0662 |
| Page: 1 2 3 |
| Tissue | Expression Dynamics | Abbreviation |
| Endometrium | 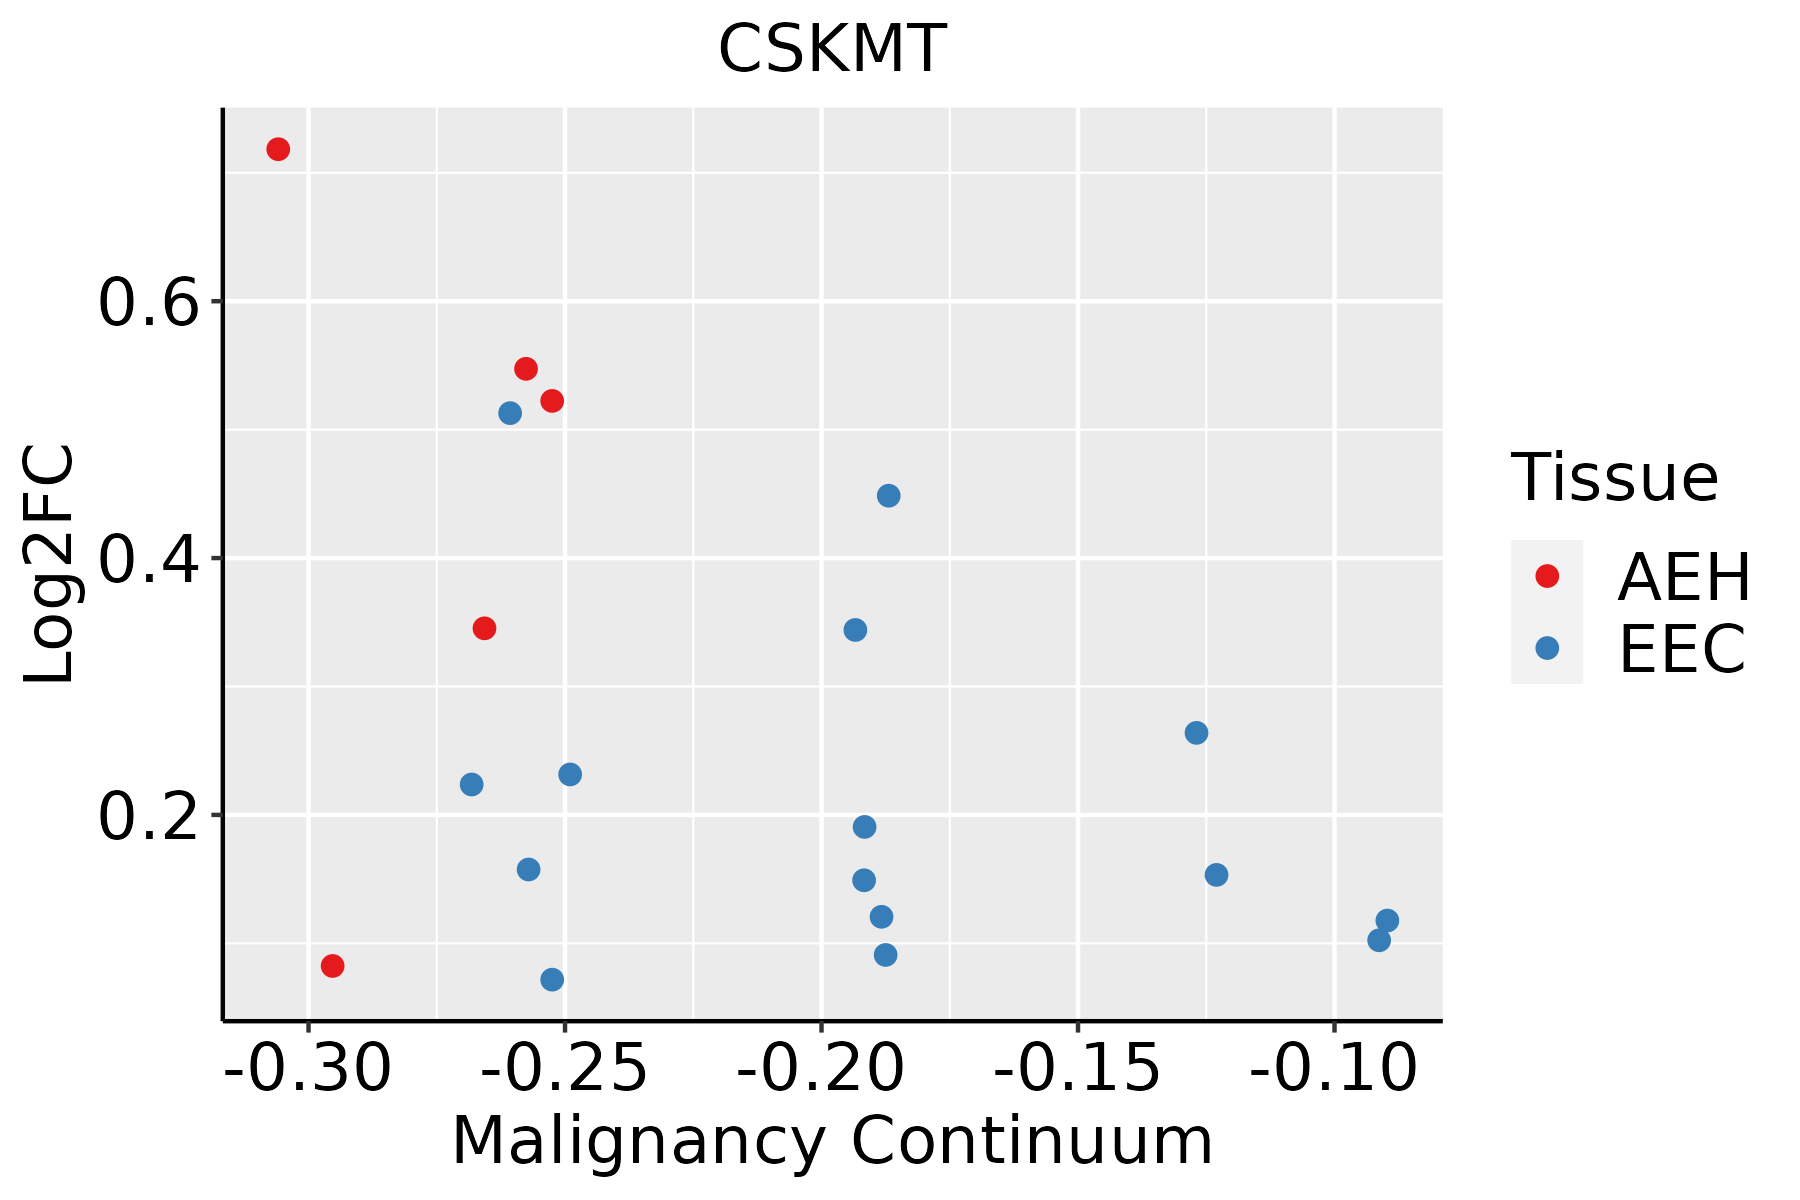 | AEH: Atypical endometrial hyperplasia |
| EEC: Endometrioid Cancer | ||
| Esophagus | 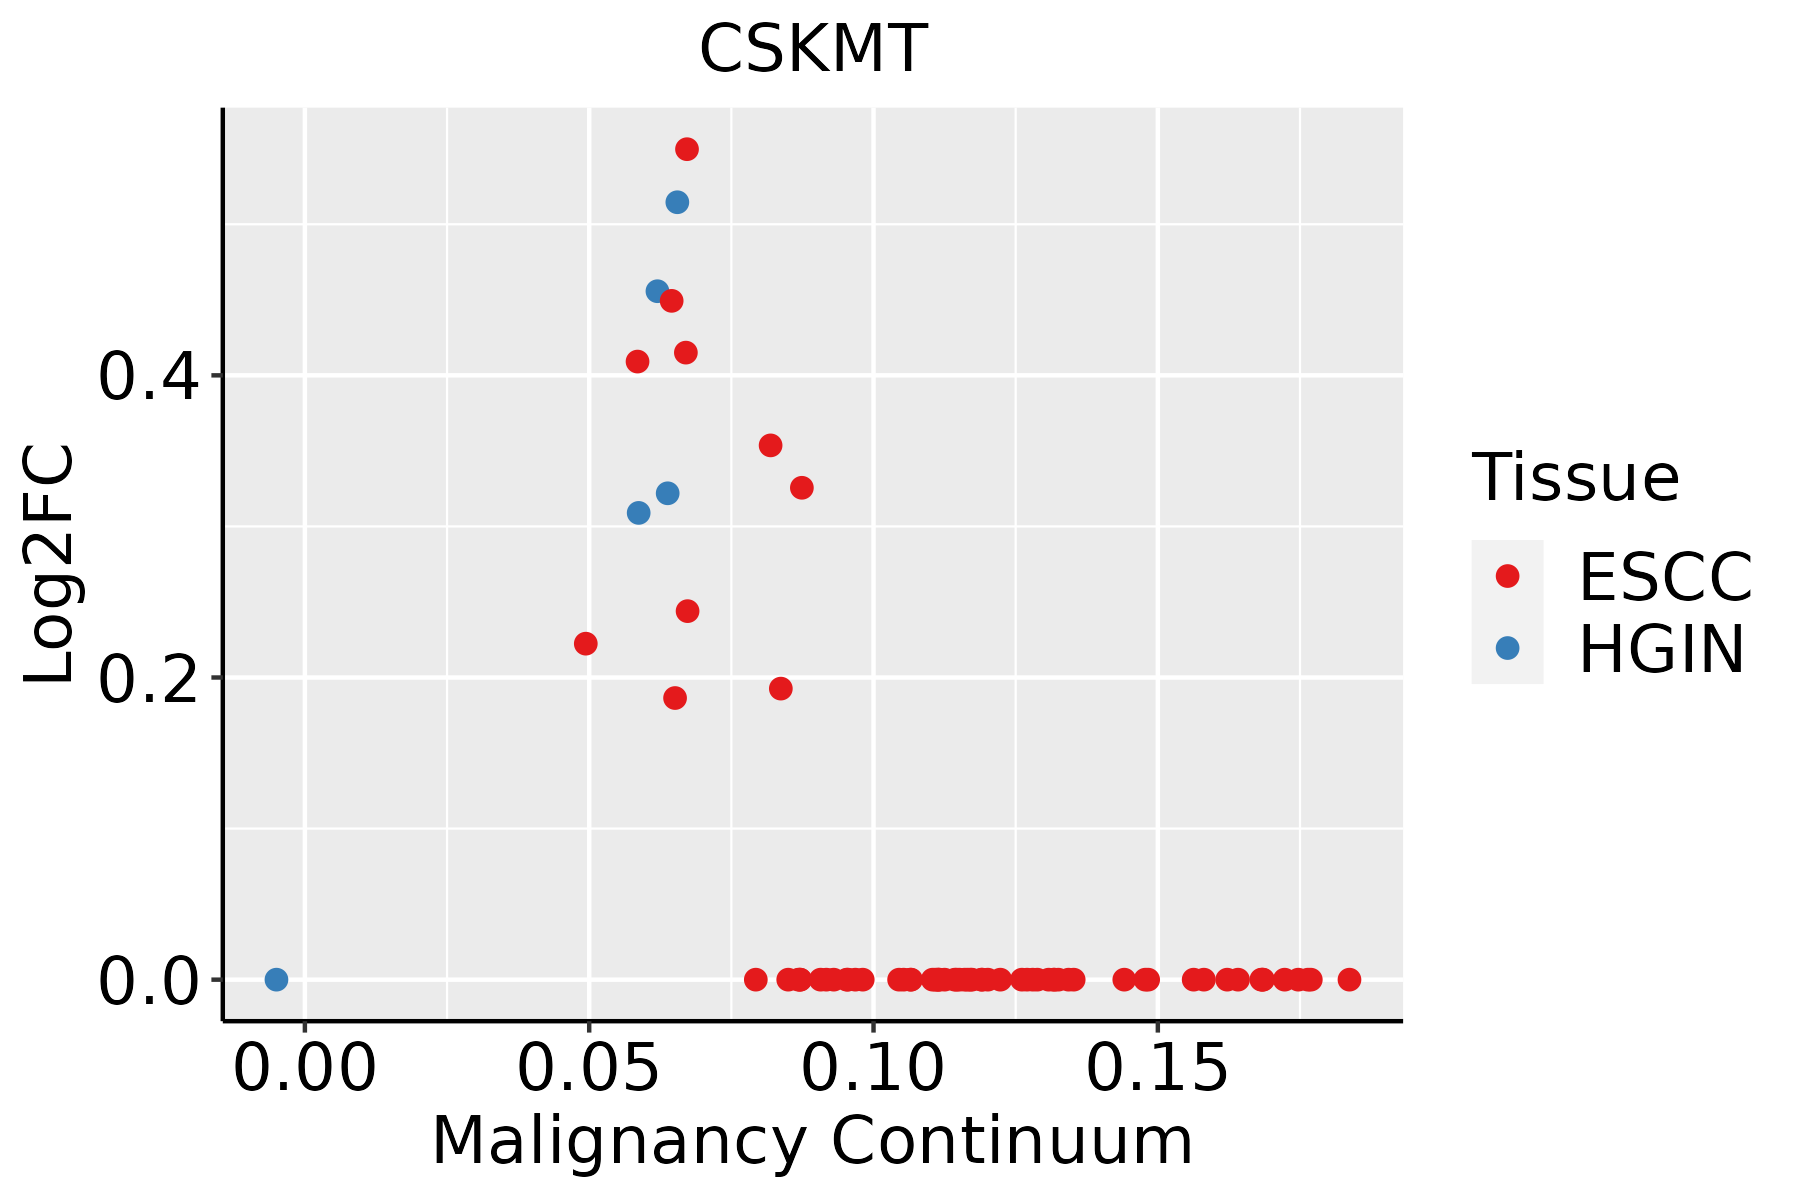 | ESCC: Esophageal squamous cell carcinoma |
| HGIN: High-grade intraepithelial neoplasias | ||
| LGIN: Low-grade intraepithelial neoplasias | ||
| Liver | 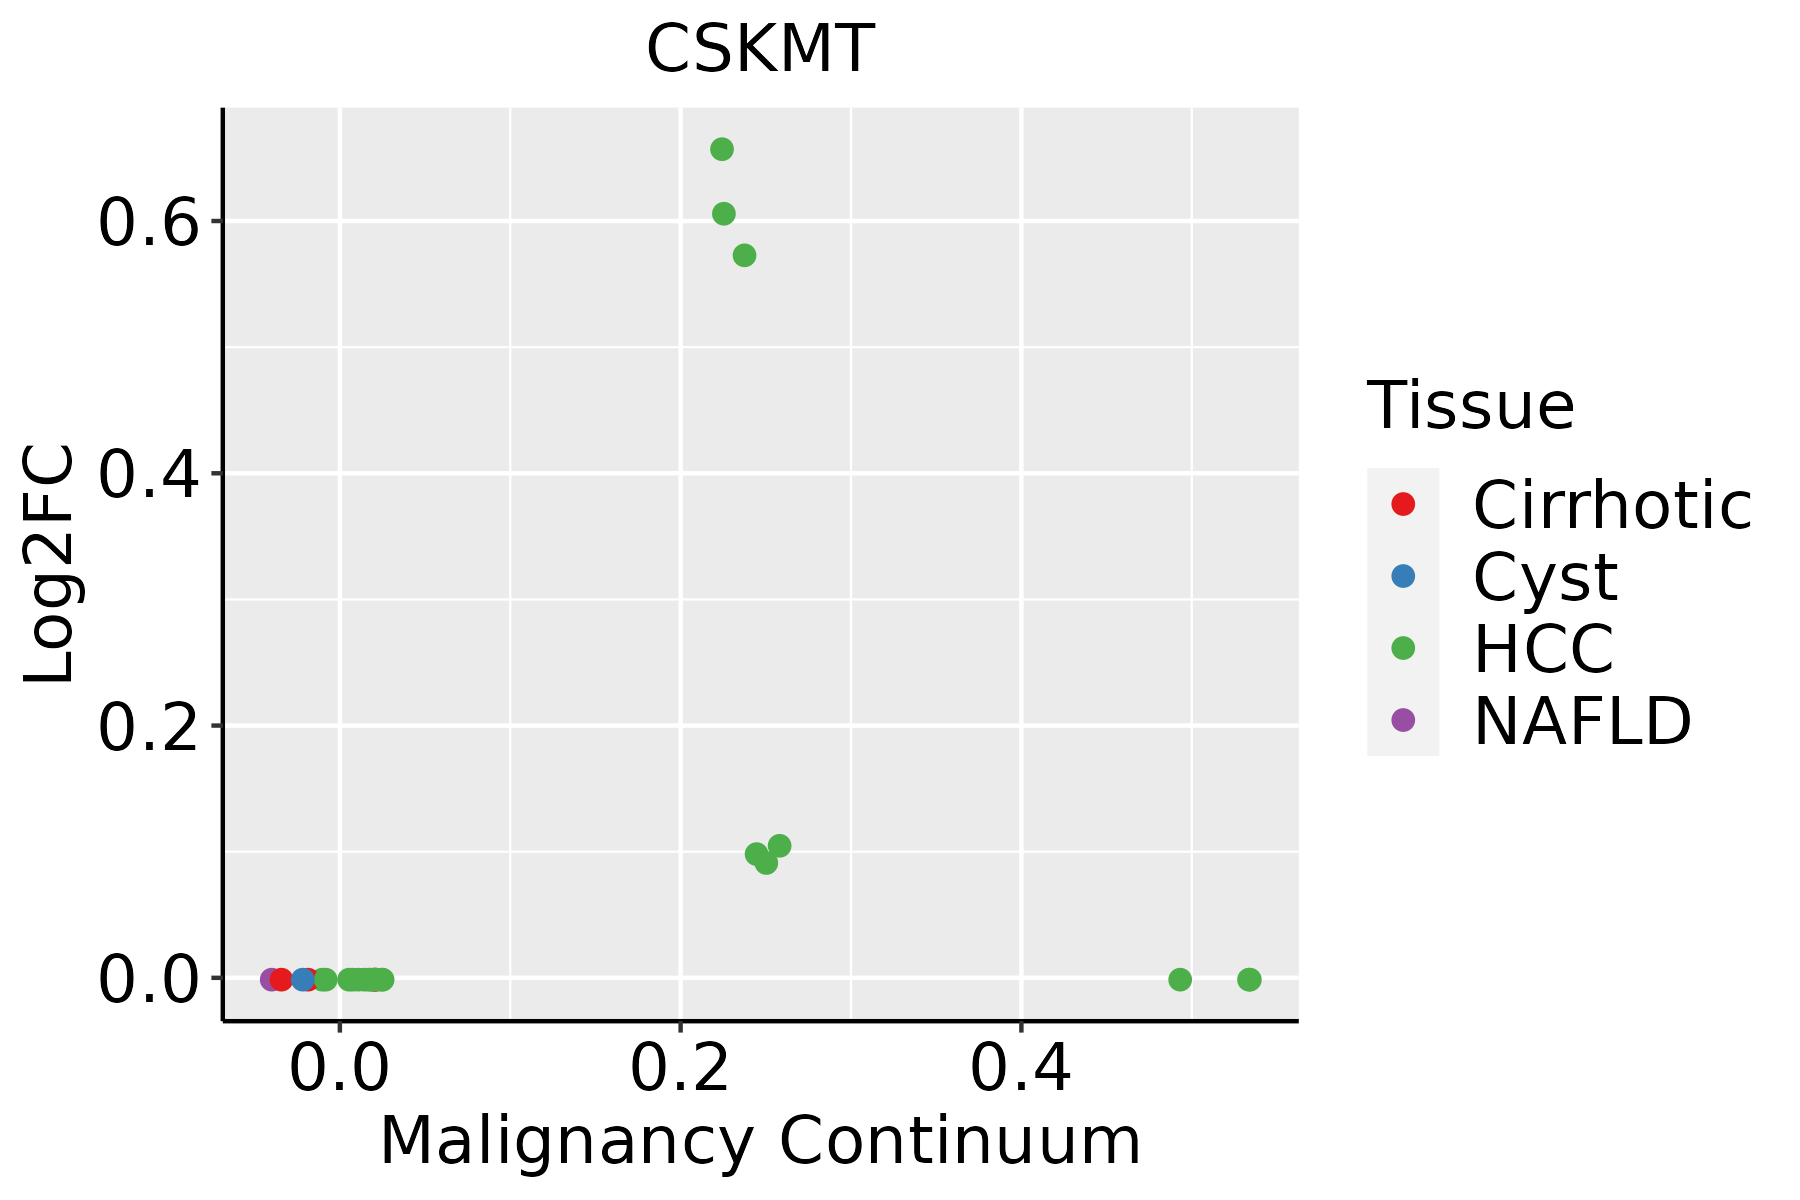 | HCC: Hepatocellular carcinoma |
| NAFLD: Non-alcoholic fatty liver disease | ||
| Lung |  | AAH: Atypical adenomatous hyperplasia |
| AIS: Adenocarcinoma in situ | ||
| IAC: Invasive lung adenocarcinoma | ||
| MIA: Minimally invasive adenocarcinoma | ||
| Thyroid |  | ATC: Anaplastic thyroid cancer |
| HT: Hashimoto's thyroiditis | ||
| PTC: Papillary thyroid cancer |
| ∗log2FC in expression of this searched gene in stem-like cells from each diseased tissue sample relative to stem-like cells in normal samples in each tissue plotted against the malignancy continuum. Samples are colored based on if they are from different disease stage. |
Top |
Malignant transformation related pathway analysis |
| Find out the enriched GO biological processes and KEGG pathways involved in transition from healthy to precancer to cancer |
| Tissue | Disease Stage | Enriched GO biological Processes |
| Colorectum | AD |  |
| Colorectum | SER |  |
| Colorectum | MSS |  |
| Colorectum | MSI-H |  |
| Colorectum | FAP |  |
| ∗Top 15 enriched GO BP terms are showed in the bar plot of each disease state in each tissue. Each row represents a significant GO biological process which is colored according to the -log10(p.adjust). |
| Page: 1 2 3 4 5 6 7 8 9 |
| GO ID | Tissue | Disease Stage | Description | Gene Ratio | Bg Ratio | pvalue | p.adjust | Count |
| GO:00182057 | Esophagus | HGIN | peptidyl-lysine modification | 88/2587 | 376/18723 | 2.99e-07 | 1.39e-05 | 88 |
| GO:0018027 | Esophagus | HGIN | peptidyl-lysine dimethylation | 10/2587 | 26/18723 | 1.60e-03 | 1.79e-02 | 10 |
| GO:00064798 | Esophagus | HGIN | protein methylation | 38/2587 | 181/18723 | 5.05e-03 | 4.22e-02 | 38 |
| GO:00082138 | Esophagus | HGIN | protein alkylation | 38/2587 | 181/18723 | 5.05e-03 | 4.22e-02 | 38 |
| GO:00180227 | Esophagus | HGIN | peptidyl-lysine methylation | 29/2587 | 131/18723 | 6.22e-03 | 4.95e-02 | 29 |
| GO:001820514 | Esophagus | ESCC | peptidyl-lysine modification | 259/8552 | 376/18723 | 3.90e-20 | 5.26e-18 | 259 |
| GO:00434143 | Esophagus | ESCC | macromolecule methylation | 199/8552 | 316/18723 | 3.44e-10 | 9.57e-09 | 199 |
| GO:00322592 | Esophagus | ESCC | methylation | 222/8552 | 364/18723 | 2.26e-09 | 5.09e-08 | 222 |
| GO:000647914 | Esophagus | ESCC | protein methylation | 115/8552 | 181/18723 | 9.07e-07 | 1.16e-05 | 115 |
| GO:000821314 | Esophagus | ESCC | protein alkylation | 115/8552 | 181/18723 | 9.07e-07 | 1.16e-05 | 115 |
| GO:001802214 | Esophagus | ESCC | peptidyl-lysine methylation | 79/8552 | 131/18723 | 5.17e-04 | 2.86e-03 | 79 |
| GO:00180231 | Esophagus | ESCC | peptidyl-lysine trimethylation | 31/8552 | 50/18723 | 1.48e-02 | 4.79e-02 | 31 |
| GO:00182052 | Liver | HCC | peptidyl-lysine modification | 230/7958 | 376/18723 | 1.51e-13 | 8.32e-12 | 230 |
| GO:00434141 | Liver | HCC | macromolecule methylation | 183/7958 | 316/18723 | 2.00e-08 | 4.72e-07 | 183 |
| GO:0032259 | Liver | HCC | methylation | 206/7958 | 364/18723 | 3.35e-08 | 7.53e-07 | 206 |
| GO:00064792 | Liver | HCC | protein methylation | 111/7958 | 181/18723 | 2.36e-07 | 4.18e-06 | 111 |
| GO:00082132 | Liver | HCC | protein alkylation | 111/7958 | 181/18723 | 2.36e-07 | 4.18e-06 | 111 |
| GO:00180221 | Liver | HCC | peptidyl-lysine methylation | 74/7958 | 131/18723 | 8.46e-04 | 5.06e-03 | 74 |
| GO:00182053 | Lung | IAC | peptidyl-lysine modification | 62/2061 | 376/18723 | 7.55e-04 | 9.82e-03 | 62 |
| GO:00180223 | Lung | IAC | peptidyl-lysine methylation | 27/2061 | 131/18723 | 9.41e-04 | 1.14e-02 | 27 |
| Page: 1 2 |
| Pathway ID | Tissue | Disease Stage | Description | Gene Ratio | Bg Ratio | pvalue | p.adjust | qvalue | Count |
| Page: 1 |
Top |
Cell-cell communication analysis |
| Identification of potential cell-cell interactions between two cell types and their ligand-receptor pairs for different disease states |
| Ligand | Receptor | LRpair | Pathway | Tissue | Disease Stage |
| Page: 1 |
Top |
Single-cell gene regulatory network inference analysis |
| Find out the significant the regulons (TFs) and the target genes of each regulon across cell types for different disease states |
| TF | Cell Type | Tissue | Disease Stage | Target Gene | RSS | Regulon Activity |
| ∗The dot plots of a searched regulon are shown for all cell subpopulations in each disease state of each tissue based on the regulon specific score inferred using pySCENIC and by calculating the average expression. |
| Page: 1 |
Top |
Somatic mutation of malignant transformation related genes |
| Annotation of somatic variants for genes involved in malignant transformation |
| Hugo Symbol | Variant Class | Variant Classification | dbSNP RS | HGVSc | HGVSp | HGVSp Short | SWISSPROT | BIOTYPE | SIFT | PolyPhen | Tumor Sample Barcode | Tissue | Histology | Sex | Age | Stage | Therapy Types | Drugs | Outcome |
| Page: 1 |
Top |
Related drugs of malignant transformation related genes |
| Identification of chemicals and drugs interact with genes involved in malignant transfromation |
| (DGIdb 4.0) |
| Entrez ID | Symbol | Category | Interaction Types | Drug Claim Name | Drug Name | PMIDs |
| Page: 1 |

Copyright 2023-Present -The University of Texas Health Science Center at Houston |