
|
|||||
|
 | |
| |
| |
| |
| |
| |
|
Gene: CSK |
Gene summary for CSK |
| Gene information | Species | Human | Gene symbol | CSK | Gene ID | 1445 |
| Gene name | C-terminal Src kinase | |
| Gene Alias | CSK | |
| Cytomap | 15q24.1 | |
| Gene Type | protein-coding | GO ID | GO:0000165 | UniProtAcc | A8K3B6 |
Top |
Malignant transformation analysis |
| Identification of the aberrant gene expression in precancerous and cancerous lesions by comparing the gene expression of stem-like cells in diseased tissues with normal stem cells |
| Entrez ID | Symbol | Replicates | Species | Organ | Tissue | Adj P-value | Log2FC | Malignancy |
| 1445 | CSK | LZE4T | Human | Esophagus | ESCC | 1.54e-06 | 1.70e-01 | 0.0811 |
| 1445 | CSK | LZE7T | Human | Esophagus | ESCC | 2.59e-21 | 5.44e-01 | 0.0667 |
| 1445 | CSK | LZE22D1 | Human | Esophagus | HGIN | 2.86e-02 | 8.16e-02 | 0.0595 |
| 1445 | CSK | LZE22T | Human | Esophagus | ESCC | 1.32e-02 | 2.18e-01 | 0.068 |
| 1445 | CSK | LZE24T | Human | Esophagus | ESCC | 3.22e-08 | 1.71e-01 | 0.0596 |
| 1445 | CSK | LZE6T | Human | Esophagus | ESCC | 1.91e-05 | 2.49e-01 | 0.0845 |
| 1445 | CSK | P1T-E | Human | Esophagus | ESCC | 2.84e-15 | 3.53e-01 | 0.0875 |
| 1445 | CSK | P2T-E | Human | Esophagus | ESCC | 2.34e-18 | 2.72e-01 | 0.1177 |
| 1445 | CSK | P4T-E | Human | Esophagus | ESCC | 3.74e-26 | 4.67e-01 | 0.1323 |
| 1445 | CSK | P5T-E | Human | Esophagus | ESCC | 1.32e-05 | 1.04e-01 | 0.1327 |
| 1445 | CSK | P8T-E | Human | Esophagus | ESCC | 3.59e-17 | 3.19e-01 | 0.0889 |
| 1445 | CSK | P9T-E | Human | Esophagus | ESCC | 3.74e-13 | 2.16e-01 | 0.1131 |
| 1445 | CSK | P10T-E | Human | Esophagus | ESCC | 3.11e-13 | 2.18e-01 | 0.116 |
| 1445 | CSK | P11T-E | Human | Esophagus | ESCC | 2.51e-07 | 2.32e-01 | 0.1426 |
| 1445 | CSK | P12T-E | Human | Esophagus | ESCC | 5.92e-10 | 1.84e-01 | 0.1122 |
| 1445 | CSK | P15T-E | Human | Esophagus | ESCC | 3.84e-20 | 2.94e-01 | 0.1149 |
| 1445 | CSK | P16T-E | Human | Esophagus | ESCC | 2.55e-13 | 2.19e-01 | 0.1153 |
| 1445 | CSK | P19T-E | Human | Esophagus | ESCC | 8.42e-11 | 4.29e-01 | 0.1662 |
| 1445 | CSK | P20T-E | Human | Esophagus | ESCC | 2.80e-12 | 1.77e-01 | 0.1124 |
| 1445 | CSK | P21T-E | Human | Esophagus | ESCC | 1.17e-16 | 1.26e-01 | 0.1617 |
| Page: 1 2 3 4 5 6 |
| Tissue | Expression Dynamics | Abbreviation |
| Esophagus | 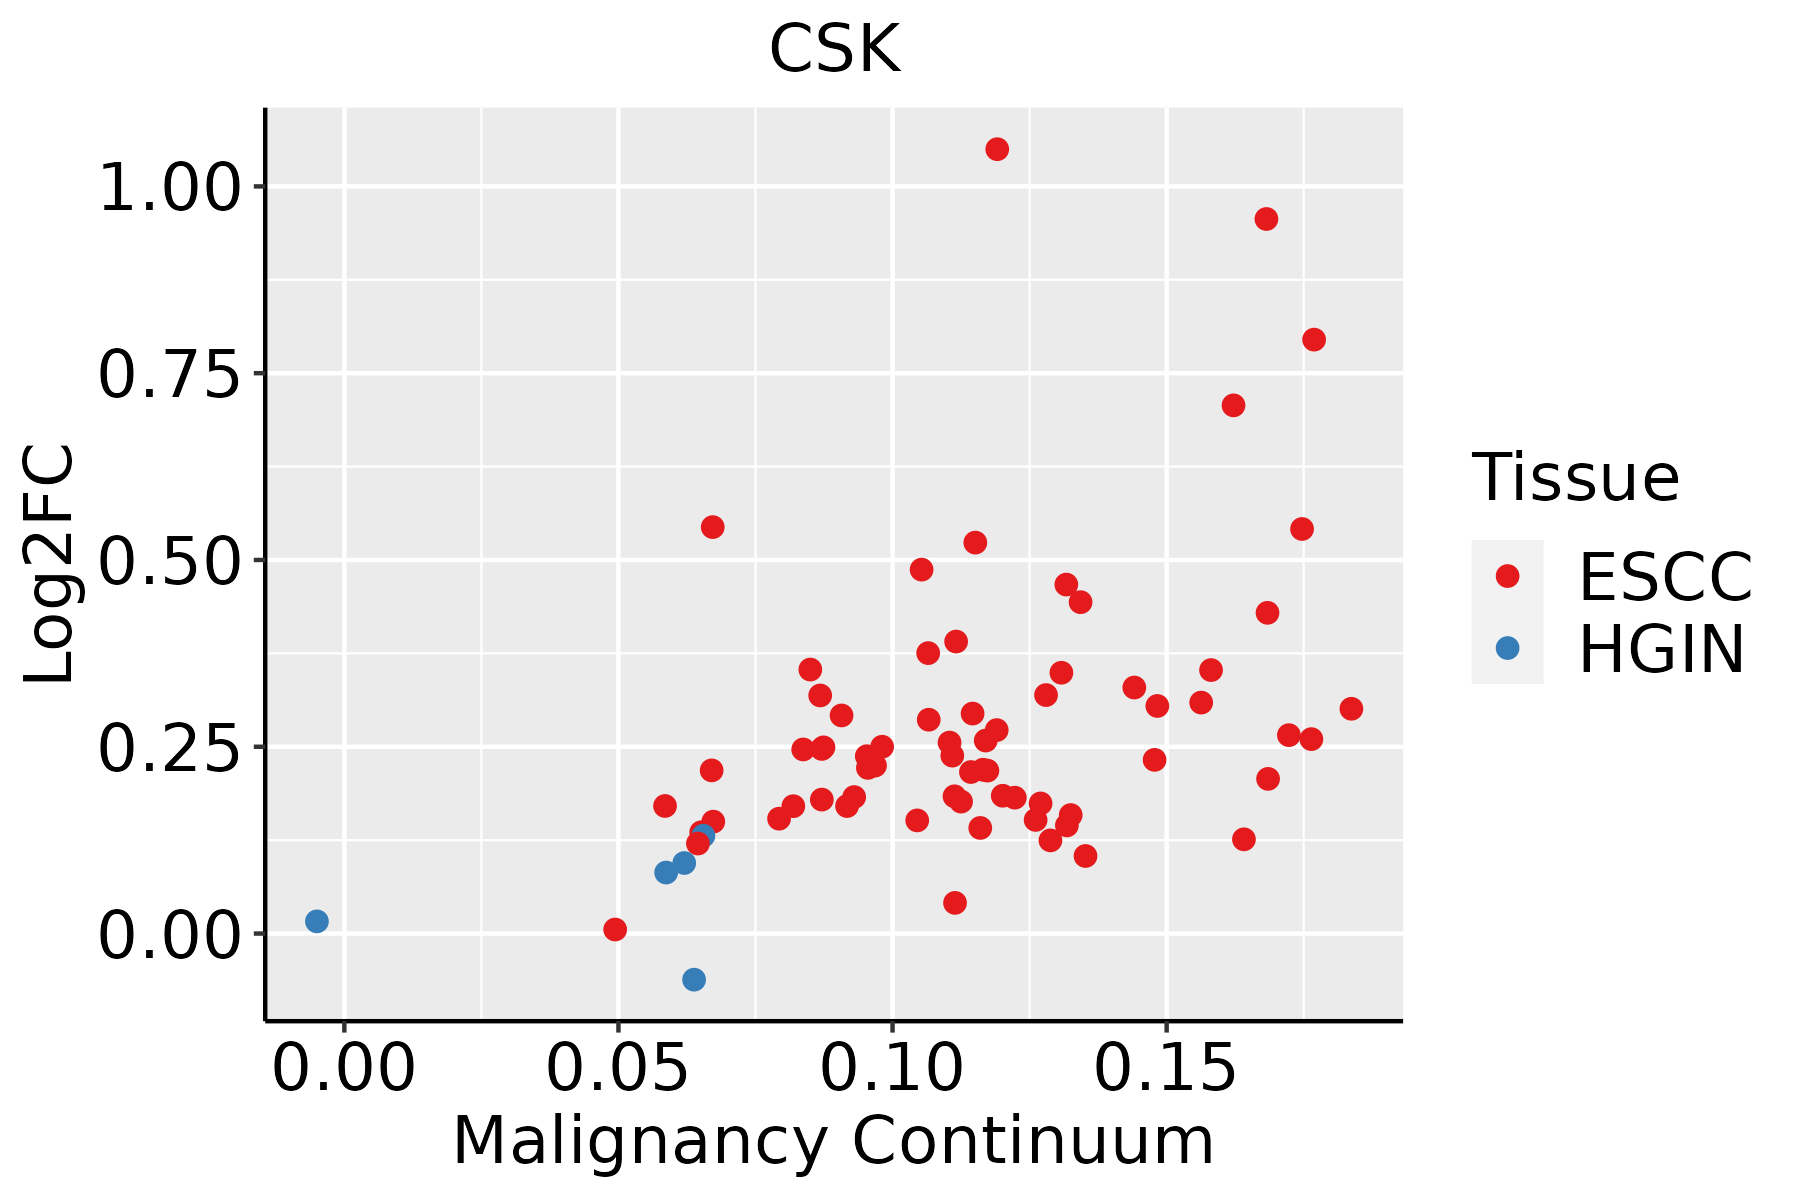 | ESCC: Esophageal squamous cell carcinoma |
| HGIN: High-grade intraepithelial neoplasias | ||
| LGIN: Low-grade intraepithelial neoplasias | ||
| Liver | 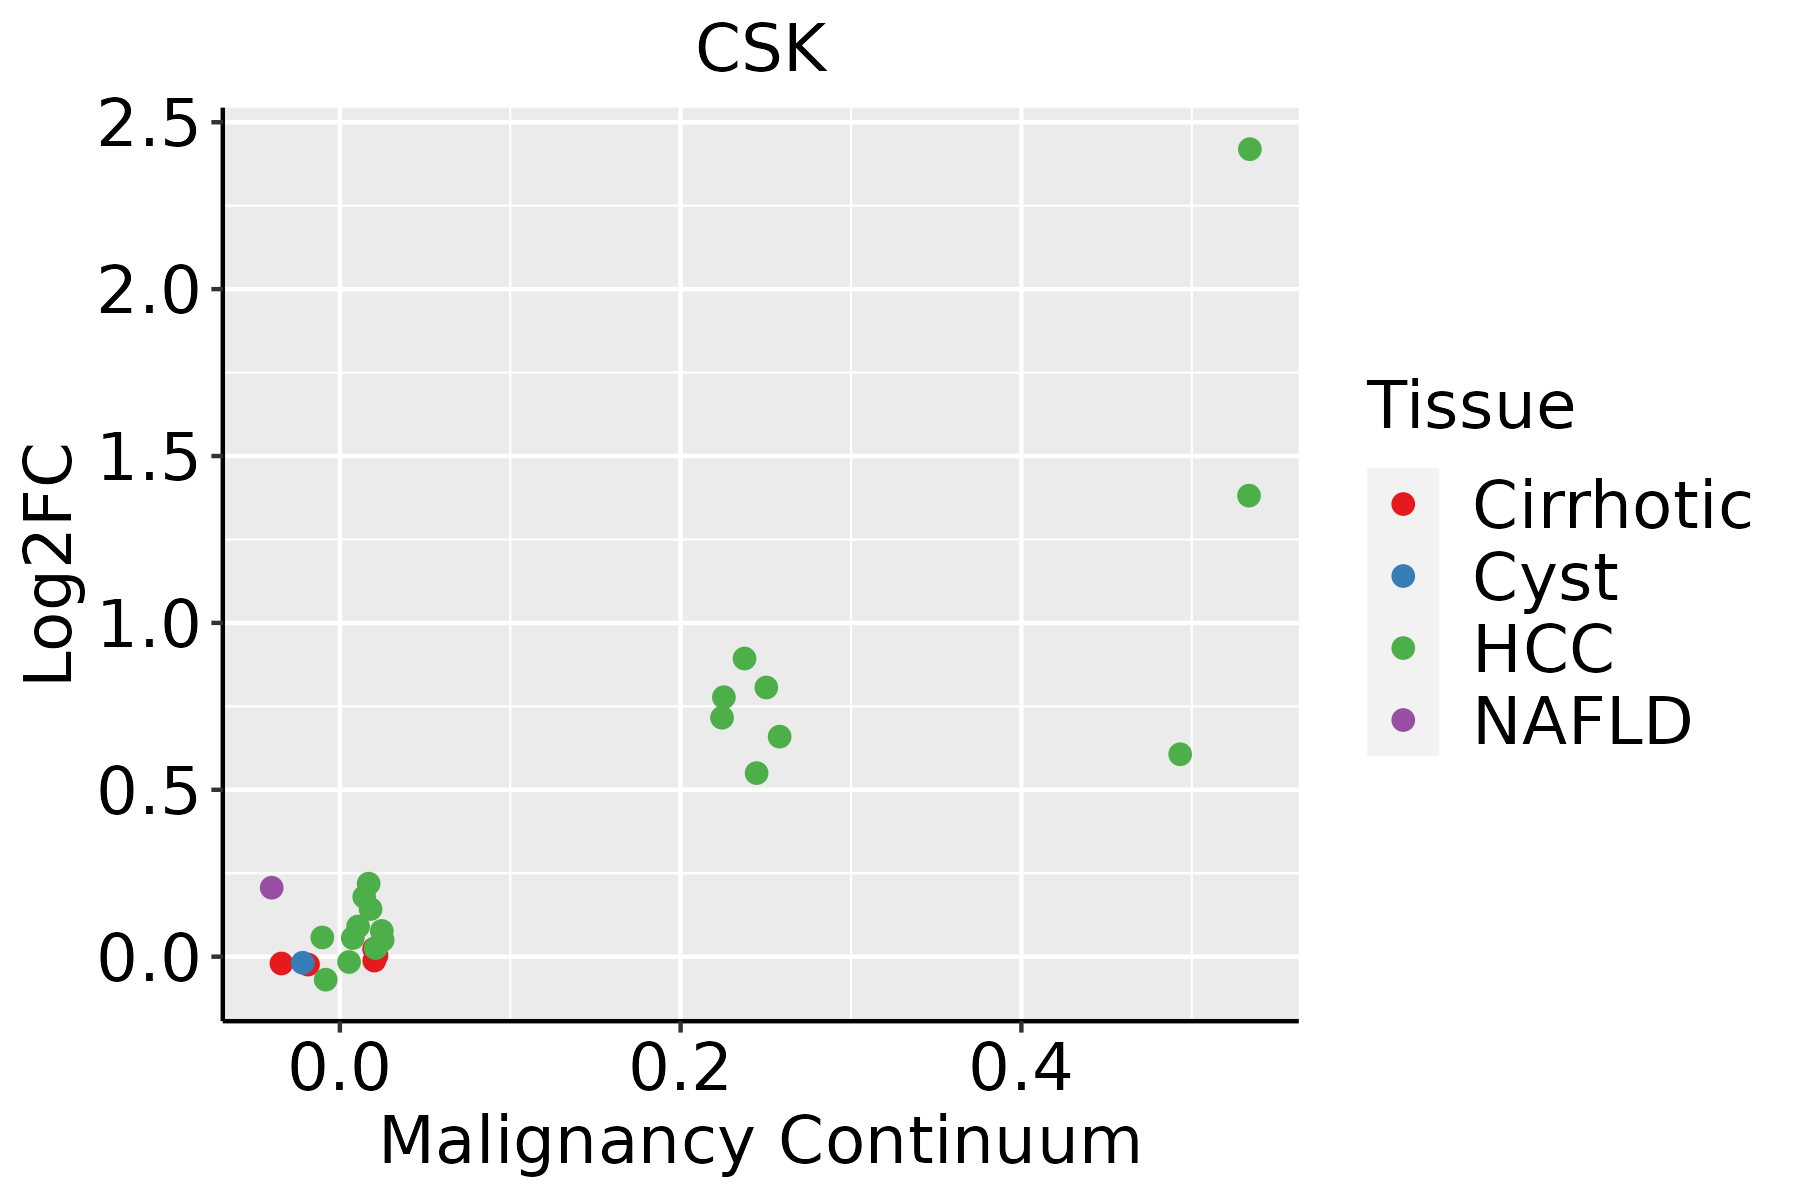 | HCC: Hepatocellular carcinoma |
| NAFLD: Non-alcoholic fatty liver disease | ||
| Oral Cavity | 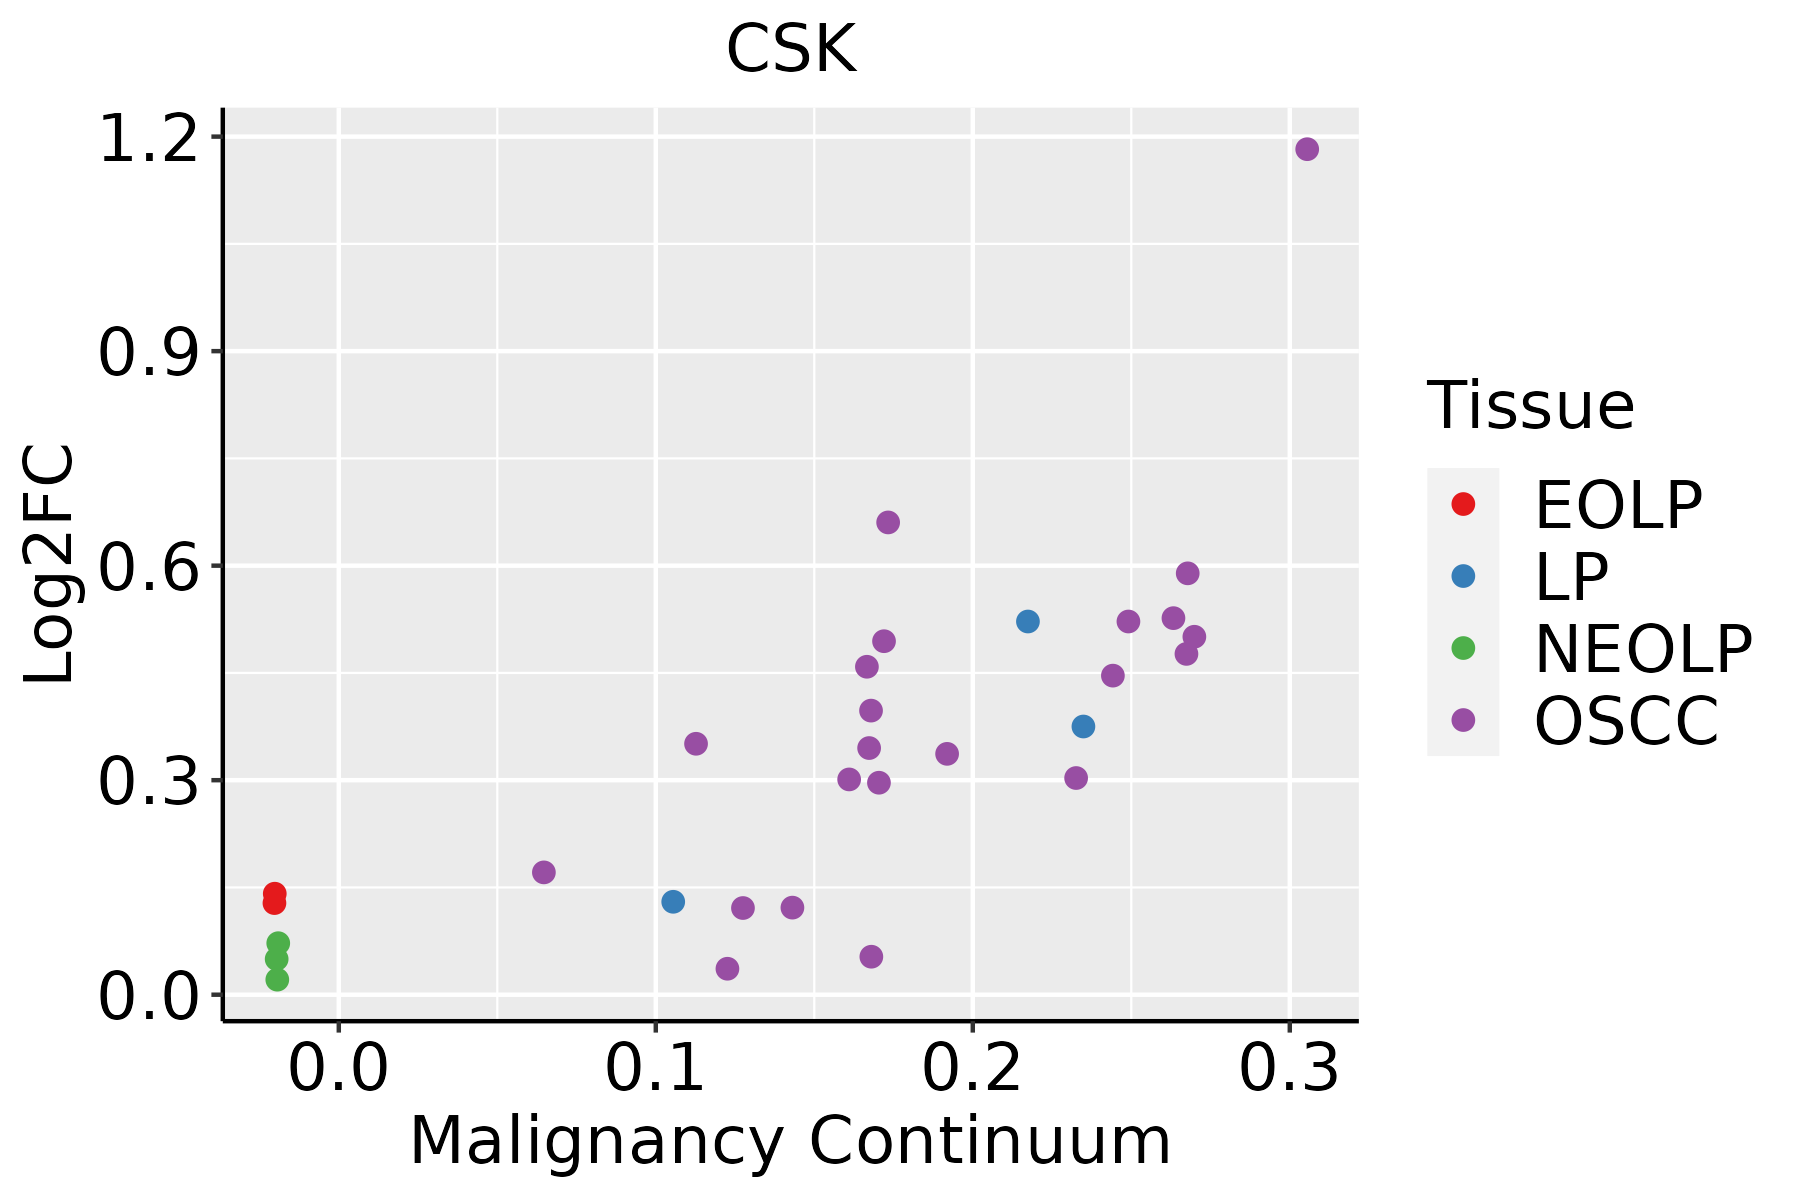 | EOLP: Erosive Oral lichen planus |
| LP: leukoplakia | ||
| NEOLP: Non-erosive oral lichen planus | ||
| OSCC: Oral squamous cell carcinoma | ||
| Thyroid | 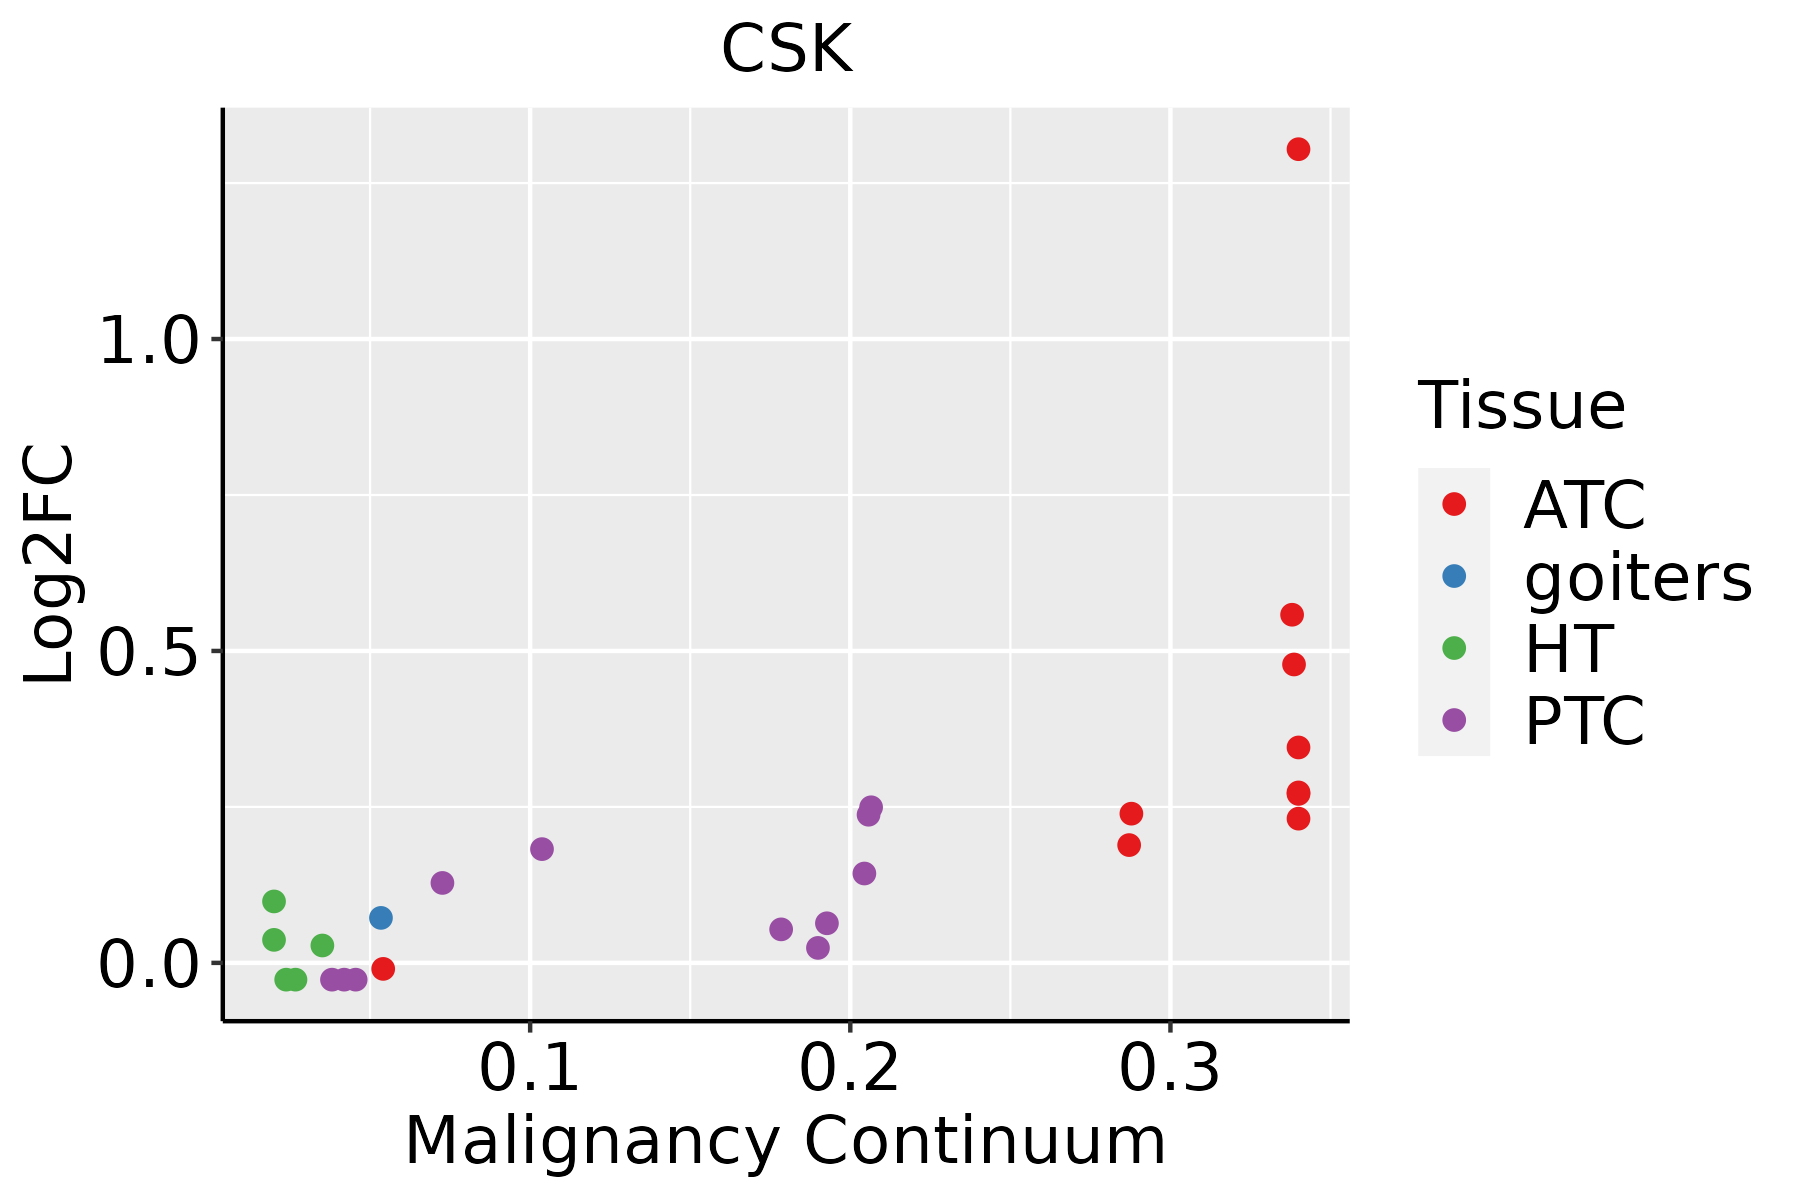 | ATC: Anaplastic thyroid cancer |
| HT: Hashimoto's thyroiditis | ||
| PTC: Papillary thyroid cancer |
| ∗log2FC in expression of this searched gene in stem-like cells from each diseased tissue sample relative to stem-like cells in normal samples in each tissue plotted against the malignancy continuum. Samples are colored based on if they are from different disease stage. |
Top |
Malignant transformation related pathway analysis |
| Find out the enriched GO biological processes and KEGG pathways involved in transition from healthy to precancer to cancer |
| Tissue | Disease Stage | Enriched GO biological Processes |
| Colorectum | AD |  |
| Colorectum | SER |  |
| Colorectum | MSS |  |
| Colorectum | MSI-H |  |
| Colorectum | FAP |  |
| ∗Top 15 enriched GO BP terms are showed in the bar plot of each disease state in each tissue. Each row represents a significant GO biological process which is colored according to the -log10(p.adjust). |
| Page: 1 2 3 4 5 6 7 8 9 |
| GO ID | Tissue | Disease Stage | Description | Gene Ratio | Bg Ratio | pvalue | p.adjust | Count |
| GO:005254714 | Breast | IDC | regulation of peptidase activity | 96/1434 | 461/18723 | 7.58e-20 | 6.15e-17 | 96 |
| GO:005254814 | Breast | IDC | regulation of endopeptidase activity | 88/1434 | 432/18723 | 1.20e-17 | 4.85e-15 | 88 |
| GO:004586114 | Breast | IDC | negative regulation of proteolysis | 70/1434 | 351/18723 | 8.21e-14 | 2.22e-11 | 70 |
| GO:005134613 | Breast | IDC | negative regulation of hydrolase activity | 71/1434 | 379/18723 | 1.33e-12 | 2.90e-10 | 71 |
| GO:001046613 | Breast | IDC | negative regulation of peptidase activity | 56/1434 | 262/18723 | 1.39e-12 | 2.92e-10 | 56 |
| GO:001095112 | Breast | IDC | negative regulation of endopeptidase activity | 52/1434 | 252/18723 | 3.53e-11 | 5.57e-09 | 52 |
| GO:000926612 | Breast | IDC | response to temperature stimulus | 34/1434 | 178/18723 | 5.88e-07 | 2.83e-05 | 34 |
| GO:003166714 | Breast | IDC | response to nutrient levels | 62/1434 | 474/18723 | 2.33e-05 | 5.57e-04 | 62 |
| GO:000940912 | Breast | IDC | response to cold | 13/1434 | 49/18723 | 5.70e-05 | 1.20e-03 | 13 |
| GO:005160413 | Breast | IDC | protein maturation | 35/1434 | 294/18723 | 6.18e-03 | 4.40e-02 | 35 |
| GO:005254710 | Cervix | CC | regulation of peptidase activity | 112/2311 | 461/18723 | 6.70e-13 | 3.08e-10 | 112 |
| GO:005254810 | Cervix | CC | regulation of endopeptidase activity | 103/2311 | 432/18723 | 1.89e-11 | 5.14e-09 | 103 |
| GO:004586110 | Cervix | CC | negative regulation of proteolysis | 80/2311 | 351/18723 | 2.88e-08 | 1.98e-06 | 80 |
| GO:00513469 | Cervix | CC | negative regulation of hydrolase activity | 81/2311 | 379/18723 | 4.27e-07 | 1.67e-05 | 81 |
| GO:00104669 | Cervix | CC | negative regulation of peptidase activity | 60/2311 | 262/18723 | 1.27e-06 | 4.34e-05 | 60 |
| GO:003166710 | Cervix | CC | response to nutrient levels | 92/2311 | 474/18723 | 5.80e-06 | 1.42e-04 | 92 |
| GO:001095110 | Cervix | CC | negative regulation of endopeptidase activity | 56/2311 | 252/18723 | 7.43e-06 | 1.74e-04 | 56 |
| GO:00516048 | Cervix | CC | protein maturation | 56/2311 | 294/18723 | 5.90e-04 | 5.59e-03 | 56 |
| GO:00092668 | Cervix | CC | response to temperature stimulus | 37/2311 | 178/18723 | 9.45e-04 | 7.95e-03 | 37 |
| GO:00094098 | Cervix | CC | response to cold | 13/2311 | 49/18723 | 5.34e-03 | 3.10e-02 | 13 |
| Page: 1 2 3 4 5 6 7 8 9 10 11 12 13 14 15 16 17 18 19 20 21 22 23 24 25 26 27 28 29 30 31 32 33 34 35 36 37 |
| Pathway ID | Tissue | Disease Stage | Description | Gene Ratio | Bg Ratio | pvalue | p.adjust | qvalue | Count |
| hsa0512018 | Esophagus | ESCC | Epithelial cell signaling in Helicobacter pylori infection | 52/4205 | 70/8465 | 2.17e-05 | 1.07e-04 | 5.47e-05 | 52 |
| hsa0512019 | Esophagus | ESCC | Epithelial cell signaling in Helicobacter pylori infection | 52/4205 | 70/8465 | 2.17e-05 | 1.07e-04 | 5.47e-05 | 52 |
| hsa051202 | Liver | HCC | Epithelial cell signaling in Helicobacter pylori infection | 50/4020 | 70/8465 | 3.96e-05 | 2.16e-04 | 1.20e-04 | 50 |
| hsa051203 | Liver | HCC | Epithelial cell signaling in Helicobacter pylori infection | 50/4020 | 70/8465 | 3.96e-05 | 2.16e-04 | 1.20e-04 | 50 |
| hsa0512010 | Oral cavity | OSCC | Epithelial cell signaling in Helicobacter pylori infection | 49/3704 | 70/8465 | 7.57e-06 | 3.59e-05 | 1.83e-05 | 49 |
| hsa0512017 | Oral cavity | OSCC | Epithelial cell signaling in Helicobacter pylori infection | 49/3704 | 70/8465 | 7.57e-06 | 3.59e-05 | 1.83e-05 | 49 |
| hsa0512024 | Oral cavity | LP | Epithelial cell signaling in Helicobacter pylori infection | 38/2418 | 70/8465 | 5.17e-06 | 4.20e-05 | 2.71e-05 | 38 |
| hsa0512034 | Oral cavity | LP | Epithelial cell signaling in Helicobacter pylori infection | 38/2418 | 70/8465 | 5.17e-06 | 4.20e-05 | 2.71e-05 | 38 |
| Page: 1 |
Top |
Cell-cell communication analysis |
| Identification of potential cell-cell interactions between two cell types and their ligand-receptor pairs for different disease states |
| Ligand | Receptor | LRpair | Pathway | Tissue | Disease Stage |
| Page: 1 |
Top |
Single-cell gene regulatory network inference analysis |
| Find out the significant the regulons (TFs) and the target genes of each regulon across cell types for different disease states |
| TF | Cell Type | Tissue | Disease Stage | Target Gene | RSS | Regulon Activity |
| ∗The dot plots of a searched regulon are shown for all cell subpopulations in each disease state of each tissue based on the regulon specific score inferred using pySCENIC and by calculating the average expression. |
| Page: 1 |
Top |
Somatic mutation of malignant transformation related genes |
| Annotation of somatic variants for genes involved in malignant transformation |
| Hugo Symbol | Variant Class | Variant Classification | dbSNP RS | HGVSc | HGVSp | HGVSp Short | SWISSPROT | BIOTYPE | SIFT | PolyPhen | Tumor Sample Barcode | Tissue | Histology | Sex | Age | Stage | Therapy Types | Drugs | Outcome |
| CSK | SNV | Missense_Mutation | novel | c.115N>C | p.Val39Leu | p.V39L | P41240 | protein_coding | tolerated(0.52) | benign(0) | TCGA-2W-A8YY-01 | Cervix | cervical & endocervical cancer | Female | <65 | I/II | Chemotherapy | cisplatin | CR |
| CSK | SNV | Missense_Mutation | rs780001574 | c.296N>T | p.Pro99Leu | p.P99L | P41240 | protein_coding | tolerated(0.07) | benign(0.26) | TCGA-VS-A9UP-01 | Cervix | cervical & endocervical cancer | Female | <65 | I/II | Chemotherapy | cisplatin | PD |
| CSK | SNV | Missense_Mutation | rs749945630 | c.760N>A | p.Val254Met | p.V254M | P41240 | protein_coding | deleterious(0.01) | probably_damaging(0.94) | TCGA-AA-3984-01 | Colorectum | colon adenocarcinoma | Female | <65 | I/II | Unknown | Unknown | SD |
| CSK | SNV | Missense_Mutation | rs200009296 | c.167N>A | p.Arg56His | p.R56H | P41240 | protein_coding | tolerated(0.07) | benign(0.011) | TCGA-AD-A5EJ-01 | Colorectum | colon adenocarcinoma | Female | >=65 | I/II | Unknown | Unknown | SD |
| CSK | SNV | Missense_Mutation | c.946G>A | p.Ala316Thr | p.A316T | P41240 | protein_coding | deleterious(0) | possibly_damaging(0.9) | TCGA-CK-4951-01 | Colorectum | colon adenocarcinoma | Female | >=65 | I/II | Unknown | Unknown | PD | |
| CSK | SNV | Missense_Mutation | c.956A>G | p.Asn319Ser | p.N319S | P41240 | protein_coding | deleterious(0) | probably_damaging(0.934) | TCGA-F4-6570-01 | Colorectum | colon adenocarcinoma | Female | >=65 | I/II | Unknown | Unknown | SD | |
| CSK | SNV | Missense_Mutation | rs754136671 | c.682N>A | p.Ala228Thr | p.A228T | P41240 | protein_coding | tolerated(0.56) | possibly_damaging(0.527) | TCGA-G4-6588-01 | Colorectum | colon adenocarcinoma | Female | <65 | I/II | Unknown | Unknown | SD |
| CSK | SNV | Missense_Mutation | c.952C>T | p.Arg318Cys | p.R318C | P41240 | protein_coding | deleterious(0) | probably_damaging(0.999) | TCGA-AG-A01W-01 | Colorectum | rectum adenocarcinoma | Female | >=65 | I/II | Chemotherapy | 5-fluorouracil | CR | |
| CSK | SNV | Missense_Mutation | novel | c.454N>A | p.Leu152Met | p.L152M | P41240 | protein_coding | tolerated(0.51) | probably_damaging(0.969) | TCGA-AP-A059-01 | Endometrium | uterine corpus endometrioid carcinoma | Female | >=65 | I/II | Unknown | Unknown | SD |
| CSK | SNV | Missense_Mutation | novel | c.103N>A | p.Val35Met | p.V35M | P41240 | protein_coding | tolerated(0.19) | benign(0.138) | TCGA-AX-A2HD-01 | Endometrium | uterine corpus endometrioid carcinoma | Female | >=65 | III/IV | Unknown | Unknown | SD |
| Page: 1 2 3 |
Top |
Related drugs of malignant transformation related genes |
| Identification of chemicals and drugs interact with genes involved in malignant transfromation |
| (DGIdb 4.0) |
| Entrez ID | Symbol | Category | Interaction Types | Drug Claim Name | Drug Name | PMIDs |
| 1445 | CSK | KINASE, DRUGGABLE GENOME, ENZYME, TYROSINE KINASE | inhibitor | 223365983 | RIVOCERANIB | |
| 1445 | CSK | KINASE, DRUGGABLE GENOME, ENZYME, TYROSINE KINASE | 936563-93-8 | |||
| 1445 | CSK | KINASE, DRUGGABLE GENOME, ENZYME, TYROSINE KINASE | hydrochlorothiazide | HYDROCHLOROTHIAZIDE | 31327267 | |
| 1445 | CSK | KINASE, DRUGGABLE GENOME, ENZYME, TYROSINE KINASE | inhibitor | 252827493 | ||
| 1445 | CSK | KINASE, DRUGGABLE GENOME, ENZYME, TYROSINE KINASE | inhibitor | 249565754 | ||
| 1445 | CSK | KINASE, DRUGGABLE GENOME, ENZYME, TYROSINE KINASE | BBI503 | |||
| 1445 | CSK | KINASE, DRUGGABLE GENOME, ENZYME, TYROSINE KINASE | inhibitor | HESPERADIN | HESPERADIN | 19035792 |
| Page: 1 |

Copyright 2023-Present -The University of Texas Health Science Center at Houston |