
|
|||||
|
 | |
| |
| |
| |
| |
| |
|
Gene: CSGALNACT2 |
Gene summary for CSGALNACT2 |
| Gene information | Species | Human | Gene symbol | CSGALNACT2 | Gene ID | 55454 |
| Gene name | chondroitin sulfate N-acetylgalactosaminyltransferase 2 | |
| Gene Alias | CHGN2 | |
| Cytomap | 10q11.21 | |
| Gene Type | protein-coding | GO ID | GO:0000271 | UniProtAcc | A0A0S2Z5K4 |
Top |
Malignant transformation analysis |
| Identification of the aberrant gene expression in precancerous and cancerous lesions by comparing the gene expression of stem-like cells in diseased tissues with normal stem cells |
| Entrez ID | Symbol | Replicates | Species | Organ | Tissue | Adj P-value | Log2FC | Malignancy |
| 55454 | CSGALNACT2 | C04 | Human | Oral cavity | OSCC | 3.98e-08 | 4.28e-01 | 0.2633 |
| 55454 | CSGALNACT2 | C21 | Human | Oral cavity | OSCC | 1.19e-10 | 4.22e-01 | 0.2678 |
| 55454 | CSGALNACT2 | C30 | Human | Oral cavity | OSCC | 9.57e-12 | 6.12e-01 | 0.3055 |
| 55454 | CSGALNACT2 | C43 | Human | Oral cavity | OSCC | 3.30e-05 | 5.01e-02 | 0.1704 |
| 55454 | CSGALNACT2 | C46 | Human | Oral cavity | OSCC | 2.14e-03 | 7.46e-02 | 0.1673 |
| 55454 | CSGALNACT2 | C51 | Human | Oral cavity | OSCC | 1.20e-06 | 2.33e-01 | 0.2674 |
| 55454 | CSGALNACT2 | C06 | Human | Oral cavity | OSCC | 2.84e-04 | 6.61e-01 | 0.2699 |
| 55454 | CSGALNACT2 | C08 | Human | Oral cavity | OSCC | 1.33e-06 | 2.39e-01 | 0.1919 |
| 55454 | CSGALNACT2 | EOLP-1 | Human | Oral cavity | EOLP | 7.12e-19 | 4.63e-01 | -0.0202 |
| 55454 | CSGALNACT2 | EOLP-2 | Human | Oral cavity | EOLP | 3.65e-06 | 2.86e-01 | -0.0203 |
| 55454 | CSGALNACT2 | NEOLP-1 | Human | Oral cavity | NEOLP | 3.90e-09 | 3.52e-01 | -0.0194 |
| 55454 | CSGALNACT2 | NEOLP-2 | Human | Oral cavity | NEOLP | 1.31e-05 | 2.31e-01 | -0.0196 |
| 55454 | CSGALNACT2 | NEOLP-3 | Human | Oral cavity | NEOLP | 3.74e-13 | 3.39e-01 | -0.0191 |
| 55454 | CSGALNACT2 | SYSMH1 | Human | Oral cavity | OSCC | 4.21e-03 | 1.54e-01 | 0.1127 |
| 55454 | CSGALNACT2 | SYSMH2 | Human | Oral cavity | OSCC | 2.49e-04 | 1.09e-01 | 0.2326 |
| 55454 | CSGALNACT2 | SYSMH3 | Human | Oral cavity | OSCC | 1.02e-06 | 1.66e-01 | 0.2442 |
| 55454 | CSGALNACT2 | male-WTA | Human | Thyroid | PTC | 7.17e-10 | 8.88e-02 | 0.1037 |
| 55454 | CSGALNACT2 | PTC01 | Human | Thyroid | PTC | 9.63e-04 | 6.05e-02 | 0.1899 |
| 55454 | CSGALNACT2 | PTC04 | Human | Thyroid | PTC | 3.30e-17 | 3.09e-01 | 0.1927 |
| 55454 | CSGALNACT2 | PTC05 | Human | Thyroid | PTC | 2.13e-08 | 5.35e-01 | 0.2065 |
| Page: 1 2 |
| Tissue | Expression Dynamics | Abbreviation |
| Oral Cavity |  | EOLP: Erosive Oral lichen planus |
| LP: leukoplakia | ||
| NEOLP: Non-erosive oral lichen planus | ||
| OSCC: Oral squamous cell carcinoma | ||
| Thyroid | 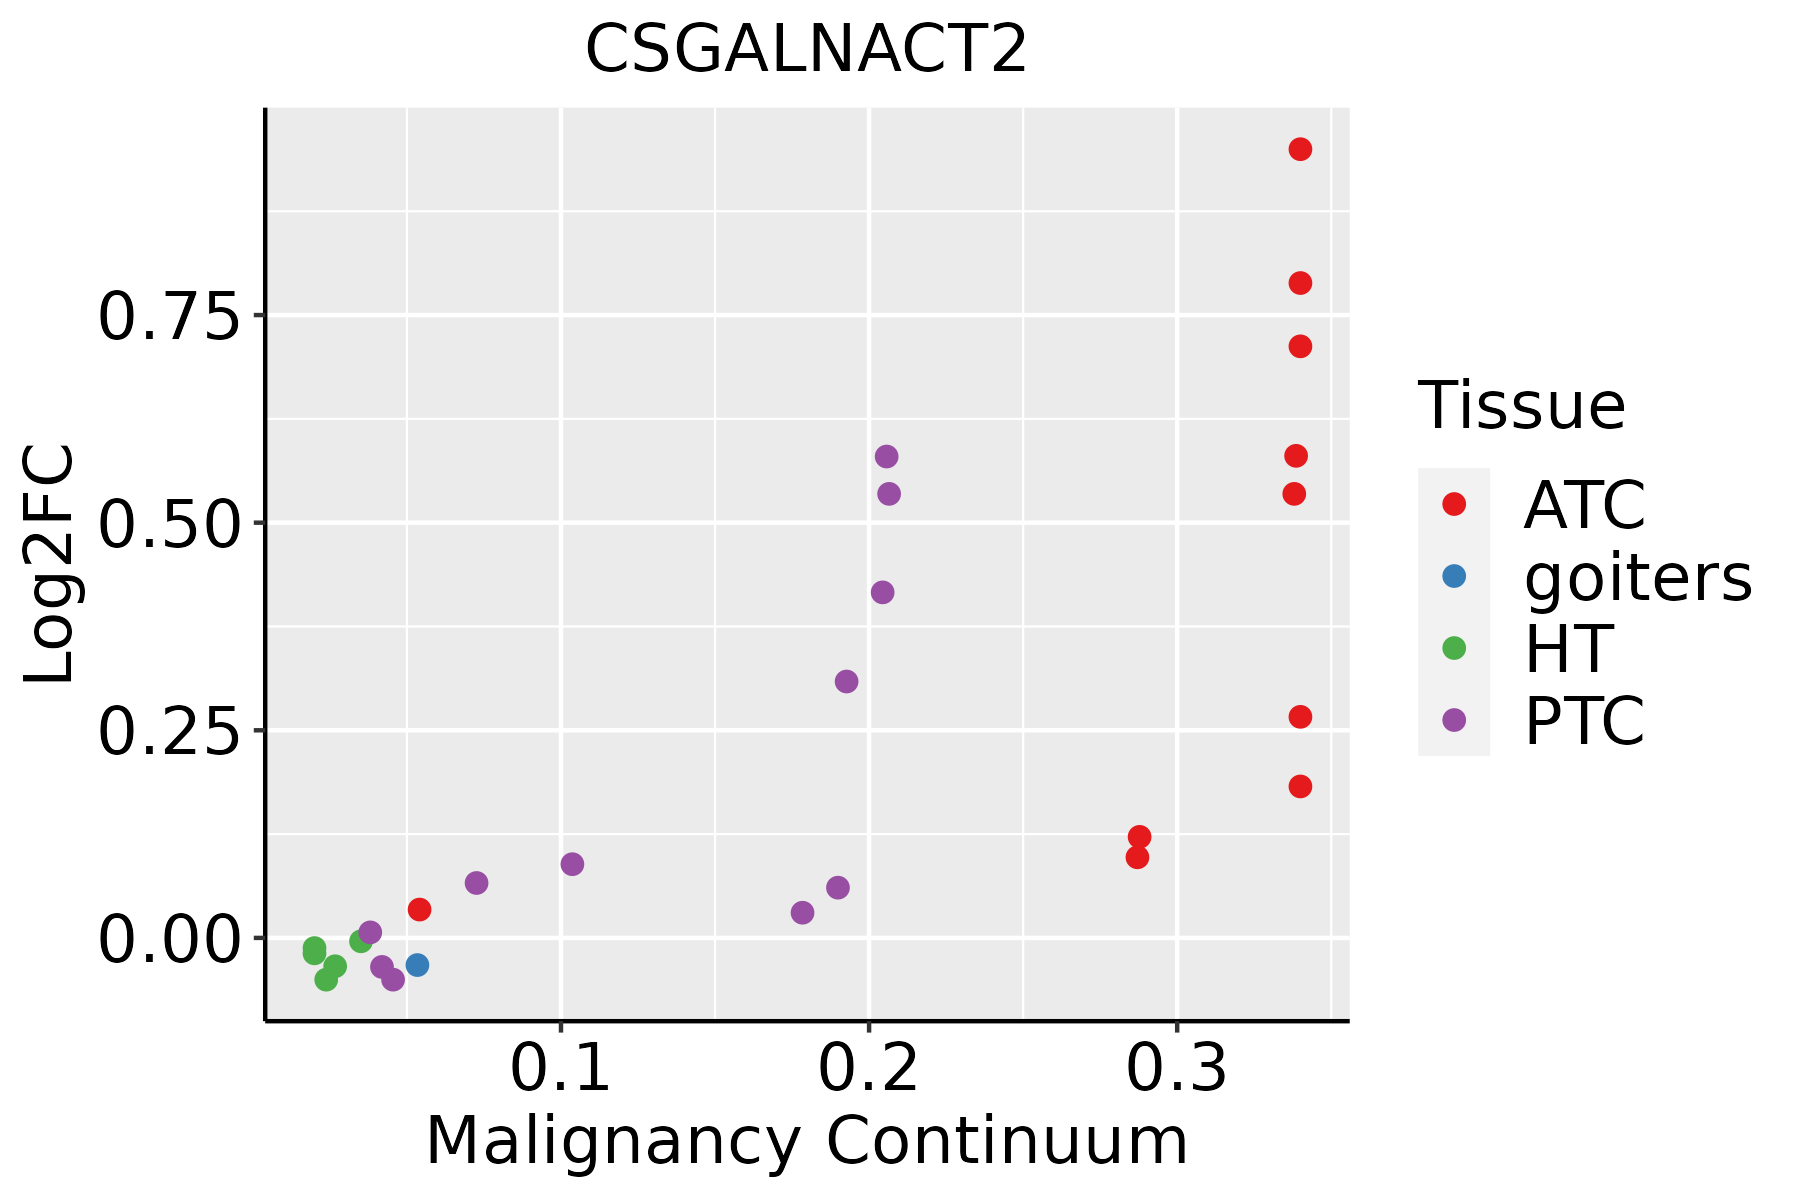 | ATC: Anaplastic thyroid cancer |
| HT: Hashimoto's thyroiditis | ||
| PTC: Papillary thyroid cancer |
| ∗log2FC in expression of this searched gene in stem-like cells from each diseased tissue sample relative to stem-like cells in normal samples in each tissue plotted against the malignancy continuum. Samples are colored based on if they are from different disease stage. |
Top |
Malignant transformation related pathway analysis |
| Find out the enriched GO biological processes and KEGG pathways involved in transition from healthy to precancer to cancer |
| Tissue | Disease Stage | Enriched GO biological Processes |
| Colorectum | AD |  |
| Colorectum | SER |  |
| Colorectum | MSS |  |
| Colorectum | MSI-H |  |
| Colorectum | FAP |  |
| ∗Top 15 enriched GO BP terms are showed in the bar plot of each disease state in each tissue. Each row represents a significant GO biological process which is colored according to the -log10(p.adjust). |
| Page: 1 2 3 4 5 6 7 8 9 |
| GO ID | Tissue | Disease Stage | Description | Gene Ratio | Bg Ratio | pvalue | p.adjust | Count |
| GO:00442724 | Oral cavity | OSCC | sulfur compound biosynthetic process | 82/7305 | 148/18723 | 3.71e-05 | 3.31e-04 | 82 |
| GO:00067905 | Oral cavity | OSCC | sulfur compound metabolic process | 168/7305 | 339/18723 | 4.50e-05 | 3.84e-04 | 168 |
| GO:0030206 | Oral cavity | OSCC | chondroitin sulfate biosynthetic process | 15/7305 | 18/18723 | 1.53e-04 | 1.07e-03 | 15 |
| GO:00091001 | Oral cavity | OSCC | glycoprotein metabolic process | 185/7305 | 387/18723 | 2.37e-04 | 1.54e-03 | 185 |
| GO:00091011 | Oral cavity | OSCC | glycoprotein biosynthetic process | 151/7305 | 317/18723 | 1.01e-03 | 5.26e-03 | 151 |
| GO:0050650 | Oral cavity | OSCC | chondroitin sulfate proteoglycan biosynthetic process | 16/7305 | 23/18723 | 2.93e-03 | 1.27e-02 | 16 |
| GO:00160513 | Oral cavity | OSCC | carbohydrate biosynthetic process | 97/7305 | 202/18723 | 5.50e-03 | 2.13e-02 | 97 |
| GO:0030204 | Oral cavity | OSCC | chondroitin sulfate metabolic process | 19/7305 | 30/18723 | 6.03e-03 | 2.28e-02 | 19 |
| GO:00442625 | Oral cavity | OSCC | cellular carbohydrate metabolic process | 130/7305 | 283/18723 | 9.98e-03 | 3.49e-02 | 130 |
| GO:00442726 | Thyroid | PTC | sulfur compound biosynthetic process | 63/5968 | 148/18723 | 3.91e-03 | 1.87e-02 | 63 |
| GO:00091013 | Thyroid | PTC | glycoprotein biosynthetic process | 123/5968 | 317/18723 | 5.05e-03 | 2.33e-02 | 123 |
| GO:00091003 | Thyroid | PTC | glycoprotein metabolic process | 147/5968 | 387/18723 | 5.87e-03 | 2.64e-02 | 147 |
| GO:004427212 | Thyroid | ATC | sulfur compound biosynthetic process | 66/6293 | 148/18723 | 3.43e-03 | 1.53e-02 | 66 |
| GO:000910011 | Thyroid | ATC | glycoprotein metabolic process | 153/6293 | 387/18723 | 7.90e-03 | 3.06e-02 | 153 |
| Page: 1 |
| Pathway ID | Tissue | Disease Stage | Description | Gene Ratio | Bg Ratio | pvalue | p.adjust | qvalue | Count |
| hsa00532 | Oral cavity | OSCC | Glycosaminoglycan biosynthesis - chondroitin sulfate / dermatan sulfate | 16/3704 | 21/8465 | 2.61e-03 | 6.77e-03 | 3.45e-03 | 16 |
| hsa005321 | Oral cavity | OSCC | Glycosaminoglycan biosynthesis - chondroitin sulfate / dermatan sulfate | 16/3704 | 21/8465 | 2.61e-03 | 6.77e-03 | 3.45e-03 | 16 |
| Page: 1 |
Top |
Cell-cell communication analysis |
| Identification of potential cell-cell interactions between two cell types and their ligand-receptor pairs for different disease states |
| Ligand | Receptor | LRpair | Pathway | Tissue | Disease Stage |
| Page: 1 |
Top |
Single-cell gene regulatory network inference analysis |
| Find out the significant the regulons (TFs) and the target genes of each regulon across cell types for different disease states |
| TF | Cell Type | Tissue | Disease Stage | Target Gene | RSS | Regulon Activity |
| ∗The dot plots of a searched regulon are shown for all cell subpopulations in each disease state of each tissue based on the regulon specific score inferred using pySCENIC and by calculating the average expression. |
| Page: 1 |
Top |
Somatic mutation of malignant transformation related genes |
| Annotation of somatic variants for genes involved in malignant transformation |
| Hugo Symbol | Variant Class | Variant Classification | dbSNP RS | HGVSc | HGVSp | HGVSp Short | SWISSPROT | BIOTYPE | SIFT | PolyPhen | Tumor Sample Barcode | Tissue | Histology | Sex | Age | Stage | Therapy Types | Drugs | Outcome |
| CSGALNACT2 | SNV | Missense_Mutation | novel | c.1123N>A | p.Glu375Lys | p.E375K | Q8N6G5 | protein_coding | tolerated(0.16) | possibly_damaging(0.509) | TCGA-AN-A046-01 | Breast | breast invasive carcinoma | Female | >=65 | I/II | Unknown | Unknown | SD |
| CSGALNACT2 | SNV | Missense_Mutation | rs200474280 | c.389N>G | p.Lys130Arg | p.K130R | Q8N6G5 | protein_coding | tolerated(0.42) | benign(0.01) | TCGA-AR-A24H-01 | Breast | breast invasive carcinoma | Female | >=65 | I/II | Hormone Therapy | tamoxiphen | SD |
| CSGALNACT2 | SNV | Missense_Mutation | c.737G>C | p.Arg246Thr | p.R246T | Q8N6G5 | protein_coding | tolerated(0.28) | possibly_damaging(0.741) | TCGA-B6-A0IK-01 | Breast | breast invasive carcinoma | Female | <65 | III/IV | Unknown | Unknown | PD | |
| CSGALNACT2 | SNV | Missense_Mutation | c.370N>T | p.Leu124Phe | p.L124F | Q8N6G5 | protein_coding | tolerated(0.26) | probably_damaging(0.998) | TCGA-D8-A73U-01 | Breast | breast invasive carcinoma | Female | >=65 | I/II | Hormone Therapy | tamoxiphen | SD | |
| CSGALNACT2 | SNV | Missense_Mutation | novel | c.1613N>T | p.Ser538Ile | p.S538I | Q8N6G5 | protein_coding | deleterious(0) | benign(0.013) | TCGA-EA-A3HU-01 | Cervix | cervical & endocervical cancer | Female | <65 | I/II | Unknown | Unknown | SD |
| CSGALNACT2 | SNV | Missense_Mutation | c.262N>C | p.Glu88Gln | p.E88Q | Q8N6G5 | protein_coding | tolerated(0.12) | benign(0.029) | TCGA-EA-A3QD-01 | Cervix | cervical & endocervical cancer | Female | <65 | III/IV | Chemotherapy | cisplatin | CR | |
| CSGALNACT2 | SNV | Missense_Mutation | novel | c.974N>C | p.Val325Ala | p.V325A | Q8N6G5 | protein_coding | tolerated(0.09) | benign(0.248) | TCGA-VS-A8EI-01 | Cervix | cervical & endocervical cancer | Female | <65 | I/II | Chemotherapy | cisplatin | CR |
| CSGALNACT2 | insertion | Frame_Shift_Ins | novel | c.908_909insTCATCTCA | p.Thr306IlefsTer20 | p.T306Ifs*20 | Q8N6G5 | protein_coding | TCGA-C5-A2LX-01 | Cervix | cervical & endocervical cancer | Female | <65 | I/II | Chemotherapy | cisplatin | SD | ||
| CSGALNACT2 | SNV | Missense_Mutation | novel | c.497N>G | p.His166Arg | p.H166R | Q8N6G5 | protein_coding | tolerated(0.5) | probably_damaging(0.994) | TCGA-AA-3949-01 | Colorectum | colon adenocarcinoma | Female | >=65 | III/IV | Unknown | Unknown | SD |
| CSGALNACT2 | SNV | Missense_Mutation | rs868562419 | c.1217N>T | p.Ala406Val | p.A406V | Q8N6G5 | protein_coding | deleterious(0.01) | possibly_damaging(0.574) | TCGA-AA-3984-01 | Colorectum | colon adenocarcinoma | Female | <65 | I/II | Unknown | Unknown | SD |
| Page: 1 2 3 4 5 6 7 |
Top |
Related drugs of malignant transformation related genes |
| Identification of chemicals and drugs interact with genes involved in malignant transfromation |
| (DGIdb 4.0) |
| Entrez ID | Symbol | Category | Interaction Types | Drug Claim Name | Drug Name | PMIDs |
| Page: 1 |

Copyright 2023-Present -The University of Texas Health Science Center at Houston |