
|
|||||
|
 | |
| |
| |
| |
| |
| |
|
Gene: CSF3 |
Gene summary for CSF3 |
| Gene information | Species | Human | Gene symbol | CSF3 | Gene ID | 1440 |
| Gene name | colony stimulating factor 3 | |
| Gene Alias | C17orf33 | |
| Cytomap | 17q21.1 | |
| Gene Type | protein-coding | GO ID | GO:0001932 | UniProtAcc | P09919 |
Top |
Malignant transformation analysis |
| Identification of the aberrant gene expression in precancerous and cancerous lesions by comparing the gene expression of stem-like cells in diseased tissues with normal stem cells |
| Entrez ID | Symbol | Replicates | Species | Organ | Tissue | Adj P-value | Log2FC | Malignancy |
| 1440 | CSF3 | P8T-E | Human | Esophagus | ESCC | 1.80e-08 | 6.85e-01 | 0.0889 |
| 1440 | CSF3 | P42T-E | Human | Esophagus | ESCC | 5.87e-05 | 7.27e-01 | 0.1175 |
| 1440 | CSF3 | P52T-E | Human | Esophagus | ESCC | 3.09e-07 | 9.09e-01 | 0.1555 |
| 1440 | CSF3 | P83T-E | Human | Esophagus | ESCC | 1.97e-10 | 2.88e+00 | 0.1738 |
| 1440 | CSF3 | P89T-E | Human | Esophagus | ESCC | 8.62e-14 | 2.94e+00 | 0.1752 |
| 1440 | CSF3 | C21 | Human | Oral cavity | OSCC | 6.46e-15 | 1.64e+00 | 0.2678 |
| Page: 1 |
| Tissue | Expression Dynamics | Abbreviation |
| Esophagus | 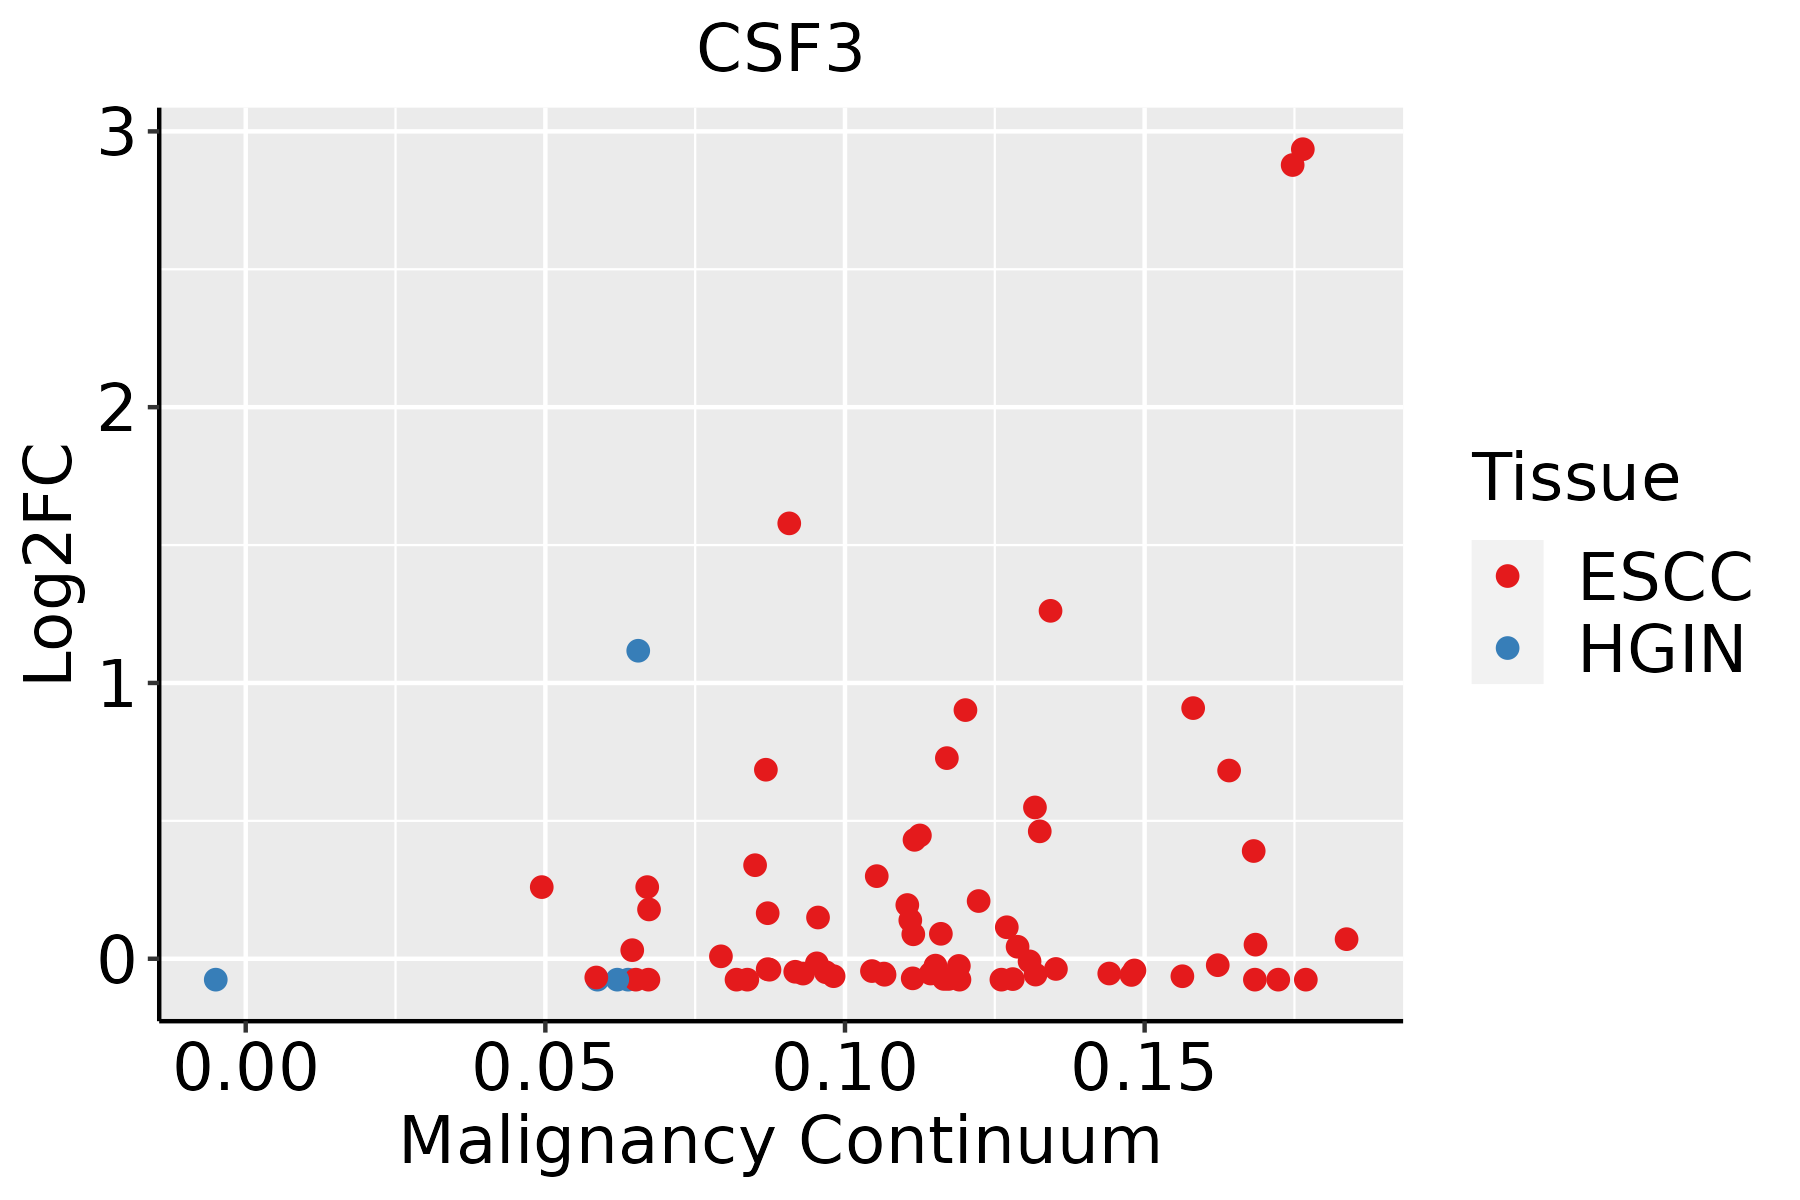 | ESCC: Esophageal squamous cell carcinoma |
| HGIN: High-grade intraepithelial neoplasias | ||
| LGIN: Low-grade intraepithelial neoplasias | ||
| Oral Cavity | 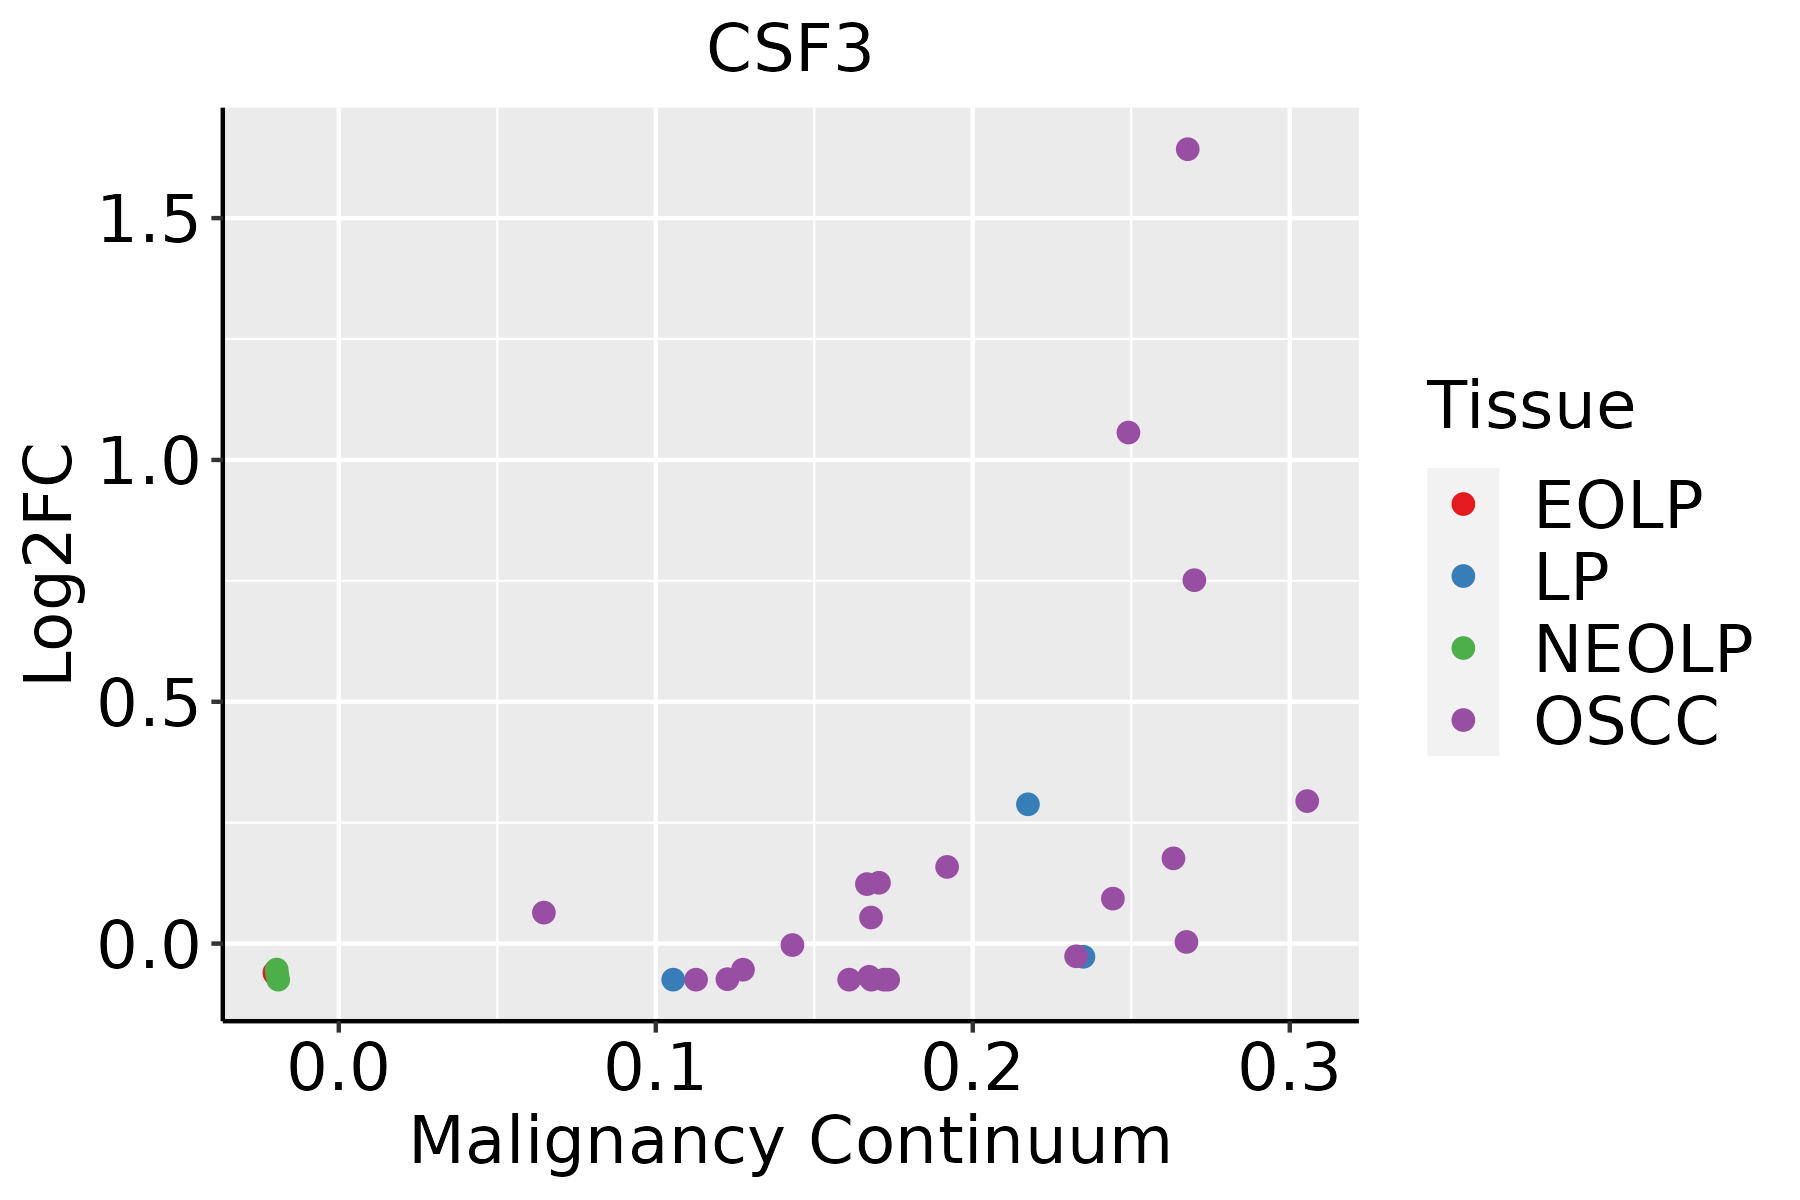 | EOLP: Erosive Oral lichen planus |
| LP: leukoplakia | ||
| NEOLP: Non-erosive oral lichen planus | ||
| OSCC: Oral squamous cell carcinoma |
| ∗log2FC in expression of this searched gene in stem-like cells from each diseased tissue sample relative to stem-like cells in normal samples in each tissue plotted against the malignancy continuum. Samples are colored based on if they are from different disease stage. |
Top |
Malignant transformation related pathway analysis |
| Find out the enriched GO biological processes and KEGG pathways involved in transition from healthy to precancer to cancer |
| Tissue | Disease Stage | Enriched GO biological Processes |
| Colorectum | AD |  |
| Colorectum | SER |  |
| Colorectum | MSS |  |
| Colorectum | MSI-H |  |
| Colorectum | FAP |  |
| ∗Top 15 enriched GO BP terms are showed in the bar plot of each disease state in each tissue. Each row represents a significant GO biological process which is colored according to the -log10(p.adjust). |
| Page: 1 2 3 4 5 6 7 8 9 |
| GO ID | Tissue | Disease Stage | Description | Gene Ratio | Bg Ratio | pvalue | p.adjust | Count |
| GO:0051098111 | Esophagus | ESCC | regulation of binding | 251/8552 | 363/18723 | 6.73e-20 | 8.46e-18 | 251 |
| GO:0043254111 | Esophagus | ESCC | regulation of protein-containing complex assembly | 278/8552 | 428/18723 | 3.81e-16 | 2.77e-14 | 278 |
| GO:0031334111 | Esophagus | ESCC | positive regulation of protein-containing complex assembly | 166/8552 | 237/18723 | 2.06e-14 | 1.07e-12 | 166 |
| GO:0051099111 | Esophagus | ESCC | positive regulation of binding | 122/8552 | 173/18723 | 2.79e-11 | 9.45e-10 | 122 |
| GO:004339320 | Esophagus | ESCC | regulation of protein binding | 135/8552 | 196/18723 | 3.69e-11 | 1.22e-09 | 135 |
| GO:1902905111 | Esophagus | ESCC | positive regulation of supramolecular fiber organization | 142/8552 | 209/18723 | 5.51e-11 | 1.76e-09 | 142 |
| GO:1902903111 | Esophagus | ESCC | regulation of supramolecular fiber organization | 237/8552 | 383/18723 | 9.06e-11 | 2.75e-09 | 237 |
| GO:0030099111 | Esophagus | ESCC | myeloid cell differentiation | 232/8552 | 381/18723 | 1.22e-09 | 2.90e-08 | 232 |
| GO:005149520 | Esophagus | ESCC | positive regulation of cytoskeleton organization | 147/8552 | 226/18723 | 2.93e-09 | 6.38e-08 | 147 |
| GO:0006753110 | Esophagus | ESCC | nucleoside phosphate metabolic process | 288/8552 | 497/18723 | 1.80e-08 | 3.50e-07 | 288 |
| GO:0051258111 | Esophagus | ESCC | protein polymerization | 183/8552 | 297/18723 | 1.94e-08 | 3.75e-07 | 183 |
| GO:000701527 | Esophagus | ESCC | actin filament organization | 259/8552 | 442/18723 | 2.37e-08 | 4.50e-07 | 259 |
| GO:0032273111 | Esophagus | ESCC | positive regulation of protein polymerization | 95/8552 | 138/18723 | 2.97e-08 | 5.57e-07 | 95 |
| GO:0070997111 | Esophagus | ESCC | neuron death | 216/8552 | 361/18723 | 3.49e-08 | 6.45e-07 | 216 |
| GO:0019693111 | Esophagus | ESCC | ribose phosphate metabolic process | 234/8552 | 396/18723 | 4.24e-08 | 7.76e-07 | 234 |
| GO:0009117111 | Esophagus | ESCC | nucleotide metabolic process | 282/8552 | 489/18723 | 4.70e-08 | 8.50e-07 | 282 |
| GO:003253520 | Esophagus | ESCC | regulation of cellular component size | 227/8552 | 383/18723 | 4.77e-08 | 8.60e-07 | 227 |
| GO:00067906 | Esophagus | ESCC | sulfur compound metabolic process | 201/8552 | 339/18723 | 2.64e-07 | 3.94e-06 | 201 |
| GO:0032970111 | Esophagus | ESCC | regulation of actin filament-based process | 231/8552 | 397/18723 | 2.91e-07 | 4.20e-06 | 231 |
| GO:0032956111 | Esophagus | ESCC | regulation of actin cytoskeleton organization | 210/8552 | 358/18723 | 4.40e-07 | 6.00e-06 | 210 |
| Page: 1 2 3 4 5 6 7 8 9 10 11 |
| Pathway ID | Tissue | Disease Stage | Description | Gene Ratio | Bg Ratio | pvalue | p.adjust | qvalue | Count |
| hsa05171211 | Esophagus | ESCC | Coronavirus disease - COVID-19 | 156/4205 | 232/8465 | 3.18e-08 | 2.68e-07 | 1.37e-07 | 156 |
| hsa0465727 | Esophagus | ESCC | IL-17 signaling pathway | 66/4205 | 94/8465 | 3.93e-05 | 1.75e-04 | 8.99e-05 | 66 |
| hsa041517 | Esophagus | ESCC | PI3K-Akt signaling pathway | 197/4205 | 354/8465 | 1.24e-02 | 2.83e-02 | 1.45e-02 | 197 |
| hsa05171310 | Esophagus | ESCC | Coronavirus disease - COVID-19 | 156/4205 | 232/8465 | 3.18e-08 | 2.68e-07 | 1.37e-07 | 156 |
| hsa0465734 | Esophagus | ESCC | IL-17 signaling pathway | 66/4205 | 94/8465 | 3.93e-05 | 1.75e-04 | 8.99e-05 | 66 |
| hsa0415114 | Esophagus | ESCC | PI3K-Akt signaling pathway | 197/4205 | 354/8465 | 1.24e-02 | 2.83e-02 | 1.45e-02 | 197 |
| hsa0517130 | Oral cavity | OSCC | Coronavirus disease - COVID-19 | 156/3704 | 232/8465 | 2.30e-13 | 5.14e-12 | 2.62e-12 | 156 |
| hsa0465724 | Oral cavity | OSCC | IL-17 signaling pathway | 64/3704 | 94/8465 | 1.48e-06 | 7.87e-06 | 4.01e-06 | 64 |
| hsa041516 | Oral cavity | OSCC | PI3K-Akt signaling pathway | 185/3704 | 354/8465 | 6.26e-04 | 1.86e-03 | 9.49e-04 | 185 |
| hsa05171114 | Oral cavity | OSCC | Coronavirus disease - COVID-19 | 156/3704 | 232/8465 | 2.30e-13 | 5.14e-12 | 2.62e-12 | 156 |
| hsa04657112 | Oral cavity | OSCC | IL-17 signaling pathway | 64/3704 | 94/8465 | 1.48e-06 | 7.87e-06 | 4.01e-06 | 64 |
| hsa0415113 | Oral cavity | OSCC | PI3K-Akt signaling pathway | 185/3704 | 354/8465 | 6.26e-04 | 1.86e-03 | 9.49e-04 | 185 |
| Page: 1 |
Top |
Cell-cell communication analysis |
| Identification of potential cell-cell interactions between two cell types and their ligand-receptor pairs for different disease states |
| Ligand | Receptor | LRpair | Pathway | Tissue | Disease Stage |
| CSF3 | CSF3R | CSF3_CSF3R | CSF3 | Breast | Healthy |
| CSF3 | CSF3R | CSF3_CSF3R | CSF3 | Cervix | ADJ |
| CSF3 | CSF3R | CSF3_CSF3R | CSF3 | Cervix | CC |
| CSF3 | CSF3R | CSF3_CSF3R | CSF3 | Cervix | Healthy |
| CSF3 | CSF3R | CSF3_CSF3R | CSF3 | Endometrium | EEC |
| CSF3 | CSF3R | CSF3_CSF3R | CSF3 | Esophagus | ESCC |
| CSF3 | CSF3R | CSF3_CSF3R | CSF3 | HNSCC | ADJ |
| CSF3 | CSF3R | CSF3_CSF3R | CSF3 | HNSCC | OSCC |
| CSF3 | CSF3R | CSF3_CSF3R | CSF3 | HNSCC | Precancer |
| CSF3 | CSF3R | CSF3_CSF3R | CSF3 | Prostate | BPH |
| CSF3 | CSF3R | CSF3_CSF3R | CSF3 | Prostate | Healthy |
| Page: 1 |
Top |
Single-cell gene regulatory network inference analysis |
| Find out the significant the regulons (TFs) and the target genes of each regulon across cell types for different disease states |
| TF | Cell Type | Tissue | Disease Stage | Target Gene | RSS | Regulon Activity |
| ∗The dot plots of a searched regulon are shown for all cell subpopulations in each disease state of each tissue based on the regulon specific score inferred using pySCENIC and by calculating the average expression. |
| Page: 1 |
Top |
Somatic mutation of malignant transformation related genes |
| Annotation of somatic variants for genes involved in malignant transformation |
| Hugo Symbol | Variant Class | Variant Classification | dbSNP RS | HGVSc | HGVSp | HGVSp Short | SWISSPROT | BIOTYPE | SIFT | PolyPhen | Tumor Sample Barcode | Tissue | Histology | Sex | Age | Stage | Therapy Types | Drugs | Outcome |
| CSF3 | SNV | Missense_Mutation | novel | c.339N>G | p.Ser113Arg | p.S113R | P09919 | protein_coding | tolerated(0.42) | benign(0.019) | TCGA-A2-A4S3-01 | Breast | breast invasive carcinoma | Female | <65 | I/II | Unknown | Unknown | SD |
| CSF3 | SNV | Missense_Mutation | novel | c.598G>A | p.Val200Ile | p.V200I | P09919 | protein_coding | tolerated(0.1) | benign(0.023) | TCGA-A7-A6VX-01 | Breast | breast invasive carcinoma | Female | >=65 | I/II | Chemotherapy | docetaxel | CR |
| CSF3 | SNV | Missense_Mutation | c.233A>G | p.Glu78Gly | p.E78G | P09919 | protein_coding | deleterious(0) | possibly_damaging(0.863) | TCGA-BH-A1EV-01 | Breast | breast invasive carcinoma | Female | <65 | III/IV | Unknown | Unknown | PD | |
| CSF3 | SNV | Missense_Mutation | rs543073657 | c.115C>G | p.Leu39Val | p.L39V | P09919 | protein_coding | tolerated(0.52) | benign(0.239) | TCGA-C8-A3M7-01 | Breast | breast invasive carcinoma | Female | <65 | III/IV | Unknown | Unknown | PD |
| CSF3 | SNV | Missense_Mutation | novel | c.269N>A | p.Pro90His | p.P90H | P09919 | protein_coding | deleterious(0.02) | probably_damaging(0.964) | TCGA-AA-3950-01 | Colorectum | colon adenocarcinoma | Female | >=65 | I/II | Unknown | Unknown | SD |
| CSF3 | SNV | Missense_Mutation | c.356N>G | p.Gln119Arg | p.Q119R | P09919 | protein_coding | tolerated(0.18) | benign(0.026) | TCGA-CM-4743-01 | Colorectum | colon adenocarcinoma | Male | >=65 | I/II | Chemotherapy | capecitabine | SD | |
| CSF3 | SNV | Missense_Mutation | rs190847104 | c.539N>A | p.Arg180Gln | p.R180Q | P09919 | protein_coding | tolerated(0.68) | benign(0.037) | TCGA-EI-6507-01 | Colorectum | rectum adenocarcinoma | Male | <65 | I/II | Unknown | Unknown | SD |
| CSF3 | SNV | Missense_Mutation | novel | c.598N>A | p.Val200Ile | p.V200I | P09919 | protein_coding | tolerated(0.1) | benign(0.023) | TCGA-A5-A1OF-01 | Endometrium | uterine corpus endometrioid carcinoma | Female | <65 | I/II | Unknown | Unknown | SD |
| CSF3 | SNV | Missense_Mutation | c.563C>G | p.Ser188Cys | p.S188C | P09919 | protein_coding | deleterious(0.01) | probably_damaging(0.976) | TCGA-AX-A05T-01 | Endometrium | uterine corpus endometrioid carcinoma | Female | >=65 | I/II | Unknown | Unknown | SD | |
| CSF3 | SNV | Missense_Mutation | rs757845157 | c.250N>A | p.Gly84Arg | p.G84R | P09919 | protein_coding | tolerated(0.82) | possibly_damaging(0.768) | TCGA-AX-A3FT-01 | Endometrium | uterine corpus endometrioid carcinoma | Female | <65 | I/II | Unknown | Unknown | SD |
| Page: 1 2 |
Top |
Related drugs of malignant transformation related genes |
| Identification of chemicals and drugs interact with genes involved in malignant transfromation |
| (DGIdb 4.0) |
| Entrez ID | Symbol | Category | Interaction Types | Drug Claim Name | Drug Name | PMIDs |
| 1440 | CSF3 | GROWTH FACTOR, DRUGGABLE GENOME | TALABOSTAT | TALABOSTAT | ||
| 1440 | CSF3 | GROWTH FACTOR, DRUGGABLE GENOME | Interleukin-3 | MUPLESTIM | ||
| 1440 | CSF3 | GROWTH FACTOR, DRUGGABLE GENOME | F-627 | BENEGRASTIM | ||
| 1440 | CSF3 | GROWTH FACTOR, DRUGGABLE GENOME | MK-4214 | |||
| 1440 | CSF3 | GROWTH FACTOR, DRUGGABLE GENOME | DA-3031 | |||
| 1440 | CSF3 | GROWTH FACTOR, DRUGGABLE GENOME | SPI-2012 | EFLAPEGRASTIM | ||
| 1440 | CSF3 | GROWTH FACTOR, DRUGGABLE GENOME | Neugranin | 25535738 | ||
| 1440 | CSF3 | GROWTH FACTOR, DRUGGABLE GENOME | LA-EP2006 |
| Page: 1 |

Copyright 2023-Present -The University of Texas Health Science Center at Houston |