
|
|||||
|
 | |
| |
| |
| |
| |
| |
|
Gene: CSF2 |
Gene summary for CSF2 |
| Gene information | Species | Human | Gene symbol | CSF2 | Gene ID | 1437 |
| Gene name | colony stimulating factor 2 | |
| Gene Alias | CSF | |
| Cytomap | 5q31.1 | |
| Gene Type | protein-coding | GO ID | GO:0000003 | UniProtAcc | P04141 |
Top |
Malignant transformation analysis |
| Identification of the aberrant gene expression in precancerous and cancerous lesions by comparing the gene expression of stem-like cells in diseased tissues with normal stem cells |
| Entrez ID | Symbol | Replicates | Species | Organ | Tissue | Adj P-value | Log2FC | Malignancy |
| 1437 | CSF2 | LZE6T | Human | Esophagus | ESCC | 1.62e-02 | 1.39e-01 | 0.0845 |
| 1437 | CSF2 | P11T-E | Human | Esophagus | ESCC | 1.13e-06 | 1.45e+00 | 0.1426 |
| 1437 | CSF2 | P21T-E | Human | Esophagus | ESCC | 2.06e-08 | 4.68e-01 | 0.1617 |
| 1437 | CSF2 | P37T-E | Human | Esophagus | ESCC | 8.12e-03 | 2.66e-01 | 0.1371 |
| 1437 | CSF2 | P52T-E | Human | Esophagus | ESCC | 1.85e-18 | 1.52e+00 | 0.1555 |
| 1437 | CSF2 | P83T-E | Human | Esophagus | ESCC | 9.80e-07 | 8.67e-01 | 0.1738 |
| 1437 | CSF2 | P89T-E | Human | Esophagus | ESCC | 5.72e-07 | 1.46e+00 | 0.1752 |
| 1437 | CSF2 | P126T-E | Human | Esophagus | ESCC | 5.94e-06 | 8.18e-01 | 0.1125 |
| 1437 | CSF2 | C04 | Human | Oral cavity | OSCC | 1.70e-10 | 1.09e+00 | 0.2633 |
| 1437 | CSF2 | C21 | Human | Oral cavity | OSCC | 4.89e-07 | 6.64e-01 | 0.2678 |
| Page: 1 |
| Tissue | Expression Dynamics | Abbreviation |
| Esophagus | 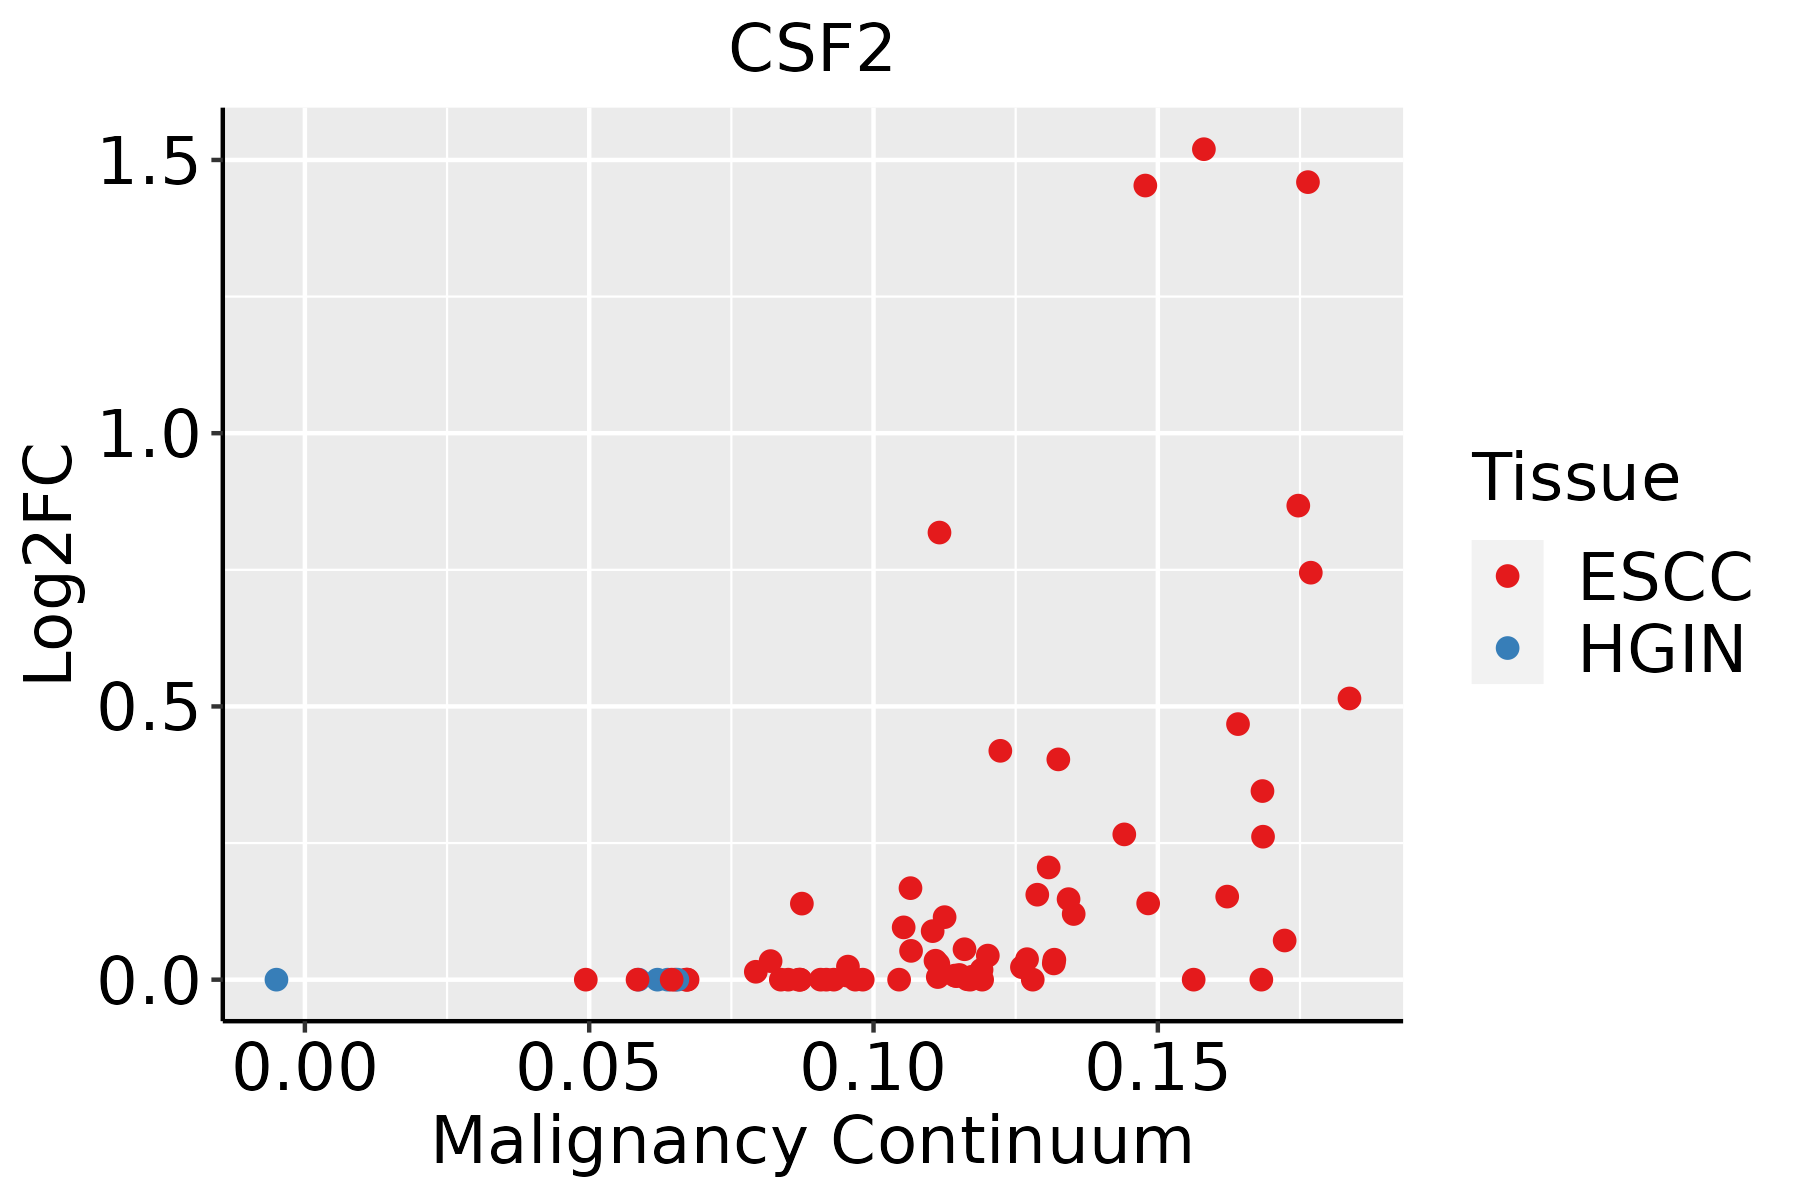 | ESCC: Esophageal squamous cell carcinoma |
| HGIN: High-grade intraepithelial neoplasias | ||
| LGIN: Low-grade intraepithelial neoplasias | ||
| Oral Cavity | 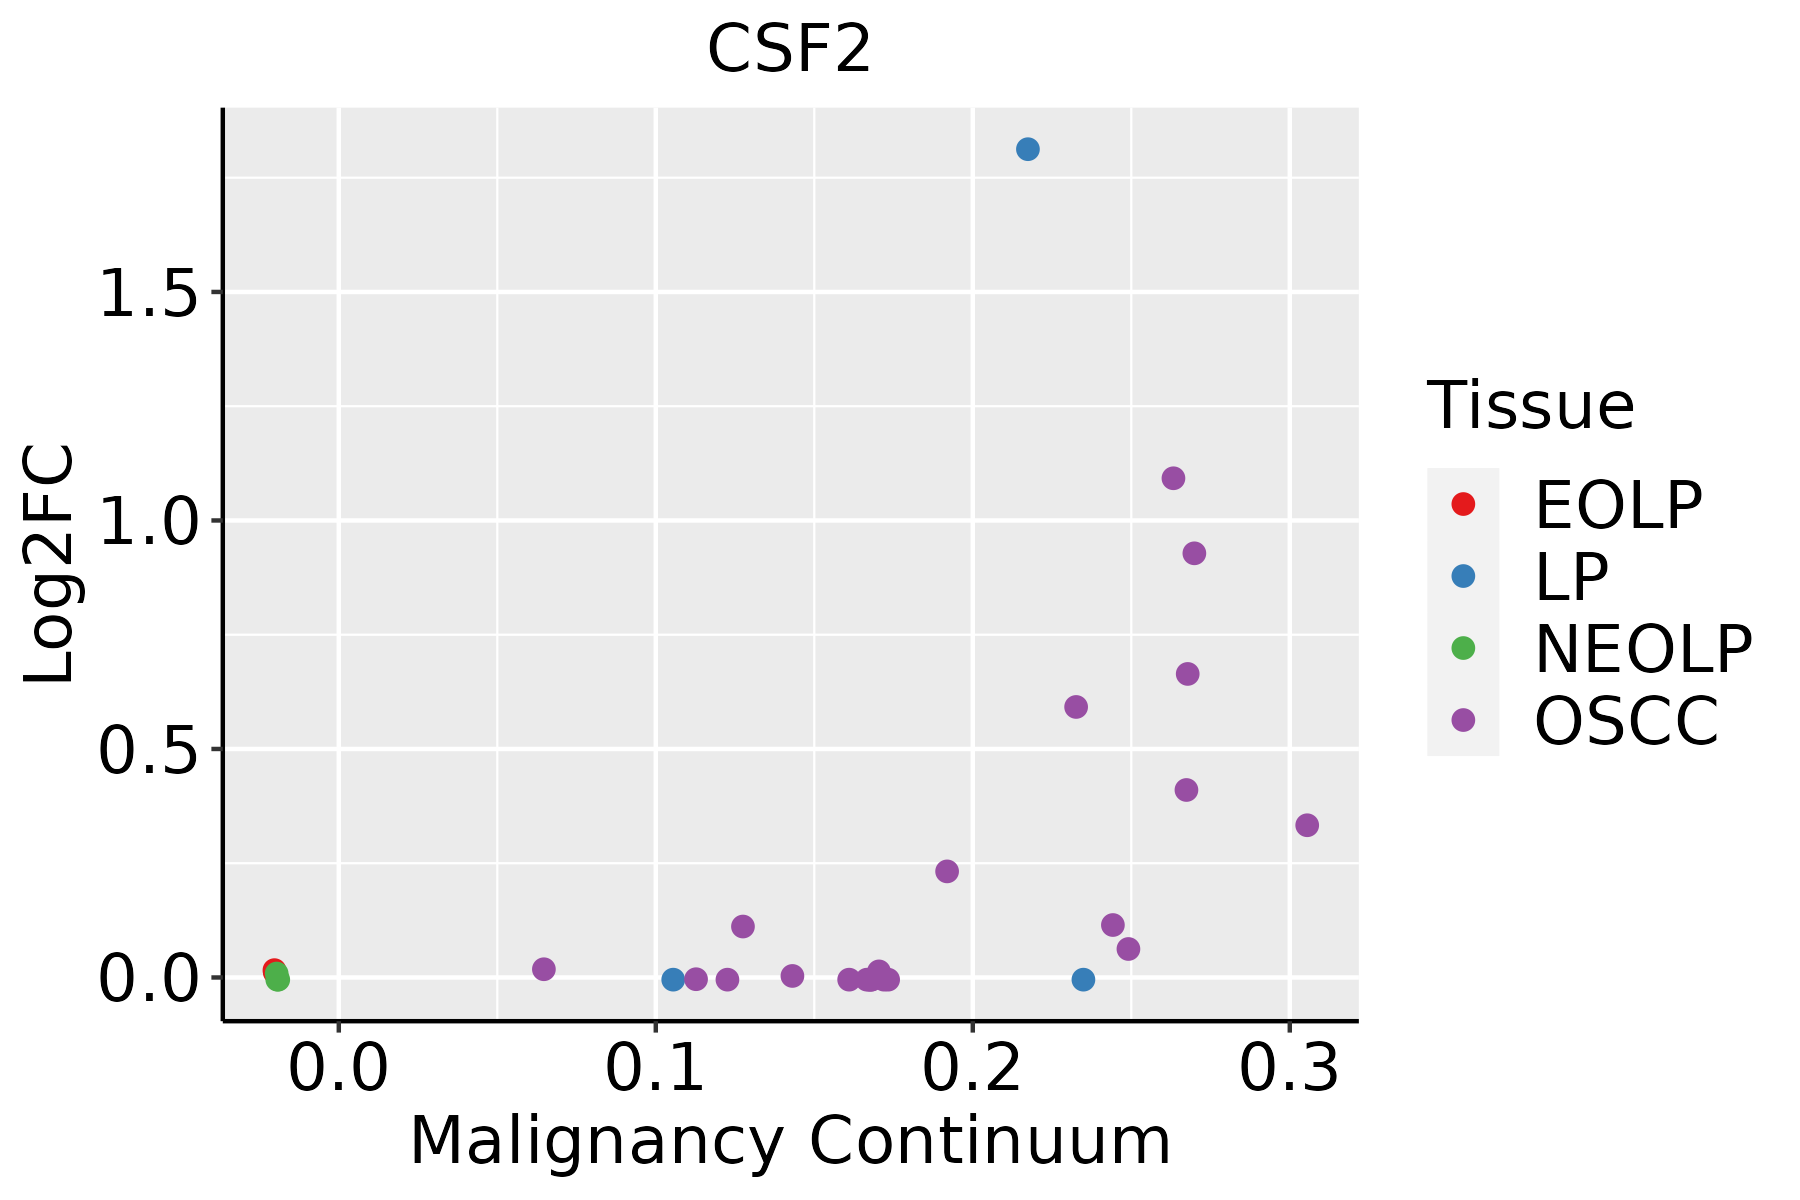 | EOLP: Erosive Oral lichen planus |
| LP: leukoplakia | ||
| NEOLP: Non-erosive oral lichen planus | ||
| OSCC: Oral squamous cell carcinoma |
| ∗log2FC in expression of this searched gene in stem-like cells from each diseased tissue sample relative to stem-like cells in normal samples in each tissue plotted against the malignancy continuum. Samples are colored based on if they are from different disease stage. |
Top |
Malignant transformation related pathway analysis |
| Find out the enriched GO biological processes and KEGG pathways involved in transition from healthy to precancer to cancer |
| Tissue | Disease Stage | Enriched GO biological Processes |
| Colorectum | AD |  |
| Colorectum | SER |  |
| Colorectum | MSS |  |
| Colorectum | MSI-H |  |
| Colorectum | FAP |  |
| ∗Top 15 enriched GO BP terms are showed in the bar plot of each disease state in each tissue. Each row represents a significant GO biological process which is colored according to the -log10(p.adjust). |
| Page: 1 2 3 4 5 6 7 8 9 |
| GO ID | Tissue | Disease Stage | Description | Gene Ratio | Bg Ratio | pvalue | p.adjust | Count |
| GO:0009150 | Colorectum | AD | purine ribonucleotide metabolic process | 142/3918 | 368/18723 | 4.29e-15 | 1.17e-12 | 142 |
| GO:0006163 | Colorectum | AD | purine nucleotide metabolic process | 149/3918 | 396/18723 | 1.08e-14 | 2.80e-12 | 149 |
| GO:0072521 | Colorectum | AD | purine-containing compound metabolic process | 153/3918 | 416/18723 | 4.34e-14 | 1.01e-11 | 153 |
| GO:0009259 | Colorectum | AD | ribonucleotide metabolic process | 144/3918 | 385/18723 | 5.25e-14 | 1.13e-11 | 144 |
| GO:0019693 | Colorectum | AD | ribose phosphate metabolic process | 145/3918 | 396/18723 | 3.01e-13 | 5.71e-11 | 145 |
| GO:0009117 | Colorectum | AD | nucleotide metabolic process | 168/3918 | 489/18723 | 2.20e-12 | 3.36e-10 | 168 |
| GO:0006753 | Colorectum | AD | nucleoside phosphate metabolic process | 169/3918 | 497/18723 | 4.99e-12 | 6.98e-10 | 169 |
| GO:0006631 | Colorectum | AD | fatty acid metabolic process | 114/3918 | 390/18723 | 5.58e-05 | 9.44e-04 | 114 |
| GO:0006790 | Colorectum | AD | sulfur compound metabolic process | 101/3918 | 339/18723 | 6.46e-05 | 1.07e-03 | 101 |
| GO:0033865 | Colorectum | AD | nucleoside bisphosphate metabolic process | 42/3918 | 128/18723 | 1.12e-03 | 1.02e-02 | 42 |
| GO:0033875 | Colorectum | AD | ribonucleoside bisphosphate metabolic process | 42/3918 | 128/18723 | 1.12e-03 | 1.02e-02 | 42 |
| GO:0034032 | Colorectum | AD | purine nucleoside bisphosphate metabolic process | 42/3918 | 128/18723 | 1.12e-03 | 1.02e-02 | 42 |
| GO:00091504 | Colorectum | FAP | purine ribonucleotide metabolic process | 96/2622 | 368/18723 | 4.91e-10 | 1.20e-07 | 96 |
| GO:00061634 | Colorectum | FAP | purine nucleotide metabolic process | 100/2622 | 396/18723 | 1.45e-09 | 2.77e-07 | 100 |
| GO:00092593 | Colorectum | FAP | ribonucleotide metabolic process | 97/2622 | 385/18723 | 2.90e-09 | 5.07e-07 | 97 |
| GO:00725214 | Colorectum | FAP | purine-containing compound metabolic process | 101/2622 | 416/18723 | 1.11e-08 | 1.33e-06 | 101 |
| GO:00196933 | Colorectum | FAP | ribose phosphate metabolic process | 97/2622 | 396/18723 | 1.35e-08 | 1.51e-06 | 97 |
| GO:00091174 | Colorectum | FAP | nucleotide metabolic process | 105/2622 | 489/18723 | 3.52e-06 | 1.25e-04 | 105 |
| GO:00067534 | Colorectum | FAP | nucleoside phosphate metabolic process | 105/2622 | 497/18723 | 7.47e-06 | 2.25e-04 | 105 |
| GO:00066313 | Colorectum | FAP | fatty acid metabolic process | 81/2622 | 390/18723 | 1.43e-04 | 2.24e-03 | 81 |
| Page: 1 2 3 4 5 6 7 |
| Pathway ID | Tissue | Disease Stage | Description | Gene Ratio | Bg Ratio | pvalue | p.adjust | qvalue | Count |
| hsa05166211 | Esophagus | ESCC | Human T-cell leukemia virus 1 infection | 164/4205 | 222/8465 | 8.13e-14 | 2.09e-12 | 1.07e-12 | 164 |
| hsa05131211 | Esophagus | ESCC | Shigellosis | 176/4205 | 247/8465 | 2.27e-12 | 4.01e-11 | 2.05e-11 | 176 |
| hsa0466810 | Esophagus | ESCC | TNF signaling pathway | 89/4205 | 114/8465 | 3.36e-10 | 4.01e-09 | 2.06e-09 | 89 |
| hsa05167211 | Esophagus | ESCC | Kaposi sarcoma-associated herpesvirus infection | 136/4205 | 194/8465 | 4.28e-09 | 4.22e-08 | 2.16e-08 | 136 |
| hsa05171211 | Esophagus | ESCC | Coronavirus disease - COVID-19 | 156/4205 | 232/8465 | 3.18e-08 | 2.68e-07 | 1.37e-07 | 156 |
| hsa0465727 | Esophagus | ESCC | IL-17 signaling pathway | 66/4205 | 94/8465 | 3.93e-05 | 1.75e-04 | 8.99e-05 | 66 |
| hsa052215 | Esophagus | ESCC | Acute myeloid leukemia | 49/4205 | 67/8465 | 7.43e-05 | 3.07e-04 | 1.57e-04 | 49 |
| hsa052028 | Esophagus | ESCC | Transcriptional misregulation in cancer | 116/4205 | 193/8465 | 2.08e-03 | 5.95e-03 | 3.05e-03 | 116 |
| hsa0532320 | Esophagus | ESCC | Rheumatoid arthritis | 59/4205 | 93/8465 | 4.98e-03 | 1.27e-02 | 6.52e-03 | 59 |
| hsa05166310 | Esophagus | ESCC | Human T-cell leukemia virus 1 infection | 164/4205 | 222/8465 | 8.13e-14 | 2.09e-12 | 1.07e-12 | 164 |
| hsa05131310 | Esophagus | ESCC | Shigellosis | 176/4205 | 247/8465 | 2.27e-12 | 4.01e-11 | 2.05e-11 | 176 |
| hsa0466817 | Esophagus | ESCC | TNF signaling pathway | 89/4205 | 114/8465 | 3.36e-10 | 4.01e-09 | 2.06e-09 | 89 |
| hsa0516738 | Esophagus | ESCC | Kaposi sarcoma-associated herpesvirus infection | 136/4205 | 194/8465 | 4.28e-09 | 4.22e-08 | 2.16e-08 | 136 |
| hsa05171310 | Esophagus | ESCC | Coronavirus disease - COVID-19 | 156/4205 | 232/8465 | 3.18e-08 | 2.68e-07 | 1.37e-07 | 156 |
| hsa0465734 | Esophagus | ESCC | IL-17 signaling pathway | 66/4205 | 94/8465 | 3.93e-05 | 1.75e-04 | 8.99e-05 | 66 |
| hsa0522113 | Esophagus | ESCC | Acute myeloid leukemia | 49/4205 | 67/8465 | 7.43e-05 | 3.07e-04 | 1.57e-04 | 49 |
| hsa0520213 | Esophagus | ESCC | Transcriptional misregulation in cancer | 116/4205 | 193/8465 | 2.08e-03 | 5.95e-03 | 3.05e-03 | 116 |
| hsa05323110 | Esophagus | ESCC | Rheumatoid arthritis | 59/4205 | 93/8465 | 4.98e-03 | 1.27e-02 | 6.52e-03 | 59 |
| hsa0517130 | Oral cavity | OSCC | Coronavirus disease - COVID-19 | 156/3704 | 232/8465 | 2.30e-13 | 5.14e-12 | 2.62e-12 | 156 |
| hsa0516630 | Oral cavity | OSCC | Human T-cell leukemia virus 1 infection | 150/3704 | 222/8465 | 3.68e-13 | 7.26e-12 | 3.70e-12 | 150 |
| Page: 1 2 |
Top |
Cell-cell communication analysis |
| Identification of potential cell-cell interactions between two cell types and their ligand-receptor pairs for different disease states |
| Ligand | Receptor | LRpair | Pathway | Tissue | Disease Stage |
| CSF2 | CSF2RA_CSF2RB | CSF2_CSF2RA_CSF2RB | IL4 | HNSCC | OSCC |
| Page: 1 |
Top |
Single-cell gene regulatory network inference analysis |
| Find out the significant the regulons (TFs) and the target genes of each regulon across cell types for different disease states |
| TF | Cell Type | Tissue | Disease Stage | Target Gene | RSS | Regulon Activity |
| ∗The dot plots of a searched regulon are shown for all cell subpopulations in each disease state of each tissue based on the regulon specific score inferred using pySCENIC and by calculating the average expression. |
| Page: 1 |
Top |
Somatic mutation of malignant transformation related genes |
| Annotation of somatic variants for genes involved in malignant transformation |
| Hugo Symbol | Variant Class | Variant Classification | dbSNP RS | HGVSc | HGVSp | HGVSp Short | SWISSPROT | BIOTYPE | SIFT | PolyPhen | Tumor Sample Barcode | Tissue | Histology | Sex | Age | Stage | Therapy Types | Drugs | Outcome |
| CSF2 | SNV | Missense_Mutation | novel | c.379C>A | p.Leu127Met | p.L127M | P04141 | protein_coding | deleterious(0) | probably_damaging(0.999) | TCGA-2W-A8YY-01 | Cervix | cervical & endocervical cancer | Female | <65 | I/II | Chemotherapy | cisplatin | CR |
| CSF2 | SNV | Missense_Mutation | novel | c.386N>G | p.Asp129Gly | p.D129G | P04141 | protein_coding | tolerated(0.44) | benign(0.387) | TCGA-AA-3939-01 | Colorectum | colon adenocarcinoma | Male | >=65 | I/II | Unknown | Unknown | SD |
| CSF2 | SNV | Missense_Mutation | c.387N>G | p.Asp129Glu | p.D129E | P04141 | protein_coding | tolerated(1) | benign(0) | TCGA-AA-3939-01 | Colorectum | colon adenocarcinoma | Male | >=65 | I/II | Unknown | Unknown | SD | |
| CSF2 | SNV | Missense_Mutation | novel | c.224G>A | p.Arg75His | p.R75H | P04141 | protein_coding | tolerated(0.27) | possibly_damaging(0.759) | TCGA-AP-A1DO-01 | Endometrium | uterine corpus endometrioid carcinoma | Female | <65 | I/II | Unknown | Unknown | SD |
| CSF2 | SNV | Missense_Mutation | novel | c.67C>T | p.Pro23Ser | p.P23S | P04141 | protein_coding | tolerated(0.15) | benign(0.048) | TCGA-DF-A2KU-01 | Endometrium | uterine corpus endometrioid carcinoma | Female | Unknown | I/II | Unknown | Unknown | SD |
| CSF2 | SNV | Missense_Mutation | novel | c.377N>G | p.Asn126Ser | p.N126S | P04141 | protein_coding | tolerated(0.2) | benign(0.001) | TCGA-FI-A2D5-01 | Endometrium | uterine corpus endometrioid carcinoma | Female | <65 | III/IV | Chemotherapy | carboplatinum | PD |
| CSF2 | SNV | Missense_Mutation | novel | c.268C>T | p.Leu90Phe | p.L90F | P04141 | protein_coding | deleterious(0.02) | probably_damaging(0.999) | TCGA-63-7021-01 | Lung | lung squamous cell carcinoma | Male | Unknown | I/II | Unknown | Unknown | PD |
| CSF2 | SNV | Missense_Mutation | novel | c.358N>C | p.Phe120Leu | p.F120L | P04141 | protein_coding | tolerated(0.06) | probably_damaging(0.995) | TCGA-77-8009-01 | Lung | lung squamous cell carcinoma | Male | >=65 | I/II | Unknown | Unknown | PD |
| Page: 1 |
Top |
Related drugs of malignant transformation related genes |
| Identification of chemicals and drugs interact with genes involved in malignant transfromation |
| (DGIdb 4.0) |
| Entrez ID | Symbol | Category | Interaction Types | Drug Claim Name | Drug Name | PMIDs |
| 1437 | CSF2 | DRUGGABLE GENOME, GROWTH FACTOR | NORDIHYDROGUAIARETIC ACID | 2453577 | ||
| 1437 | CSF2 | DRUGGABLE GENOME, GROWTH FACTOR | 4-HYDROPEROXYCYCLOPHOSPHAMIDE | PERFOSFAMIDE | 1283360 | |
| 1437 | CSF2 | DRUGGABLE GENOME, GROWTH FACTOR | Lenzilumab | LENZILUMAB | ||
| 1437 | CSF2 | DRUGGABLE GENOME, GROWTH FACTOR | STAUROSPORINE | STAUROSPORINE | 9359403 | |
| 1437 | CSF2 | DRUGGABLE GENOME, GROWTH FACTOR | KB002/003 | |||
| 1437 | CSF2 | DRUGGABLE GENOME, GROWTH FACTOR | LACTULOSE | LACTULOSE | 11355146 | |
| 1437 | CSF2 | DRUGGABLE GENOME, GROWTH FACTOR | GP100 | 15665624 | ||
| 1437 | CSF2 | DRUGGABLE GENOME, GROWTH FACTOR | ROQUINIMEX | ROQUINIMEX | 9811314 | |
| 1437 | CSF2 | DRUGGABLE GENOME, GROWTH FACTOR | CDNA vaccine | |||
| 1437 | CSF2 | DRUGGABLE GENOME, GROWTH FACTOR | PLATINUM | PLATINUM | 8110490 |
| Page: 1 2 3 4 5 6 7 8 9 |

Copyright 2023-Present -The University of Texas Health Science Center at Houston |