
|
|||||
|
 | |
| |
| |
| |
| |
| |
|
Gene: CSAG1 |
Gene summary for CSAG1 |
| Gene information | Species | Human | Gene symbol | CSAG1 | Gene ID | 158511 |
| Gene name | chondrosarcoma associated gene 1 | |
| Gene Alias | CSAGE | |
| Cytomap | Xq28 | |
| Gene Type | protein-coding | GO ID | NA | UniProtAcc | A0A024RC18 |
Top |
Malignant transformation analysis |
| Identification of the aberrant gene expression in precancerous and cancerous lesions by comparing the gene expression of stem-like cells in diseased tissues with normal stem cells |
| Entrez ID | Symbol | Replicates | Species | Organ | Tissue | Adj P-value | Log2FC | Malignancy |
| 158511 | CSAG1 | P1T-E | Human | Esophagus | ESCC | 1.07e-31 | 1.36e+00 | 0.0875 |
| 158511 | CSAG1 | P5T-E | Human | Esophagus | ESCC | 6.03e-56 | 9.40e-01 | 0.1327 |
| 158511 | CSAG1 | P9T-E | Human | Esophagus | ESCC | 6.69e-43 | 8.67e-01 | 0.1131 |
| 158511 | CSAG1 | P11T-E | Human | Esophagus | ESCC | 4.74e-03 | 3.08e-01 | 0.1426 |
| 158511 | CSAG1 | P15T-E | Human | Esophagus | ESCC | 2.42e-52 | 1.00e+00 | 0.1149 |
| 158511 | CSAG1 | P17T-E | Human | Esophagus | ESCC | 4.56e-20 | 6.33e-01 | 0.1278 |
| 158511 | CSAG1 | P19T-E | Human | Esophagus | ESCC | 2.95e-08 | 7.91e-01 | 0.1662 |
| 158511 | CSAG1 | P20T-E | Human | Esophagus | ESCC | 1.25e-36 | 6.93e-01 | 0.1124 |
| 158511 | CSAG1 | P23T-E | Human | Esophagus | ESCC | 1.83e-49 | 1.13e+00 | 0.108 |
| 158511 | CSAG1 | P24T-E | Human | Esophagus | ESCC | 3.97e-04 | 1.19e-01 | 0.1287 |
| 158511 | CSAG1 | P26T-E | Human | Esophagus | ESCC | 6.26e-61 | 9.22e-01 | 0.1276 |
| 158511 | CSAG1 | P37T-E | Human | Esophagus | ESCC | 1.41e-59 | 1.22e+00 | 0.1371 |
| 158511 | CSAG1 | P52T-E | Human | Esophagus | ESCC | 7.28e-26 | 8.04e-01 | 0.1555 |
| 158511 | CSAG1 | P54T-E | Human | Esophagus | ESCC | 4.42e-42 | 7.67e-01 | 0.0975 |
| 158511 | CSAG1 | P62T-E | Human | Esophagus | ESCC | 1.21e-03 | 1.64e-01 | 0.1302 |
| 158511 | CSAG1 | P80T-E | Human | Esophagus | ESCC | 7.27e-30 | 7.57e-01 | 0.155 |
| 158511 | CSAG1 | P82T-E | Human | Esophagus | ESCC | 6.28e-04 | 3.53e-01 | 0.1072 |
| 158511 | CSAG1 | P83T-E | Human | Esophagus | ESCC | 1.09e-70 | 1.52e+00 | 0.1738 |
| 158511 | CSAG1 | P89T-E | Human | Esophagus | ESCC | 3.35e-02 | 2.22e-01 | 0.1752 |
| 158511 | CSAG1 | P126T-E | Human | Esophagus | ESCC | 2.15e-17 | 1.26e+00 | 0.1125 |
| Page: 1 2 |
| Tissue | Expression Dynamics | Abbreviation |
| Esophagus | 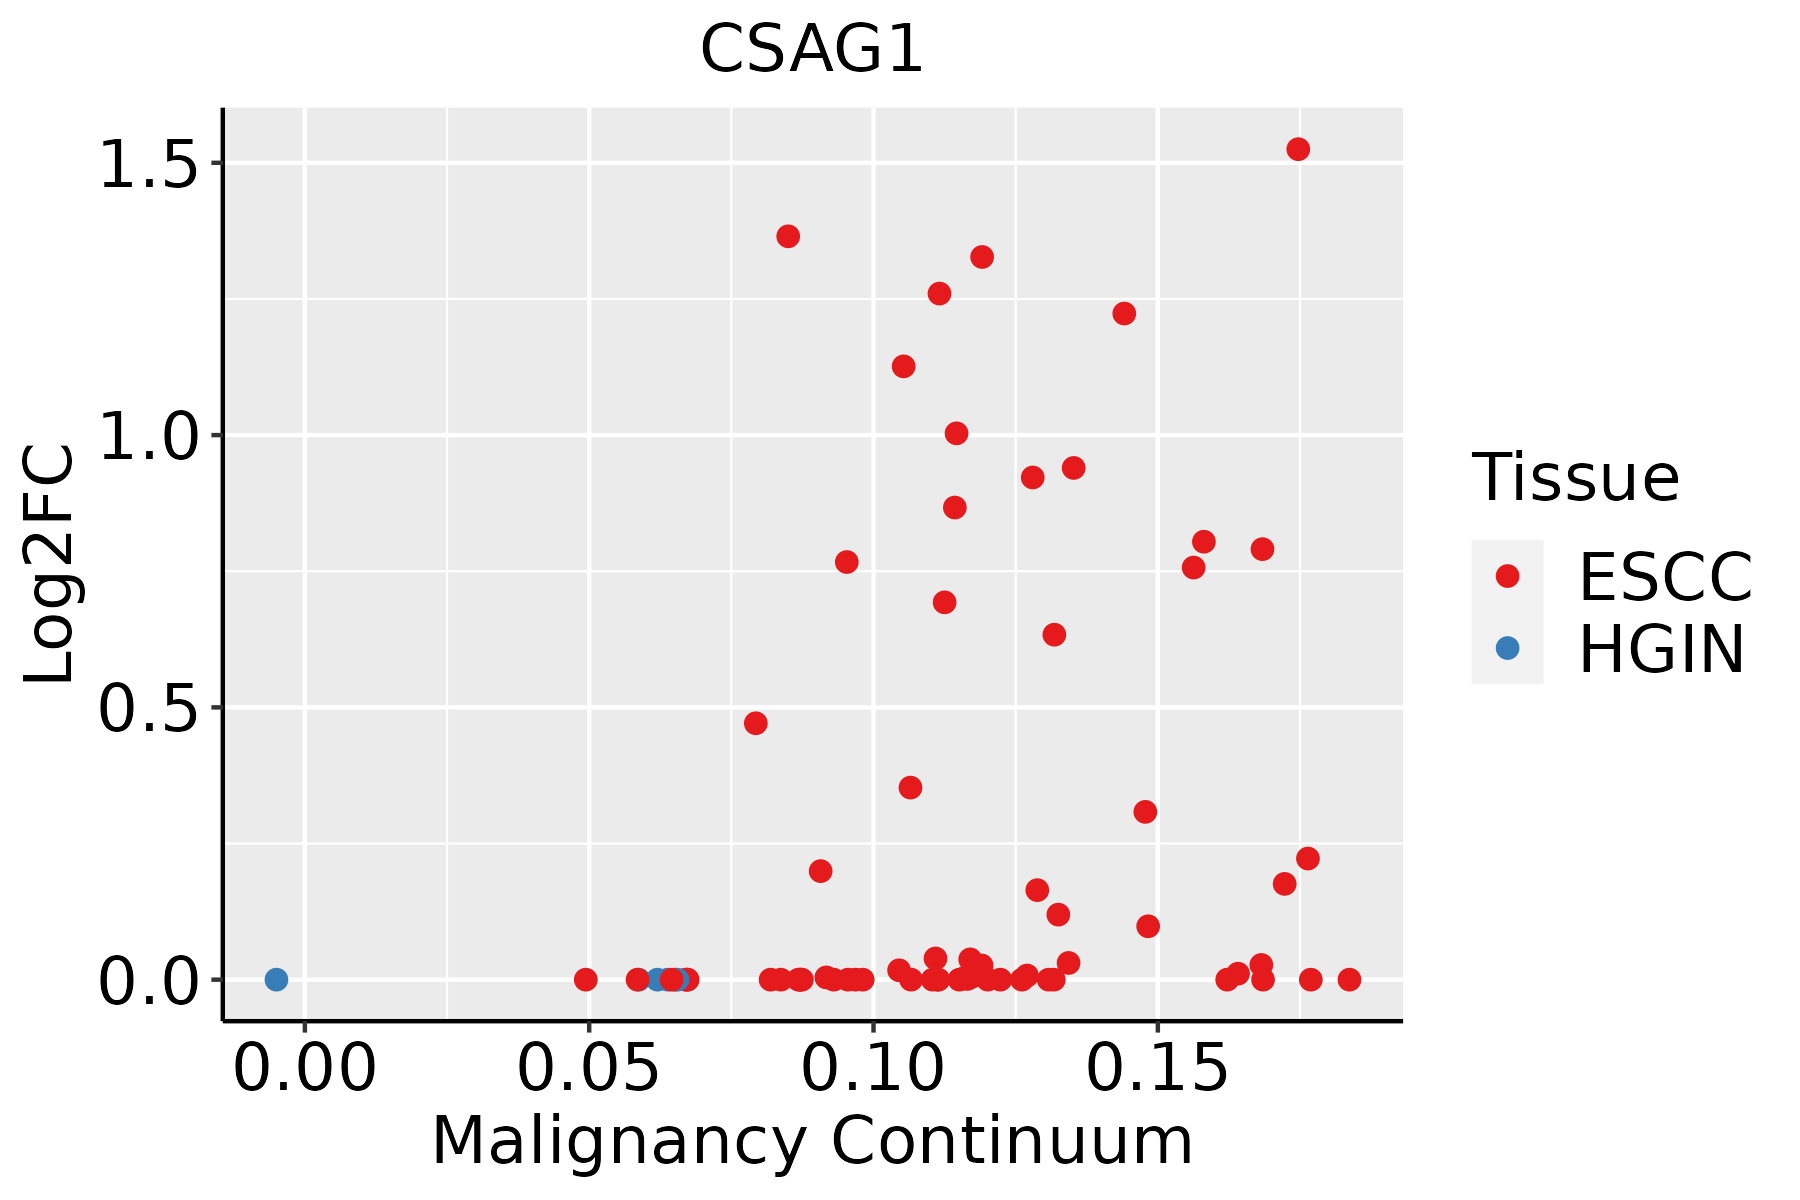 | ESCC: Esophageal squamous cell carcinoma |
| HGIN: High-grade intraepithelial neoplasias | ||
| LGIN: Low-grade intraepithelial neoplasias | ||
| Liver | 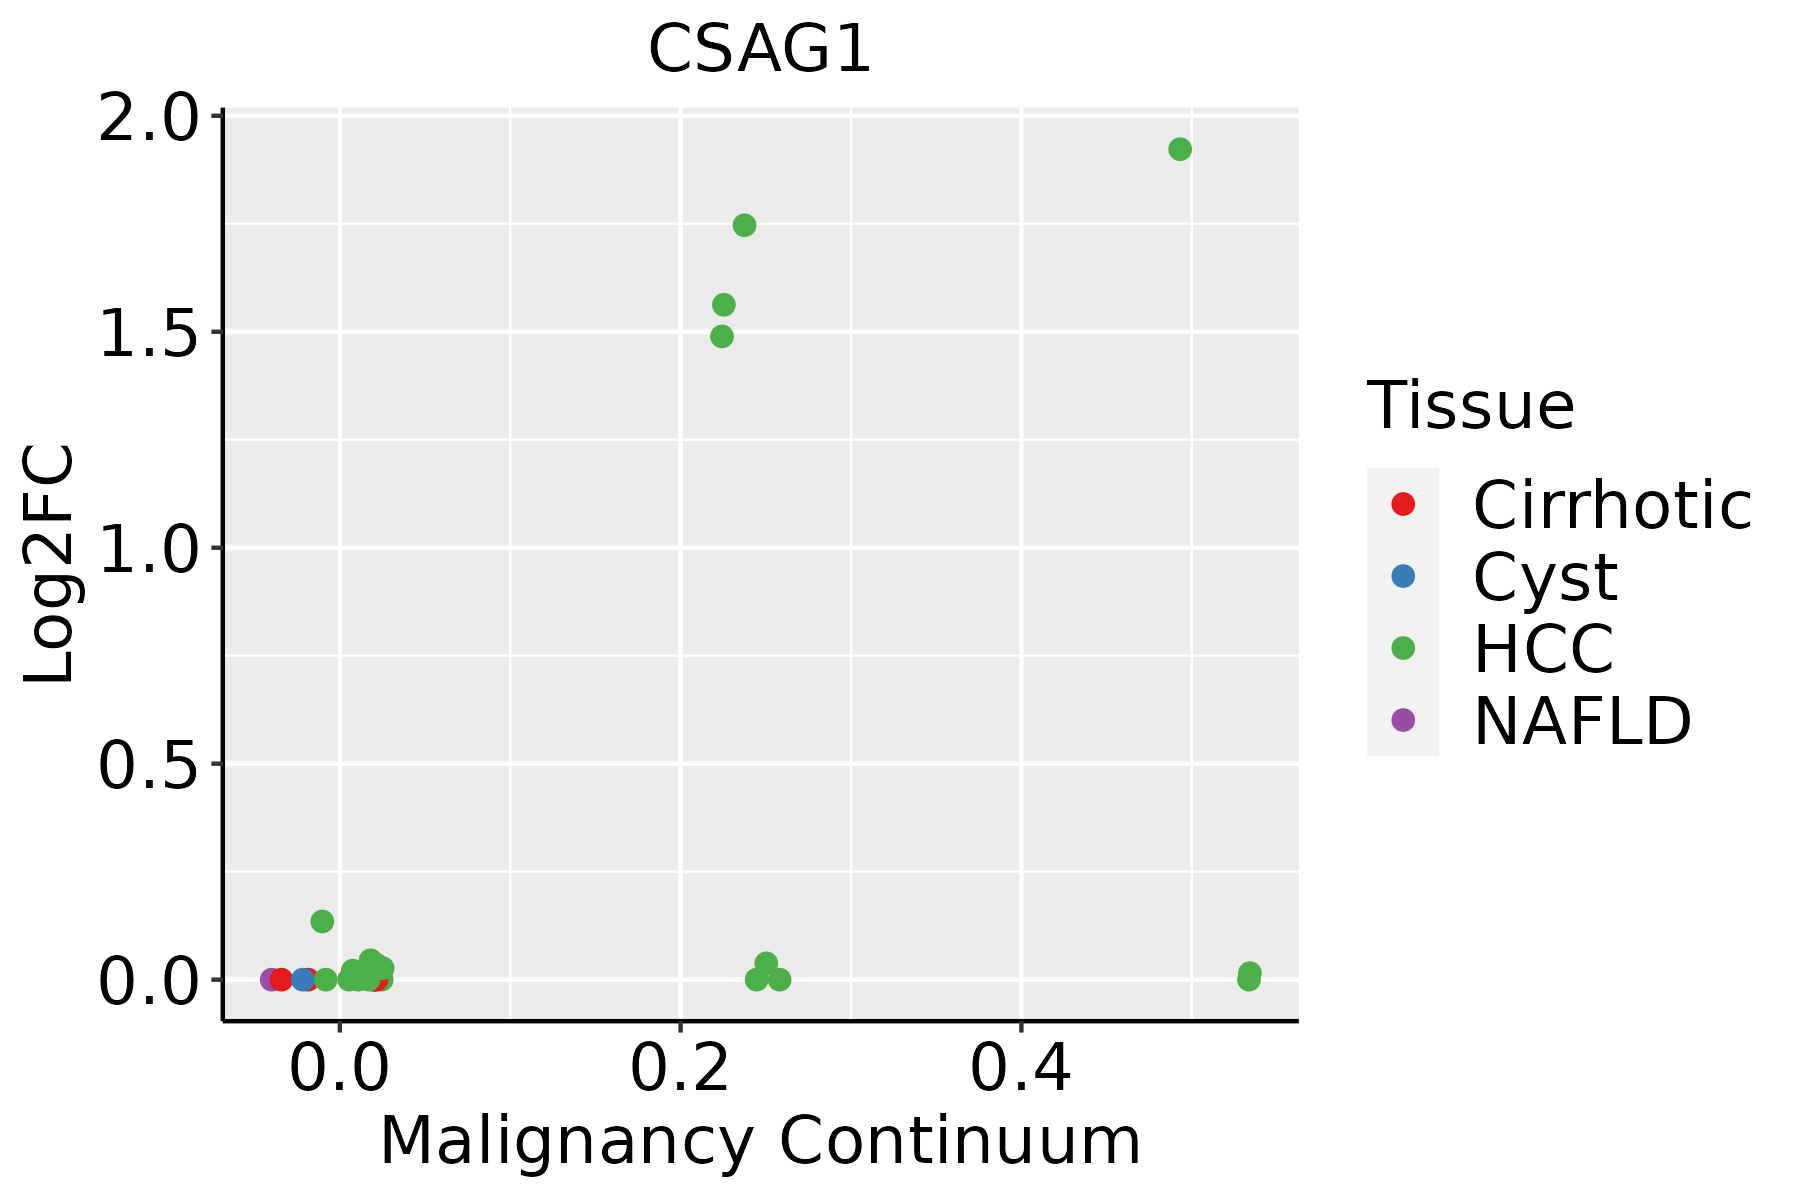 | HCC: Hepatocellular carcinoma |
| NAFLD: Non-alcoholic fatty liver disease | ||
| Oral Cavity |  | EOLP: Erosive Oral lichen planus |
| LP: leukoplakia | ||
| NEOLP: Non-erosive oral lichen planus | ||
| OSCC: Oral squamous cell carcinoma |
| ∗log2FC in expression of this searched gene in stem-like cells from each diseased tissue sample relative to stem-like cells in normal samples in each tissue plotted against the malignancy continuum. Samples are colored based on if they are from different disease stage. |
Top |
Malignant transformation related pathway analysis |
| Find out the enriched GO biological processes and KEGG pathways involved in transition from healthy to precancer to cancer |
| Tissue | Disease Stage | Enriched GO biological Processes |
| Colorectum | AD |  |
| Colorectum | SER |  |
| Colorectum | MSS |  |
| Colorectum | MSI-H |  |
| Colorectum | FAP |  |
| ∗Top 15 enriched GO BP terms are showed in the bar plot of each disease state in each tissue. Each row represents a significant GO biological process which is colored according to the -log10(p.adjust). |
| Page: 1 2 3 4 5 6 7 8 9 |
| GO ID | Tissue | Disease Stage | Description | Gene Ratio | Bg Ratio | pvalue | p.adjust | Count |
| Page: 1 |
| Pathway ID | Tissue | Disease Stage | Description | Gene Ratio | Bg Ratio | pvalue | p.adjust | qvalue | Count |
| Page: 1 |
Top |
Cell-cell communication analysis |
| Identification of potential cell-cell interactions between two cell types and their ligand-receptor pairs for different disease states |
| Ligand | Receptor | LRpair | Pathway | Tissue | Disease Stage |
| Page: 1 |
Top |
Single-cell gene regulatory network inference analysis |
| Find out the significant the regulons (TFs) and the target genes of each regulon across cell types for different disease states |
| TF | Cell Type | Tissue | Disease Stage | Target Gene | RSS | Regulon Activity |
| ∗The dot plots of a searched regulon are shown for all cell subpopulations in each disease state of each tissue based on the regulon specific score inferred using pySCENIC and by calculating the average expression. |
| Page: 1 |
Top |
Somatic mutation of malignant transformation related genes |
| Annotation of somatic variants for genes involved in malignant transformation |
| Hugo Symbol | Variant Class | Variant Classification | dbSNP RS | HGVSc | HGVSp | HGVSp Short | SWISSPROT | BIOTYPE | SIFT | PolyPhen | Tumor Sample Barcode | Tissue | Histology | Sex | Age | Stage | Therapy Types | Drugs | Outcome |
| CSAG1 | SNV | Missense_Mutation | c.122G>A | p.Arg41Gln | p.R41Q | protein_coding | deleterious_low_confidence(0.02) | probably_damaging(0.975) | TCGA-AN-A046-01 | Breast | breast invasive carcinoma | Female | >=65 | I/II | Unknown | Unknown | SD | ||
| CSAG1 | SNV | Missense_Mutation | c.72N>C | p.Trp24Cys | p.W24C | protein_coding | tolerated_low_confidence(0.21) | benign(0.009) | TCGA-B6-A0WW-01 | Breast | breast invasive carcinoma | Female | <65 | I/II | Unknown | Unknown | PD | ||
| CSAG1 | SNV | Missense_Mutation | c.71G>T | p.Trp24Leu | p.W24L | protein_coding | tolerated_low_confidence(0.11) | benign(0.173) | TCGA-E9-A1R4-01 | Breast | breast invasive carcinoma | Female | >=65 | I/II | Chemotherapy | 5-fluorouracil | SD | ||
| CSAG1 | SNV | Missense_Mutation | c.122N>A | p.Arg41Gln | p.R41Q | protein_coding | deleterious_low_confidence(0.02) | probably_damaging(0.975) | TCGA-Q1-A73O-01 | Cervix | cervical & endocervical cancer | Female | <65 | I/II | Chemotherapy | cisplatin | CR | ||
| CSAG1 | SNV | Missense_Mutation | novel | c.207G>T | p.Lys69Asn | p.K69N | protein_coding | deleterious_low_confidence(0.02) | probably_damaging(0.99) | TCGA-CA-6717-01 | Colorectum | colon adenocarcinoma | Male | <65 | I/II | Chemotherapy | oxaliplatin | CR | |
| CSAG1 | SNV | Missense_Mutation | c.205N>G | p.Lys69Glu | p.K69E | protein_coding | tolerated_low_confidence(0.16) | probably_damaging(0.979) | TCGA-AP-A056-01 | Endometrium | uterine corpus endometrioid carcinoma | Female | <65 | I/II | Unknown | Unknown | SD | ||
| CSAG1 | SNV | Missense_Mutation | novel | c.176N>T | p.Arg59Ile | p.R59I | protein_coding | deleterious_low_confidence(0.03) | probably_damaging(0.988) | TCGA-DF-A2KV-01 | Endometrium | uterine corpus endometrioid carcinoma | Female | <65 | I/II | Unknown | Unknown | SD | |
| CSAG1 | SNV | Missense_Mutation | novel | c.16G>A | p.Ala6Thr | p.A6T | protein_coding | tolerated_low_confidence(0.26) | benign(0.028) | TCGA-DI-A1NO-01 | Endometrium | uterine corpus endometrioid carcinoma | Female | >=65 | III/IV | Unknown | Unknown | PD | |
| CSAG1 | SNV | Missense_Mutation | novel | c.5N>T | p.Ser2Leu | p.S2L | protein_coding | tolerated_low_confidence(0.68) | benign(0) | TCGA-EO-A3B0-01 | Endometrium | uterine corpus endometrioid carcinoma | Female | <65 | III/IV | Unknown | Unknown | SD | |
| CSAG1 | SNV | Missense_Mutation | novel | c.221N>G | p.Thr74Arg | p.T74R | protein_coding | tolerated_low_confidence(0.1) | probably_damaging(0.994) | TCGA-EO-A3KU-01 | Endometrium | uterine corpus endometrioid carcinoma | Female | >=65 | I/II | Chemotherapy | carboplatin | CR |
| Page: 1 2 |
Top |
Related drugs of malignant transformation related genes |
| Identification of chemicals and drugs interact with genes involved in malignant transfromation |
| (DGIdb 4.0) |
| Entrez ID | Symbol | Category | Interaction Types | Drug Claim Name | Drug Name | PMIDs |
| Page: 1 |

Copyright 2023-Present -The University of Texas Health Science Center at Houston |