
|
|||||
|
 | |
| |
| |
| |
| |
| |
|
Gene: CSAD |
Gene summary for CSAD |
| Gene information | Species | Human | Gene symbol | CSAD | Gene ID | 51380 |
| Gene name | cysteine sulfinic acid decarboxylase | |
| Gene Alias | CSD | |
| Cytomap | 12q13.13 | |
| Gene Type | protein-coding | GO ID | GO:0000096 | UniProtAcc | A0A024RAX7 |
Top |
Malignant transformation analysis |
| Identification of the aberrant gene expression in precancerous and cancerous lesions by comparing the gene expression of stem-like cells in diseased tissues with normal stem cells |
| Entrez ID | Symbol | Replicates | Species | Organ | Tissue | Adj P-value | Log2FC | Malignancy |
| 51380 | CSAD | GSM4909285 | Human | Breast | IDC | 3.96e-03 | 2.52e-01 | 0.21 |
| 51380 | CSAD | GSM4909293 | Human | Breast | IDC | 2.05e-03 | 1.93e-01 | 0.1581 |
| 51380 | CSAD | GSM4909298 | Human | Breast | IDC | 1.10e-02 | 1.93e-01 | 0.1551 |
| 51380 | CSAD | GSM4909301 | Human | Breast | IDC | 1.40e-03 | 3.06e-01 | 0.1577 |
| 51380 | CSAD | GSM4909306 | Human | Breast | IDC | 4.60e-16 | 5.07e-01 | 0.1564 |
| 51380 | CSAD | GSM4909311 | Human | Breast | IDC | 9.02e-07 | -3.80e-02 | 0.1534 |
| 51380 | CSAD | GSM4909319 | Human | Breast | IDC | 3.22e-10 | -7.66e-02 | 0.1563 |
| 51380 | CSAD | GSM4909321 | Human | Breast | IDC | 1.06e-05 | 1.03e-01 | 0.1559 |
| 51380 | CSAD | M1 | Human | Breast | IDC | 4.35e-02 | 2.99e-01 | 0.1577 |
| 51380 | CSAD | M5 | Human | Breast | IDC | 5.74e-03 | 5.63e-01 | 0.1598 |
| 51380 | CSAD | P1 | Human | Breast | IDC | 1.97e-04 | 1.91e-02 | 0.1527 |
| 51380 | CSAD | DCIS2 | Human | Breast | DCIS | 1.60e-32 | 1.74e-01 | 0.0085 |
| 51380 | CSAD | NAFLD1 | Human | Liver | NAFLD | 2.22e-05 | 6.33e-01 | -0.04 |
| 51380 | CSAD | S43 | Human | Liver | Cirrhotic | 3.67e-04 | -1.59e-01 | -0.0187 |
| 51380 | CSAD | HCC1_Meng | Human | Liver | HCC | 9.84e-22 | -1.42e-01 | 0.0246 |
| 51380 | CSAD | HCC2_Meng | Human | Liver | HCC | 4.78e-18 | 3.22e-03 | 0.0107 |
| 51380 | CSAD | HCC2 | Human | Liver | HCC | 2.24e-09 | 3.83e+00 | 0.5341 |
| 51380 | CSAD | Pt13.a | Human | Liver | HCC | 1.76e-02 | -1.59e-01 | 0.021 |
| 51380 | CSAD | Pt13.b | Human | Liver | HCC | 1.01e-03 | -2.23e-02 | 0.0251 |
| 51380 | CSAD | C04 | Human | Oral cavity | OSCC | 1.88e-05 | 4.50e-01 | 0.2633 |
| Page: 1 2 3 |
| Tissue | Expression Dynamics | Abbreviation |
| Breast | 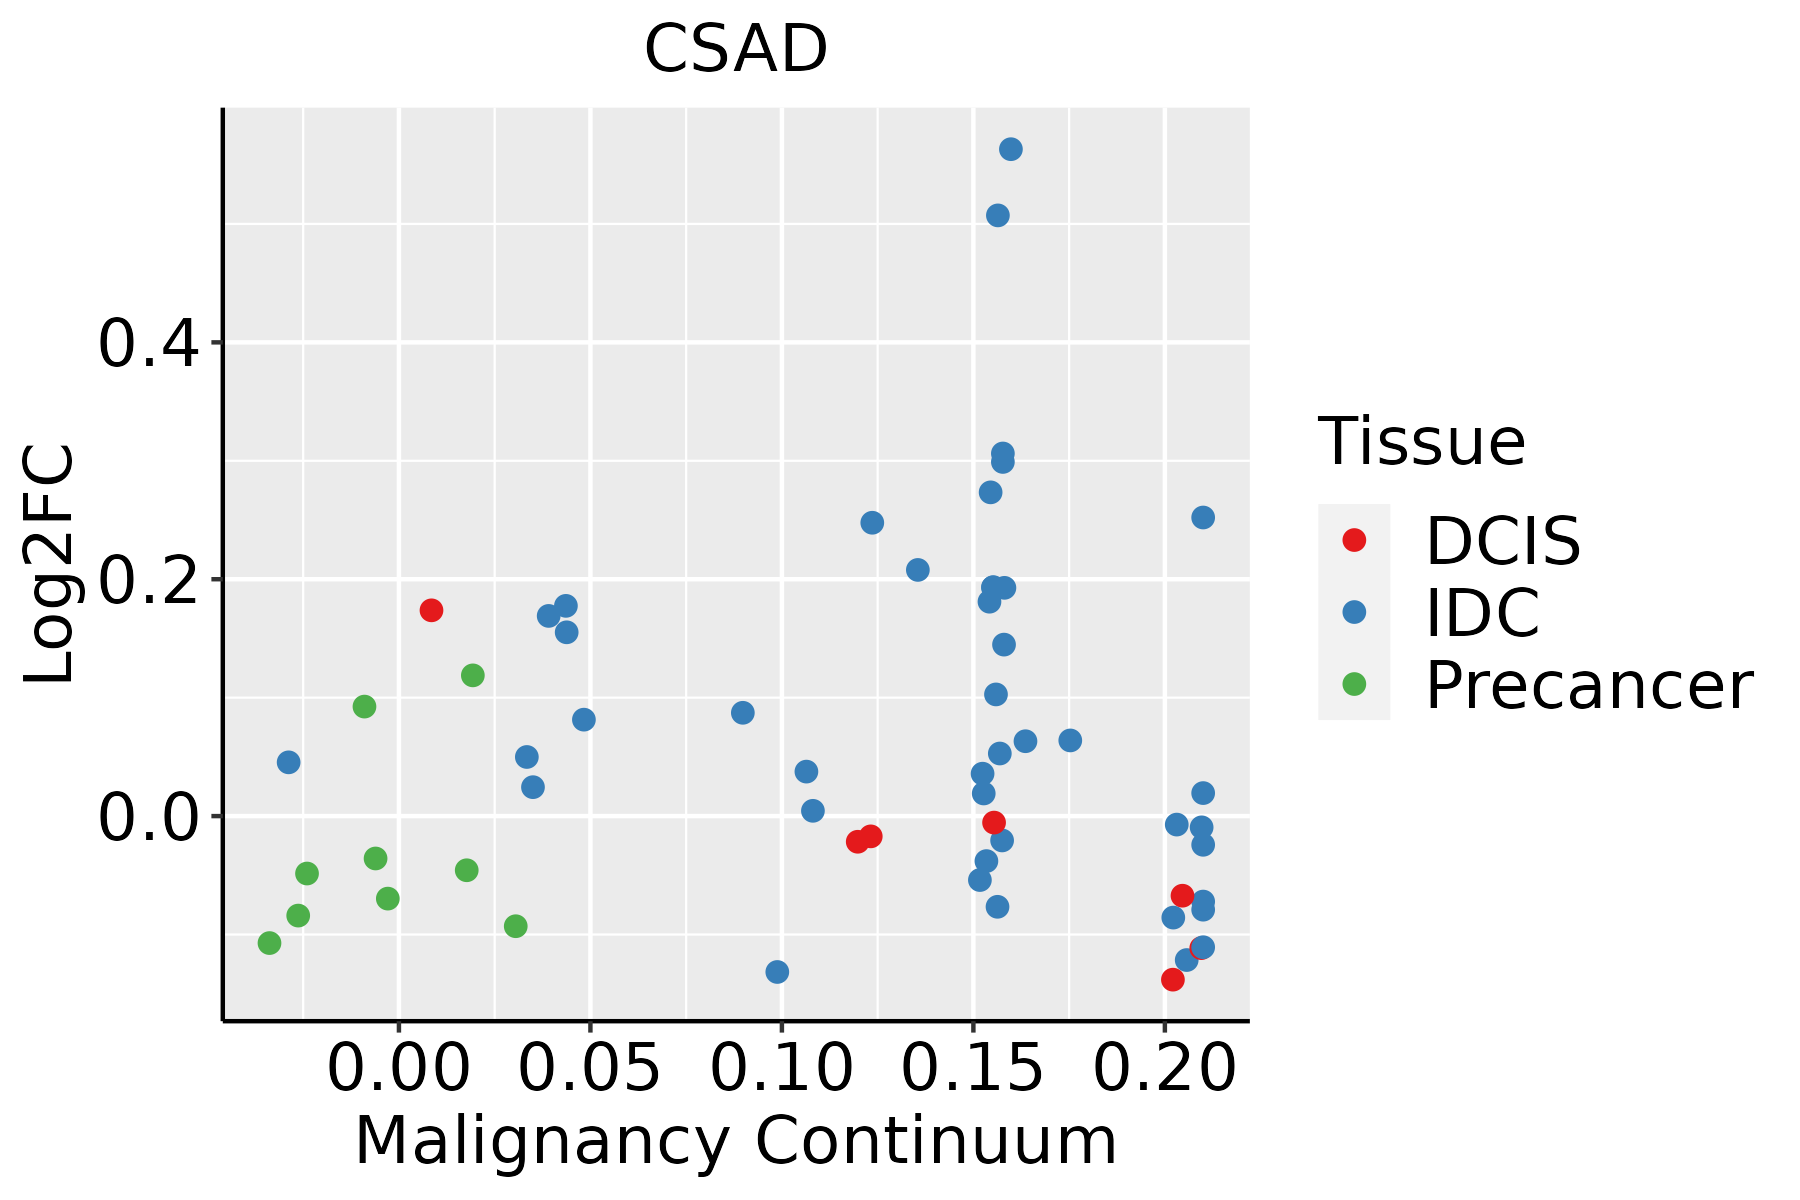 | IDC: Invasive ductal carcinoma |
| DCIS: Ductal carcinoma in situ | ||
| Precancer(BRCA1-mut): Precancerous lesion from BRCA1 mutation carriers | ||
| Liver | 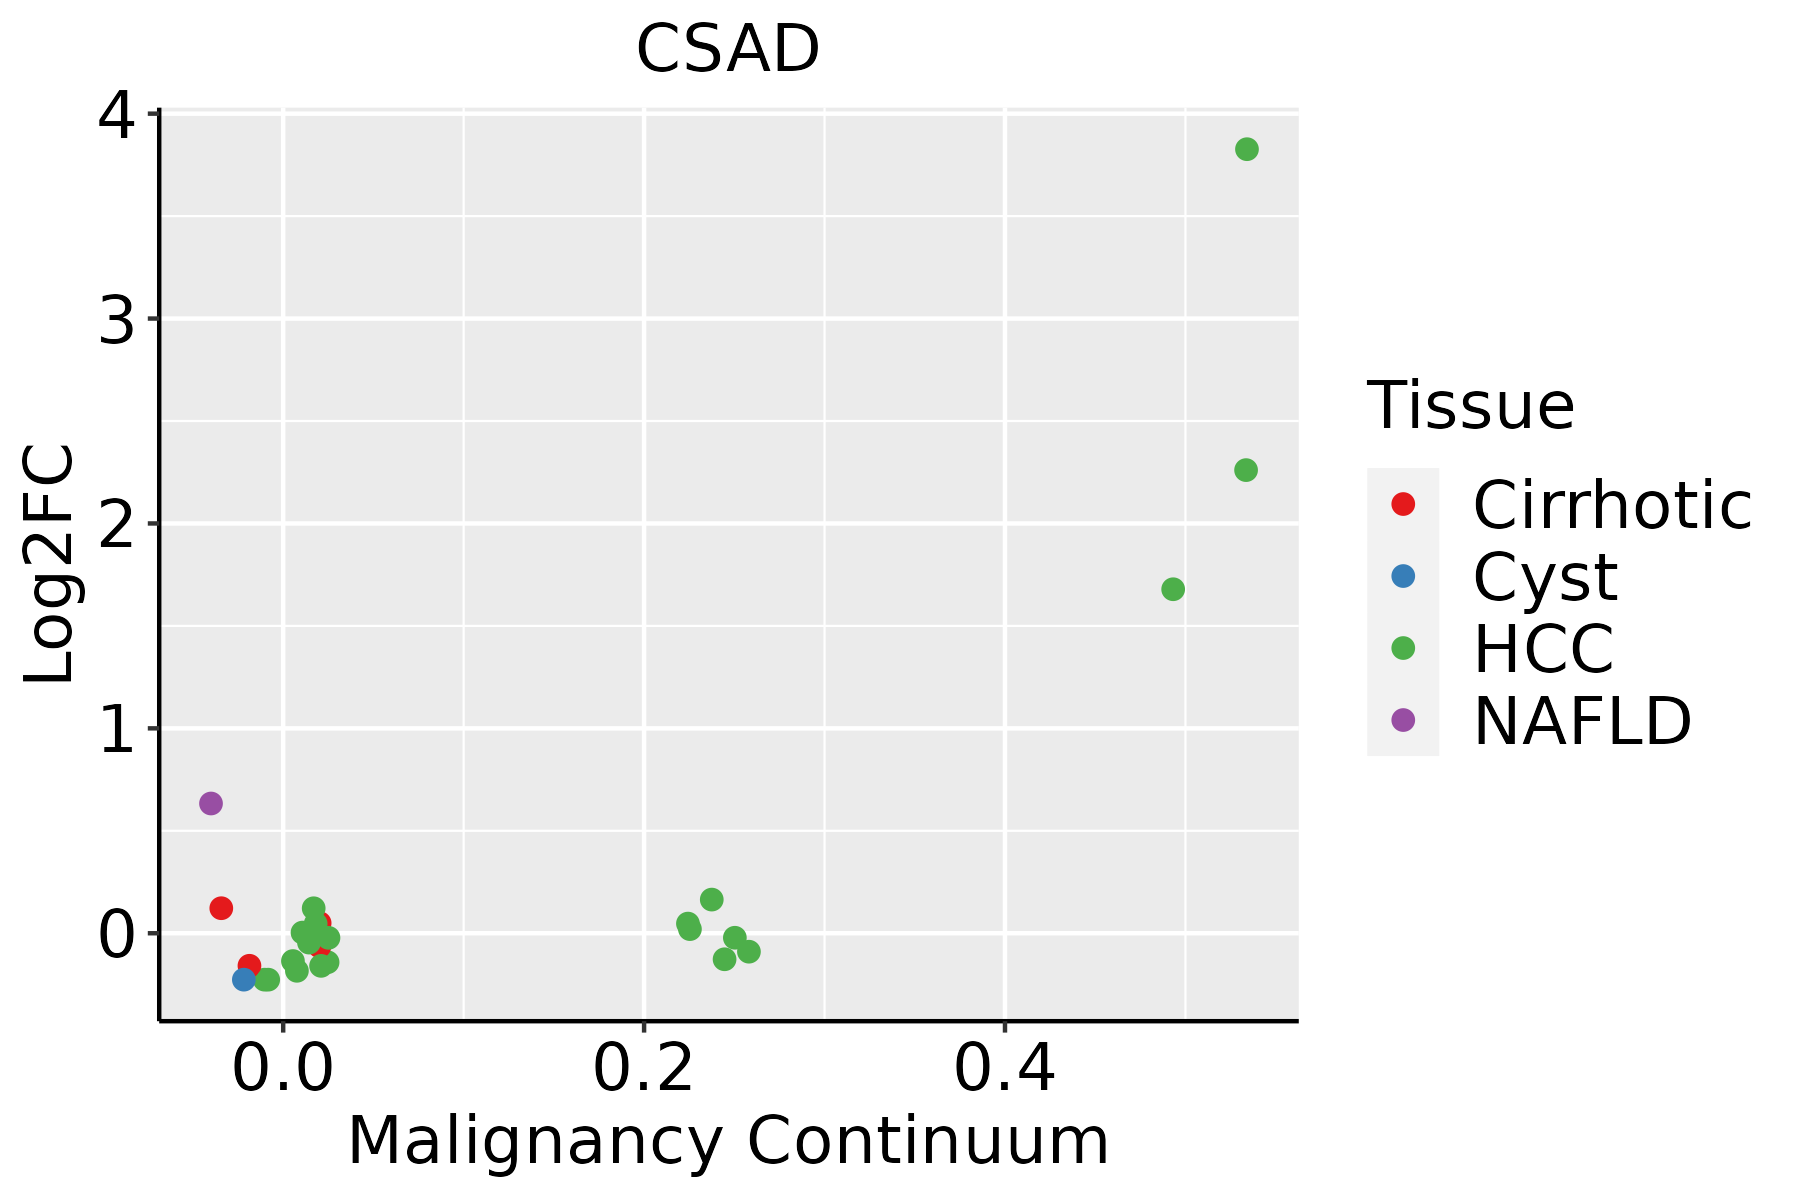 | HCC: Hepatocellular carcinoma |
| NAFLD: Non-alcoholic fatty liver disease | ||
| Oral Cavity |  | EOLP: Erosive Oral lichen planus |
| LP: leukoplakia | ||
| NEOLP: Non-erosive oral lichen planus | ||
| OSCC: Oral squamous cell carcinoma | ||
| Prostate | 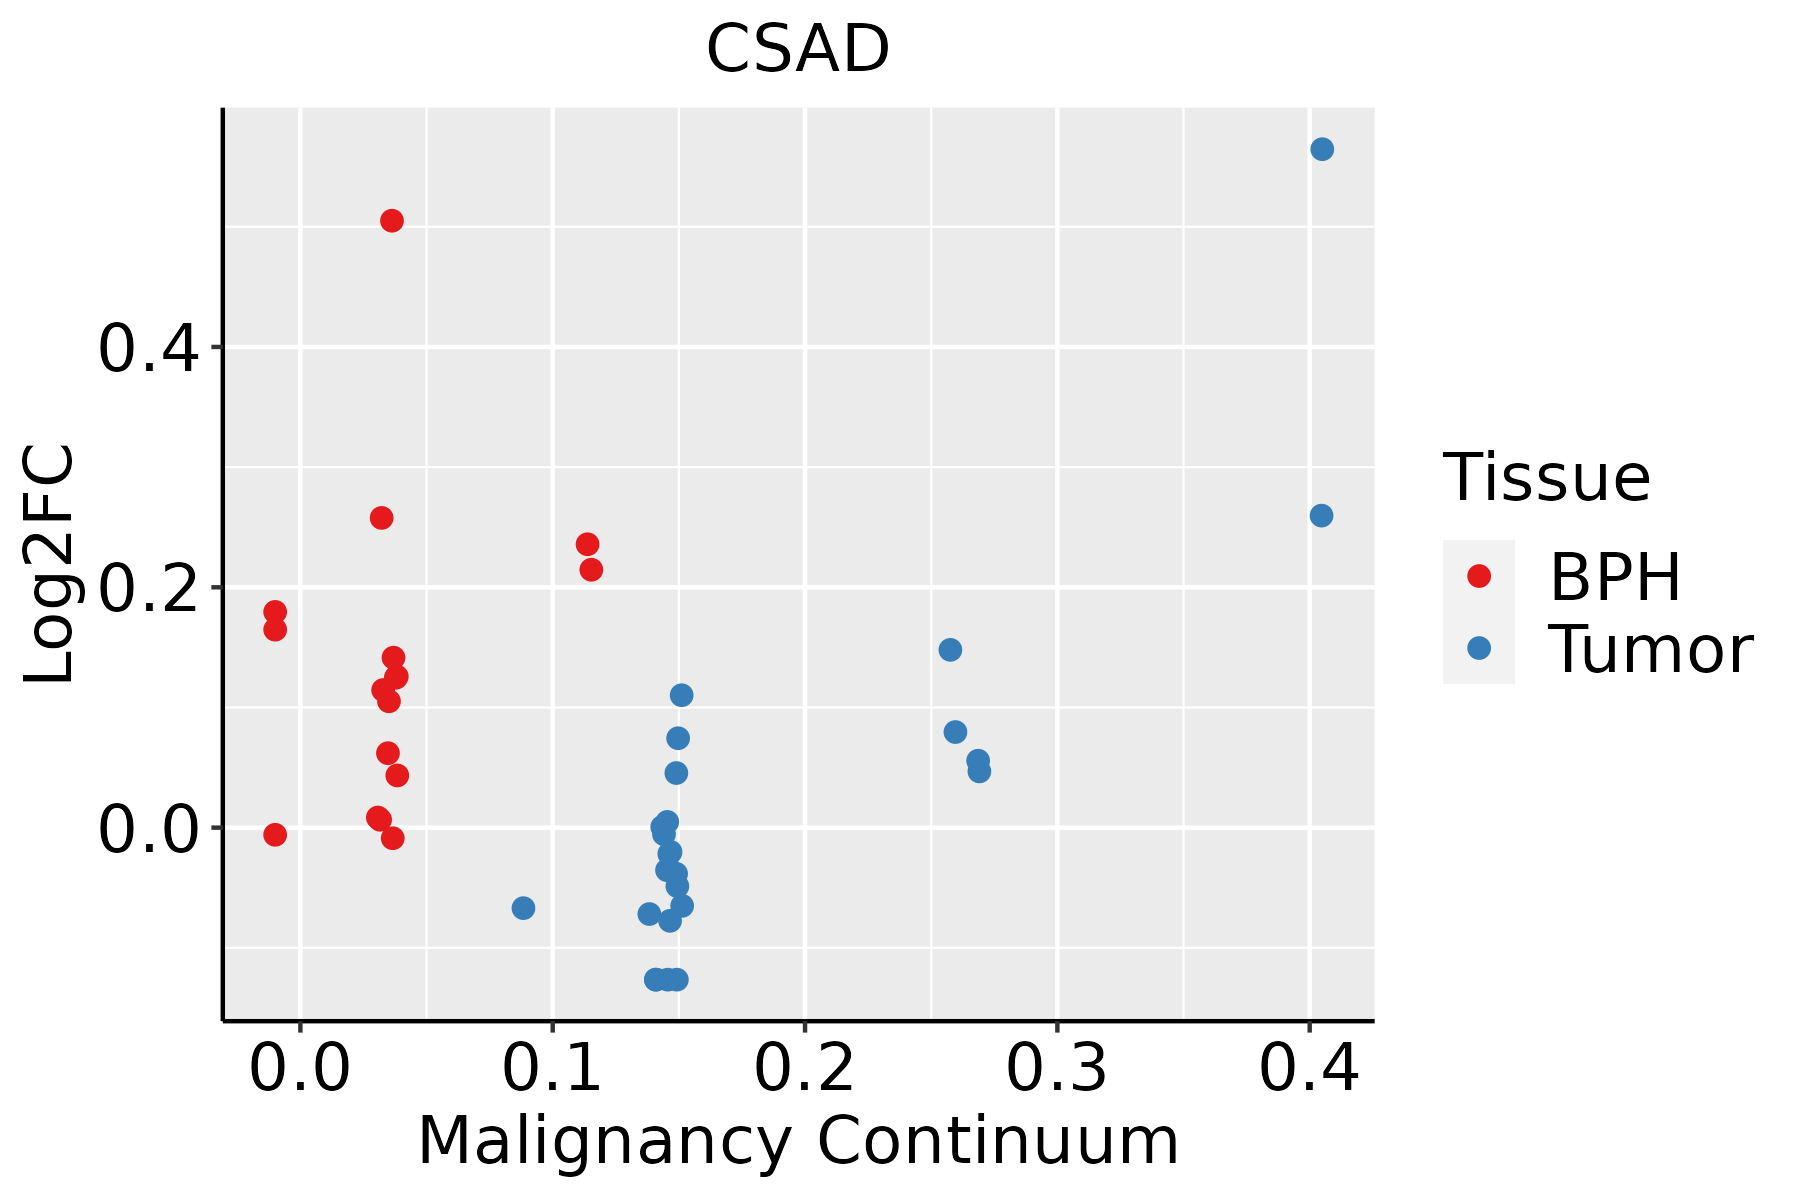 | BPH: Benign Prostatic Hyperplasia |
| Thyroid | 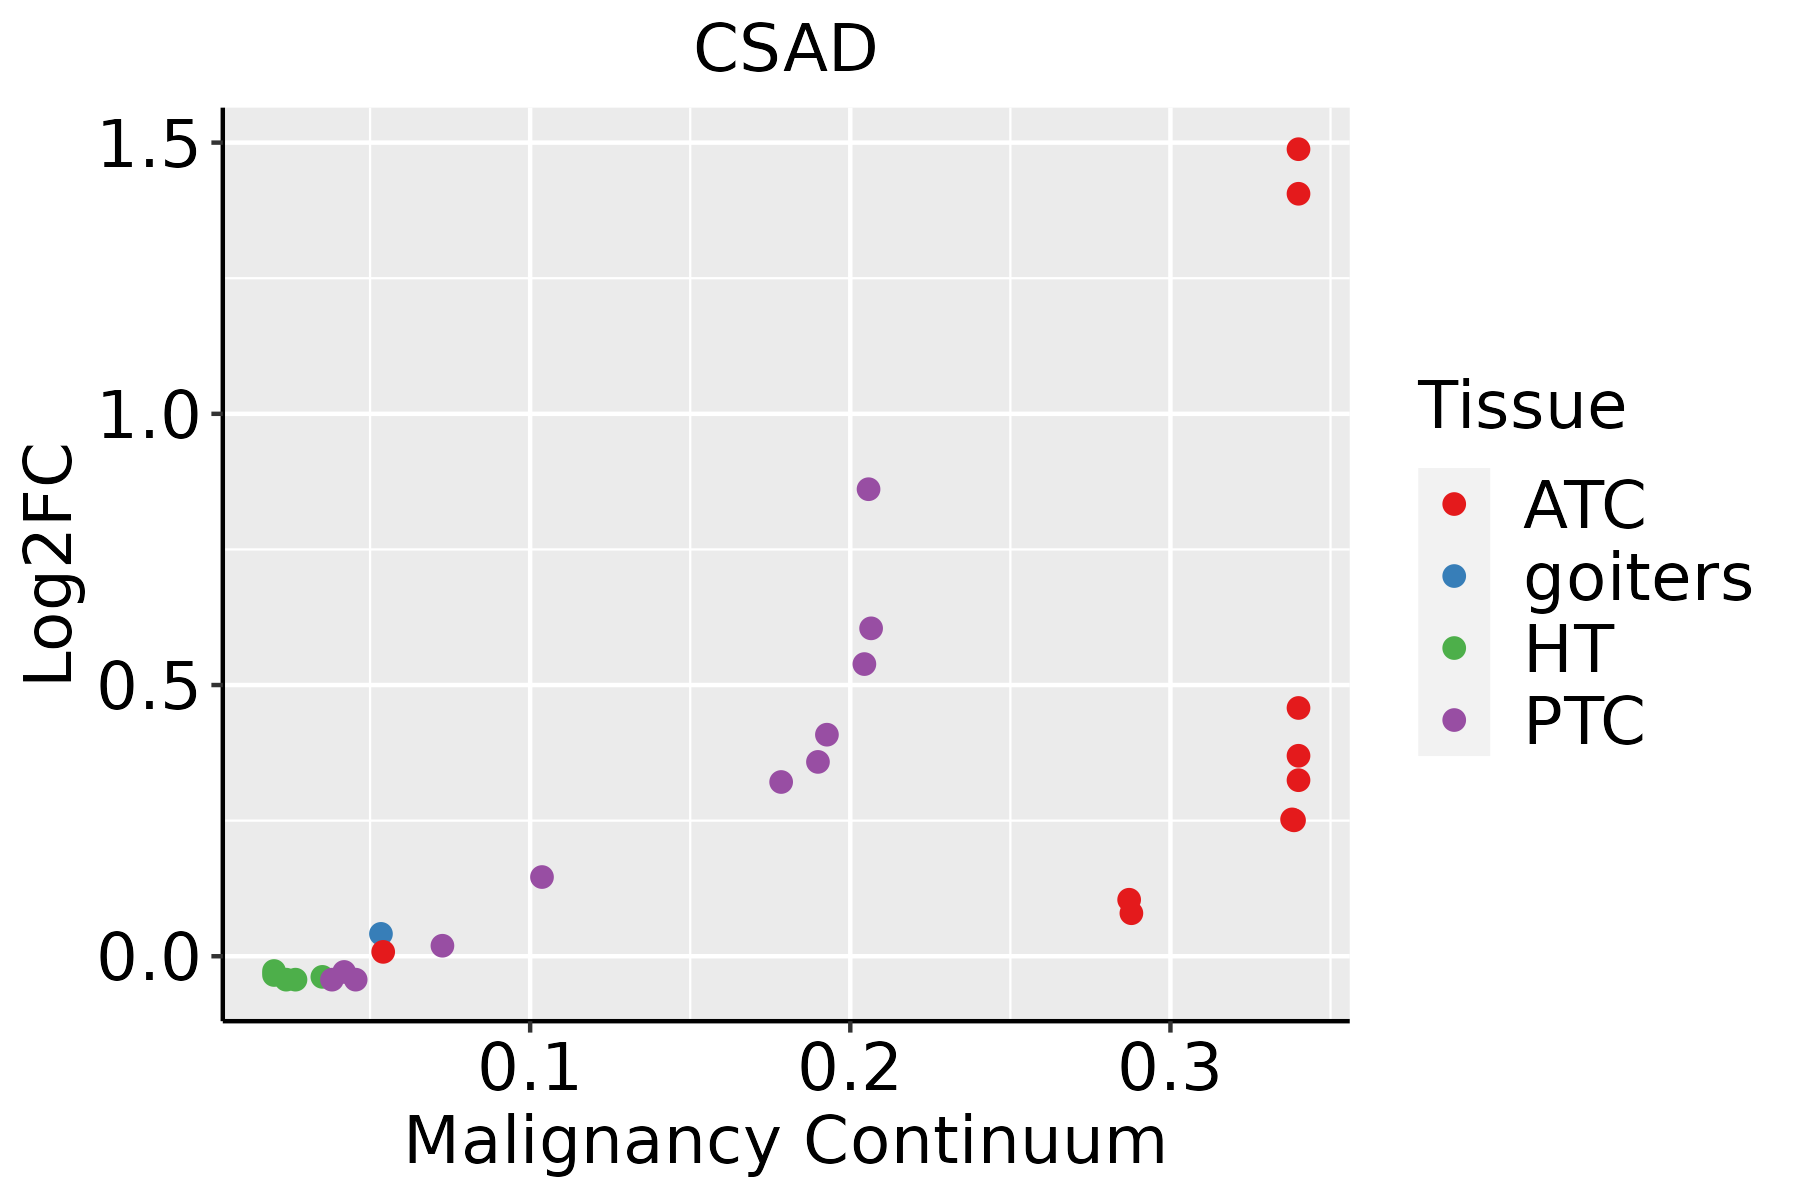 | ATC: Anaplastic thyroid cancer |
| HT: Hashimoto's thyroiditis | ||
| PTC: Papillary thyroid cancer |
| ∗log2FC in expression of this searched gene in stem-like cells from each diseased tissue sample relative to stem-like cells in normal samples in each tissue plotted against the malignancy continuum. Samples are colored based on if they are from different disease stage. |
Top |
Malignant transformation related pathway analysis |
| Find out the enriched GO biological processes and KEGG pathways involved in transition from healthy to precancer to cancer |
| Tissue | Disease Stage | Enriched GO biological Processes |
| Colorectum | AD |  |
| Colorectum | SER |  |
| Colorectum | MSS |  |
| Colorectum | MSI-H |  |
| Colorectum | FAP |  |
| ∗Top 15 enriched GO BP terms are showed in the bar plot of each disease state in each tissue. Each row represents a significant GO biological process which is colored according to the -log10(p.adjust). |
| Page: 1 2 3 4 5 6 7 8 9 |
| GO ID | Tissue | Disease Stage | Description | Gene Ratio | Bg Ratio | pvalue | p.adjust | Count |
| GO:001605313 | Breast | IDC | organic acid biosynthetic process | 39/1434 | 316/18723 | 2.13e-03 | 1.99e-02 | 39 |
| GO:001605322 | Breast | DCIS | organic acid biosynthetic process | 38/1390 | 316/18723 | 2.22e-03 | 2.04e-02 | 38 |
| GO:00463953 | Liver | NAFLD | carboxylic acid catabolic process | 73/1882 | 236/18723 | 4.16e-19 | 1.22e-15 | 73 |
| GO:00160544 | Liver | NAFLD | organic acid catabolic process | 73/1882 | 240/18723 | 1.20e-18 | 2.34e-15 | 73 |
| GO:00442825 | Liver | NAFLD | small molecule catabolic process | 91/1882 | 376/18723 | 8.96e-16 | 1.31e-12 | 91 |
| GO:00160535 | Liver | NAFLD | organic acid biosynthetic process | 77/1882 | 316/18723 | 1.03e-13 | 6.69e-11 | 77 |
| GO:0009063 | Liver | NAFLD | cellular amino acid catabolic process | 36/1882 | 110/18723 | 6.56e-11 | 1.99e-08 | 36 |
| GO:00065203 | Liver | NAFLD | cellular amino acid metabolic process | 63/1882 | 284/18723 | 1.14e-09 | 2.17e-07 | 63 |
| GO:19016053 | Liver | NAFLD | alpha-amino acid metabolic process | 46/1882 | 195/18723 | 2.74e-08 | 2.86e-06 | 46 |
| GO:1901606 | Liver | NAFLD | alpha-amino acid catabolic process | 25/1882 | 87/18723 | 8.67e-07 | 4.60e-05 | 25 |
| GO:00067904 | Liver | NAFLD | sulfur compound metabolic process | 58/1882 | 339/18723 | 3.79e-05 | 9.38e-04 | 58 |
| GO:0000096 | Liver | NAFLD | sulfur amino acid metabolic process | 12/1882 | 34/18723 | 6.82e-05 | 1.45e-03 | 12 |
| GO:0009069 | Liver | NAFLD | serine family amino acid metabolic process | 12/1882 | 40/18723 | 3.93e-04 | 5.85e-03 | 12 |
| GO:0044272 | Liver | NAFLD | sulfur compound biosynthetic process | 28/1882 | 148/18723 | 7.52e-04 | 9.52e-03 | 28 |
| GO:001605312 | Liver | Cirrhotic | organic acid biosynthetic process | 139/4634 | 316/18723 | 4.28e-14 | 3.83e-12 | 139 |
| GO:004428211 | Liver | Cirrhotic | small molecule catabolic process | 151/4634 | 376/18723 | 2.20e-11 | 1.34e-09 | 151 |
| GO:001605411 | Liver | Cirrhotic | organic acid catabolic process | 104/4634 | 240/18723 | 1.91e-10 | 9.53e-09 | 104 |
| GO:004639511 | Liver | Cirrhotic | carboxylic acid catabolic process | 102/4634 | 236/18723 | 3.41e-10 | 1.63e-08 | 102 |
| GO:000679011 | Liver | Cirrhotic | sulfur compound metabolic process | 129/4634 | 339/18723 | 3.06e-08 | 1.04e-06 | 129 |
| GO:19016051 | Liver | Cirrhotic | alpha-amino acid metabolic process | 82/4634 | 195/18723 | 7.72e-08 | 2.30e-06 | 82 |
| Page: 1 2 3 |
| Pathway ID | Tissue | Disease Stage | Description | Gene Ratio | Bg Ratio | pvalue | p.adjust | qvalue | Count |
| hsa00410 | Liver | Cirrhotic | beta-Alanine metabolism | 18/2530 | 31/8465 | 1.00e-03 | 5.57e-03 | 3.43e-03 | 18 |
| hsa00770 | Liver | Cirrhotic | Pantothenate and CoA biosynthesis | 13/2530 | 21/8465 | 2.32e-03 | 9.90e-03 | 6.10e-03 | 13 |
| hsa004101 | Liver | Cirrhotic | beta-Alanine metabolism | 18/2530 | 31/8465 | 1.00e-03 | 5.57e-03 | 3.43e-03 | 18 |
| hsa007701 | Liver | Cirrhotic | Pantothenate and CoA biosynthesis | 13/2530 | 21/8465 | 2.32e-03 | 9.90e-03 | 6.10e-03 | 13 |
| hsa004102 | Liver | HCC | beta-Alanine metabolism | 22/4020 | 31/8465 | 6.93e-03 | 1.92e-02 | 1.07e-02 | 22 |
| hsa007702 | Liver | HCC | Pantothenate and CoA biosynthesis | 16/4020 | 21/8465 | 7.16e-03 | 1.97e-02 | 1.09e-02 | 16 |
| hsa004103 | Liver | HCC | beta-Alanine metabolism | 22/4020 | 31/8465 | 6.93e-03 | 1.92e-02 | 1.07e-02 | 22 |
| hsa007703 | Liver | HCC | Pantothenate and CoA biosynthesis | 16/4020 | 21/8465 | 7.16e-03 | 1.97e-02 | 1.09e-02 | 16 |
| hsa004104 | Prostate | Tumor | beta-Alanine metabolism | 13/1791 | 31/8465 | 7.13e-03 | 2.34e-02 | 1.45e-02 | 13 |
| hsa0041011 | Prostate | Tumor | beta-Alanine metabolism | 13/1791 | 31/8465 | 7.13e-03 | 2.34e-02 | 1.45e-02 | 13 |
| Page: 1 |
Top |
Cell-cell communication analysis |
| Identification of potential cell-cell interactions between two cell types and their ligand-receptor pairs for different disease states |
| Ligand | Receptor | LRpair | Pathway | Tissue | Disease Stage |
| Page: 1 |
Top |
Single-cell gene regulatory network inference analysis |
| Find out the significant the regulons (TFs) and the target genes of each regulon across cell types for different disease states |
| TF | Cell Type | Tissue | Disease Stage | Target Gene | RSS | Regulon Activity |
| ∗The dot plots of a searched regulon are shown for all cell subpopulations in each disease state of each tissue based on the regulon specific score inferred using pySCENIC and by calculating the average expression. |
| Page: 1 |
Top |
Somatic mutation of malignant transformation related genes |
| Annotation of somatic variants for genes involved in malignant transformation |
| Hugo Symbol | Variant Class | Variant Classification | dbSNP RS | HGVSc | HGVSp | HGVSp Short | SWISSPROT | BIOTYPE | SIFT | PolyPhen | Tumor Sample Barcode | Tissue | Histology | Sex | Age | Stage | Therapy Types | Drugs | Outcome |
| CSAD | SNV | Missense_Mutation | c.697G>C | p.Asp233His | p.D233H | Q9Y600 | protein_coding | deleterious(0.01) | probably_damaging(0.97) | TCGA-B6-A0IB-01 | Breast | breast invasive carcinoma | Female | <65 | III/IV | Unknown | Unknown | PD | |
| CSAD | SNV | Missense_Mutation | c.97N>T | p.Ala33Ser | p.A33S | Q9Y600 | protein_coding | tolerated(0.41) | benign(0.047) | TCGA-D8-A1JK-01 | Breast | breast invasive carcinoma | Female | >=65 | I/II | Unknown | Unknown | SD | |
| CSAD | deletion | Frame_Shift_Del | c.570_573delNNNN | p.Arg191IlefsTer86 | p.R191Ifs*86 | Q9Y600 | protein_coding | TCGA-E2-A1L7-01 | Breast | breast invasive carcinoma | Female | <65 | III/IV | Chemotherapy | cyclophosphamide | PD | |||
| CSAD | SNV | Missense_Mutation | rs746863012 | c.394C>T | p.Arg132Cys | p.R132C | Q9Y600 | protein_coding | deleterious(0.04) | possibly_damaging(0.652) | TCGA-JX-A5QV-01 | Cervix | cervical & endocervical cancer | Female | <65 | I/II | Unknown | Unknown | SD |
| CSAD | SNV | Missense_Mutation | rs374597733 | c.1411N>T | p.Arg471Cys | p.R471C | Q9Y600 | protein_coding | deleterious(0) | possibly_damaging(0.861) | TCGA-MA-AA42-01 | Cervix | cervical & endocervical cancer | Female | >=65 | I/II | Unknown | Unknown | SD |
| CSAD | SNV | Missense_Mutation | c.317N>A | p.Arg106His | p.R106H | Q9Y600 | protein_coding | tolerated(0.06) | benign(0.009) | TCGA-AA-3713-01 | Colorectum | colon adenocarcinoma | Male | >=65 | III/IV | Chemotherapy | 5-fluorouracil | PR | |
| CSAD | SNV | Missense_Mutation | novel | c.1543N>T | p.Arg515Trp | p.R515W | Q9Y600 | protein_coding | deleterious(0) | possibly_damaging(0.83) | TCGA-AA-3950-01 | Colorectum | colon adenocarcinoma | Female | >=65 | I/II | Unknown | Unknown | SD |
| CSAD | SNV | Missense_Mutation | c.517G>A | p.Gly173Arg | p.G173R | Q9Y600 | protein_coding | deleterious(0) | probably_damaging(1) | TCGA-AA-A02R-01 | Colorectum | colon adenocarcinoma | Female | >=65 | I/II | Unknown | Unknown | PD | |
| CSAD | SNV | Missense_Mutation | c.1375G>A | p.Glu459Lys | p.E459K | Q9Y600 | protein_coding | tolerated(0.45) | benign(0.009) | TCGA-G4-6309-01 | Colorectum | colon adenocarcinoma | Female | <65 | III/IV | Chemotherapy | xeloda | PD | |
| CSAD | SNV | Missense_Mutation | c.1363N>T | p.Pro455Ser | p.P455S | Q9Y600 | protein_coding | tolerated(0.1) | benign(0.173) | TCGA-G4-6588-01 | Colorectum | colon adenocarcinoma | Female | <65 | I/II | Unknown | Unknown | SD |
| Page: 1 2 3 4 5 6 |
Top |
Related drugs of malignant transformation related genes |
| Identification of chemicals and drugs interact with genes involved in malignant transfromation |
| (DGIdb 4.0) |
| Entrez ID | Symbol | Category | Interaction Types | Drug Claim Name | Drug Name | PMIDs |
| Page: 1 |

Copyright 2023-Present -The University of Texas Health Science Center at Houston |