Schematic overview of the cellular and molecular mechanisms involved in the cancer progression, including the proposed cellular and molecular mechanisms in cancer cells trajectory. AT1: alveolar type 1 cells; AT2: alveolar type 2 cells; AAH: atypical adenomatous hyperplasia; AIS: adenocarcinoma in situ; MIA: minimally invasive adenocarcinoma; IA: invasive adenocarcinoma; EMT: epithelial-mesenchymal transition

Home

Download

Statistics

Help

Contact

Center for Computational Systems Medicine
leaf

Gene summary

leaf

Malignant transformation analysis

leaf

Malignant transformation related pathway analysis

leaf

Cell-cell communication analysis

leaf

Single-cell gene regulatory network inference analysis

leaf

Somatic mutation of malignant transformation related genes

leaf

Related drugs of malignant transformation related genes

Gene: CS

Gene summary for CS

check button Gene summary.

Gene informationSpeciesHuman
Gene symbol

CS

Gene ID

1431

Gene namecitrate synthase
Gene AliasCS
Cytomap12q13.3
Gene Typeprotein-coding
GO ID

GO:0005975

UniProtAcc

A0A024RB75


Top

Malignant transformation analysis

check button Identification of the aberrant gene expression in precancerous and cancerous lesions by comparing the gene expression of stem-like cells in diseased tissues with normal stem cells
check button Malignant transformation involving gene list.
Entrez IDSymbolReplicatesSpeciesOrganTissueAdj P-valueLog2FCMalignancy
1431CSHTA11_2487_2000001011HumanColorectumSER2.84e-053.73e-01-0.1808
1431CSHTA11_1938_2000001011HumanColorectumAD2.11e-064.73e-01-0.0811
1431CSHTA11_78_2000001011HumanColorectumAD1.04e-136.24e-01-0.1088
1431CSHTA11_347_2000001011HumanColorectumAD2.50e-288.78e-01-0.1954
1431CSHTA11_83_2000001011HumanColorectumSER1.52e-137.87e-01-0.1526
1431CSHTA11_1391_2000001011HumanColorectumAD7.79e-084.96e-01-0.059
1431CSHTA11_2992_2000001011HumanColorectumSER1.92e-079.02e-01-0.1706
1431CSHTA11_5212_2000001011HumanColorectumAD2.63e-097.38e-01-0.2061
1431CSHTA11_5216_2000001011HumanColorectumSER6.87e-035.81e-01-0.1462
1431CSHTA11_546_2000001011HumanColorectumAD6.82e-045.04e-01-0.0842
1431CSHTA11_7862_2000001011HumanColorectumAD3.03e-032.82e-01-0.0179
1431CSHTA11_866_3004761011HumanColorectumAD4.55e-053.86e-010.096
1431CSHTA11_4255_2000001011HumanColorectumSER1.84e-035.03e-010.0446
1431CSHTA11_10623_2000001011HumanColorectumAD7.49e-065.48e-01-0.0177
1431CSHTA11_6801_2000001011HumanColorectumSER1.53e-099.32e-010.0171
1431CSHTA11_7696_3000711011HumanColorectumAD4.70e-085.56e-010.0674
1431CSHTA11_7469_2000001011HumanColorectumAD1.09e-047.52e-01-0.0124
1431CSHTA11_99999970781_79442HumanColorectumMSS1.81e-076.35e-010.294
1431CSHTA11_99999965062_69753HumanColorectumMSI-H1.77e-051.08e+000.3487
1431CSHTA11_99999965104_69814HumanColorectumMSS2.19e-217.57e-010.281
Page: 1 2 3 4 5 6 7 8 

check button Transcriptomic changes along malignancy continuum.
TissueExpression DynamicsAbbreviation
Colorectum (GSE201348)The image shows the transcriptomic changes along malignancy continuum.log2FC in expression of this searched gene in stem-like cells from each diseased tissue sample relative to stem-like cells in normal samples in each tissue plotted against the malignancy continuum. Samples are colored based on if they are from different disease stage.FAP: Familial adenomatous polyposis
CRC: Colorectal cancer
Colorectum (HTA11)The image shows the transcriptomic changes along malignancy continuum.log2FC in expression of this searched gene in stem-like cells from each diseased tissue sample relative to stem-like cells in normal samples in each tissue plotted against the malignancy continuum. Samples are colored based on if they are from different disease stage.AD: Adenomas
SER: Sessile serrated lesions
MSI-H: Microsatellite-high colorectal cancer
MSS: Microsatellite stable colorectal cancer
EsophagusThe image shows the transcriptomic changes along malignancy continuum.log2FC in expression of this searched gene in stem-like cells from each diseased tissue sample relative to stem-like cells in normal samples in each tissue plotted against the malignancy continuum. Samples are colored based on if they are from different disease stage.
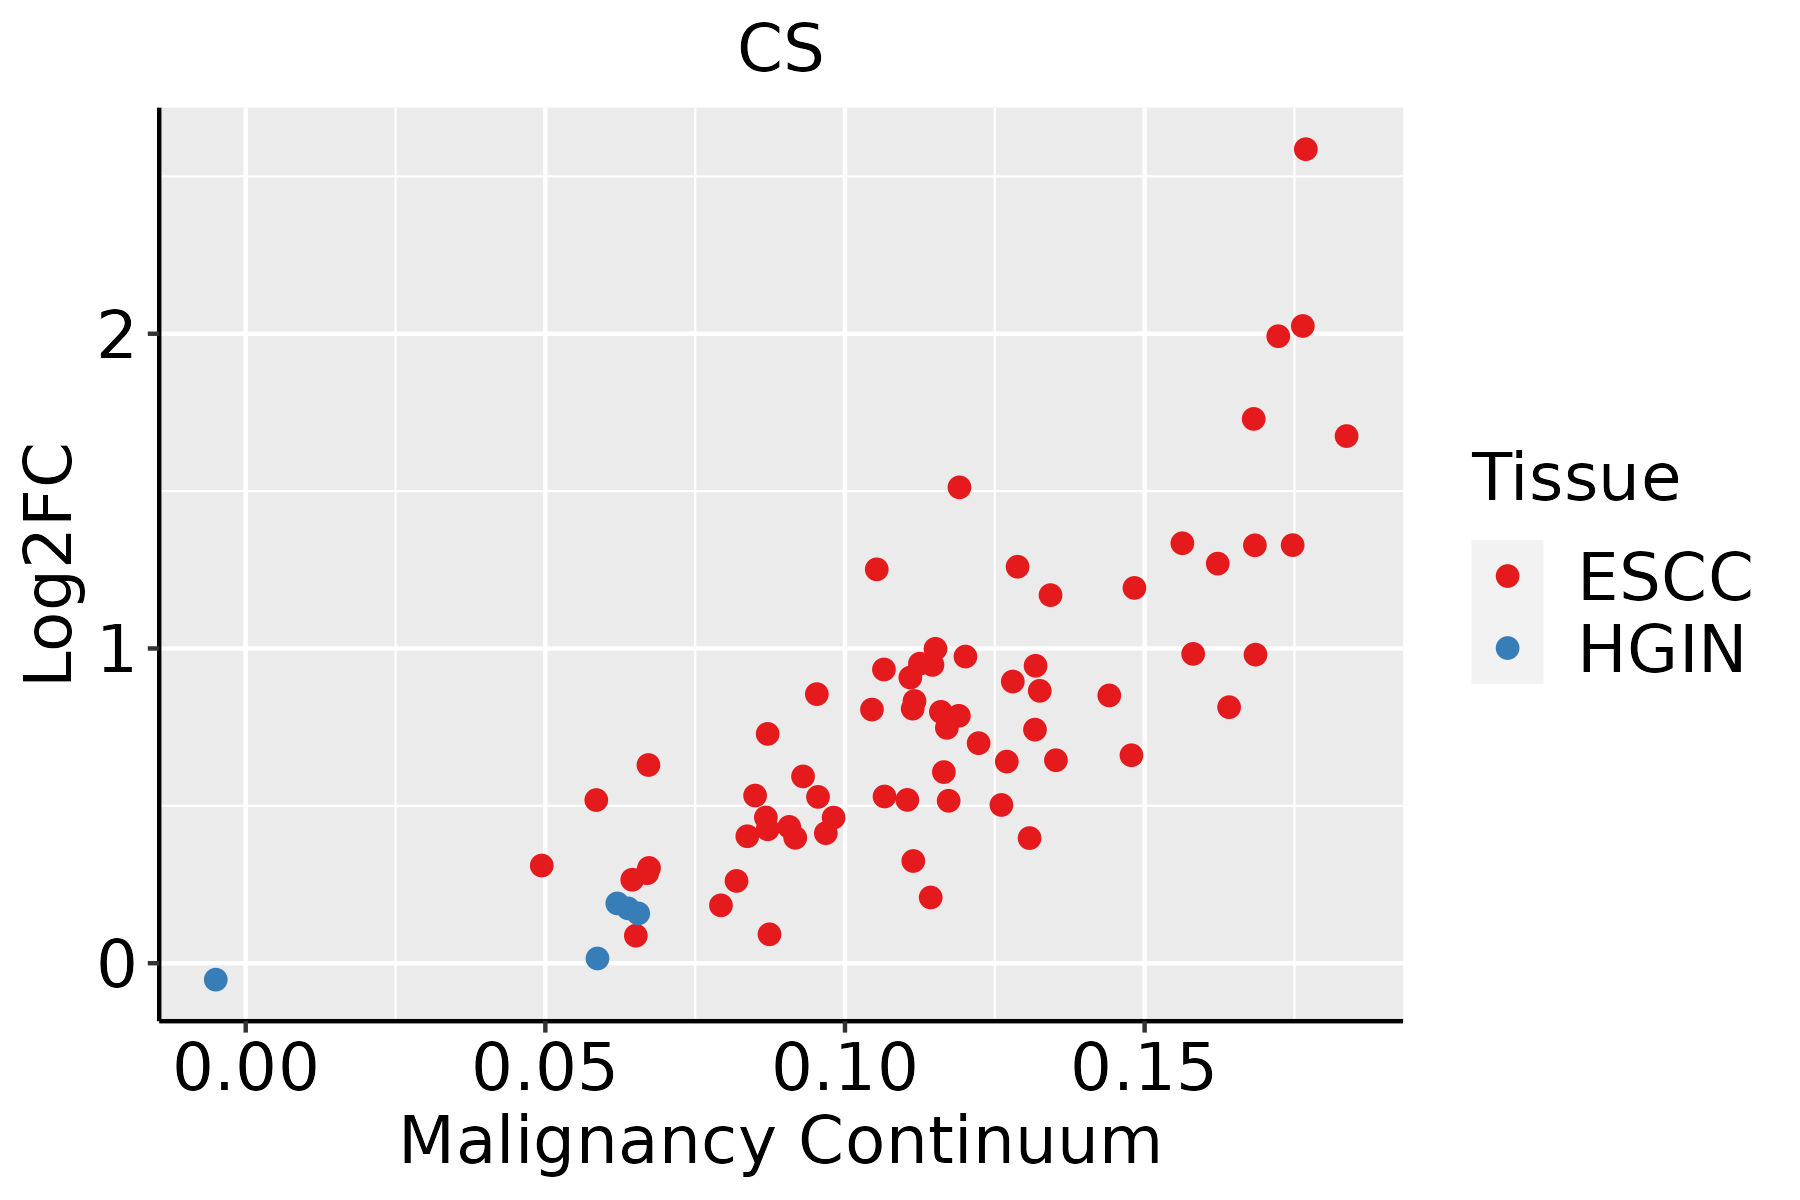
ESCC: Esophageal squamous cell carcinoma
HGIN: High-grade intraepithelial neoplasias
LGIN: Low-grade intraepithelial neoplasias
LiverThe image shows the transcriptomic changes along malignancy continuum.log2FC in expression of this searched gene in stem-like cells from each diseased tissue sample relative to stem-like cells in normal samples in each tissue plotted against the malignancy continuum. Samples are colored based on if they are from different disease stage.
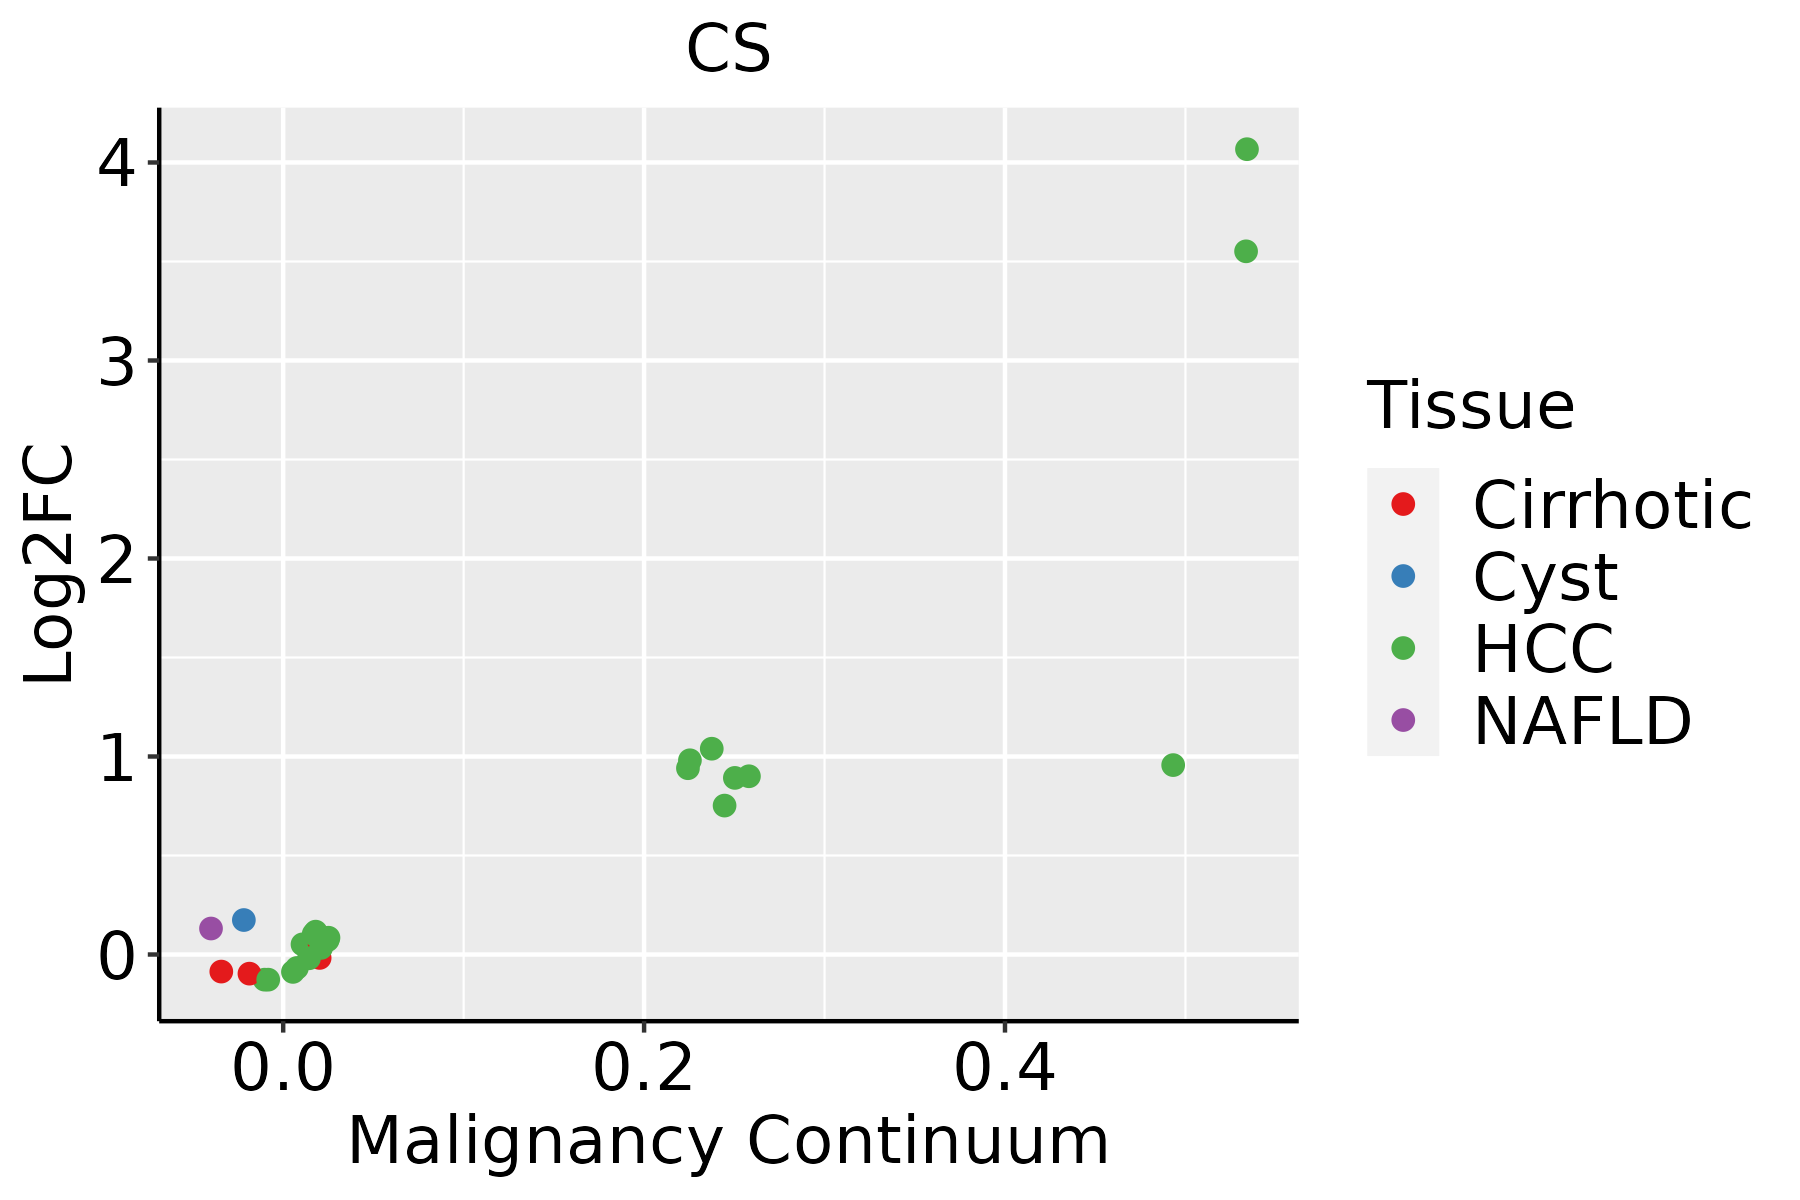
HCC: Hepatocellular carcinoma
NAFLD: Non-alcoholic fatty liver disease
Oral CavityThe image shows the transcriptomic changes along malignancy continuum.log2FC in expression of this searched gene in stem-like cells from each diseased tissue sample relative to stem-like cells in normal samples in each tissue plotted against the malignancy continuum. Samples are colored based on if they are from different disease stage.
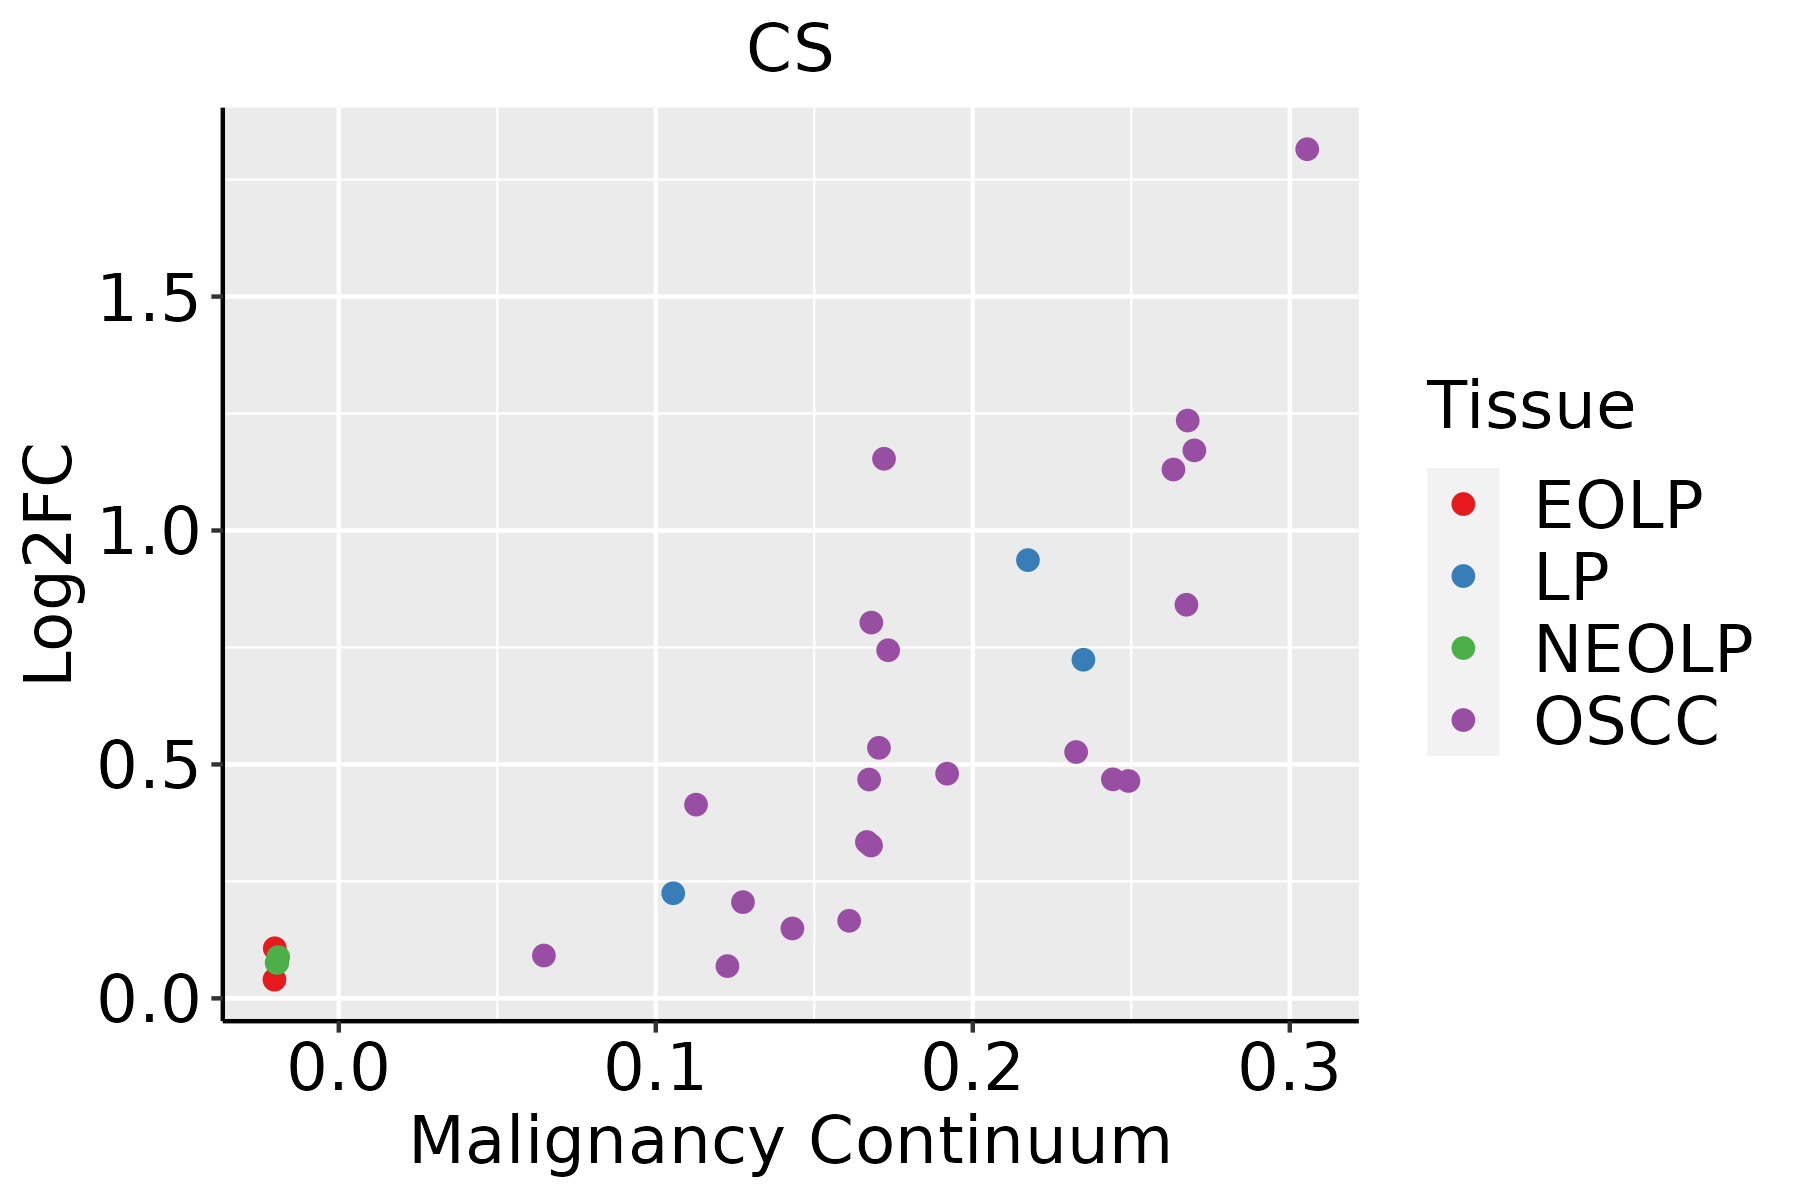
EOLP: Erosive Oral lichen planus
LP: leukoplakia
NEOLP: Non-erosive oral lichen planus
OSCC: Oral squamous cell carcinoma
SkinThe image shows the transcriptomic changes along malignancy continuum.log2FC in expression of this searched gene in stem-like cells from each diseased tissue sample relative to stem-like cells in normal samples in each tissue plotted against the malignancy continuum. Samples are colored based on if they are from different disease stage.
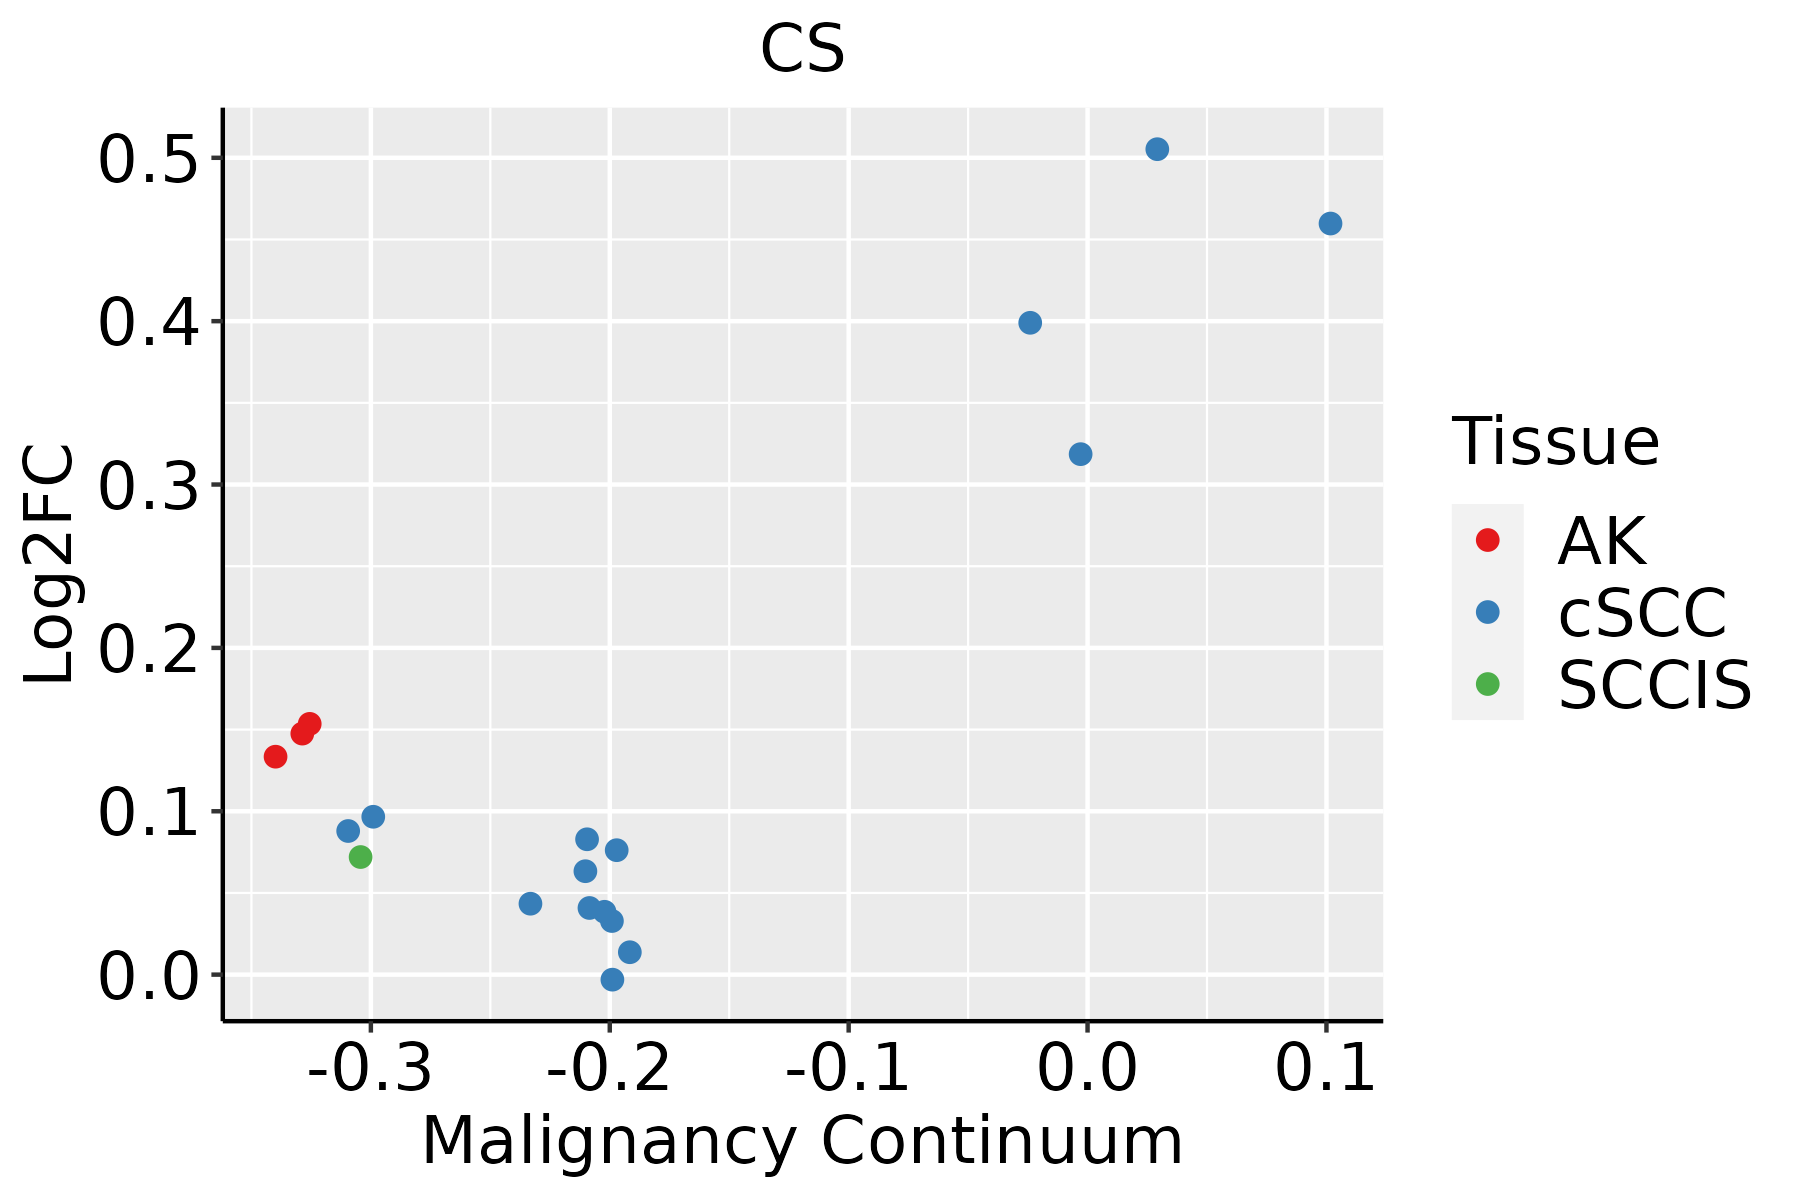
AK: Actinic keratosis
cSCC: Cutaneous squamous cell carcinoma
SCCIS:squamous cell carcinoma in situ
ThyroidThe image shows the transcriptomic changes along malignancy continuum.log2FC in expression of this searched gene in stem-like cells from each diseased tissue sample relative to stem-like cells in normal samples in each tissue plotted against the malignancy continuum. Samples are colored based on if they are from different disease stage.
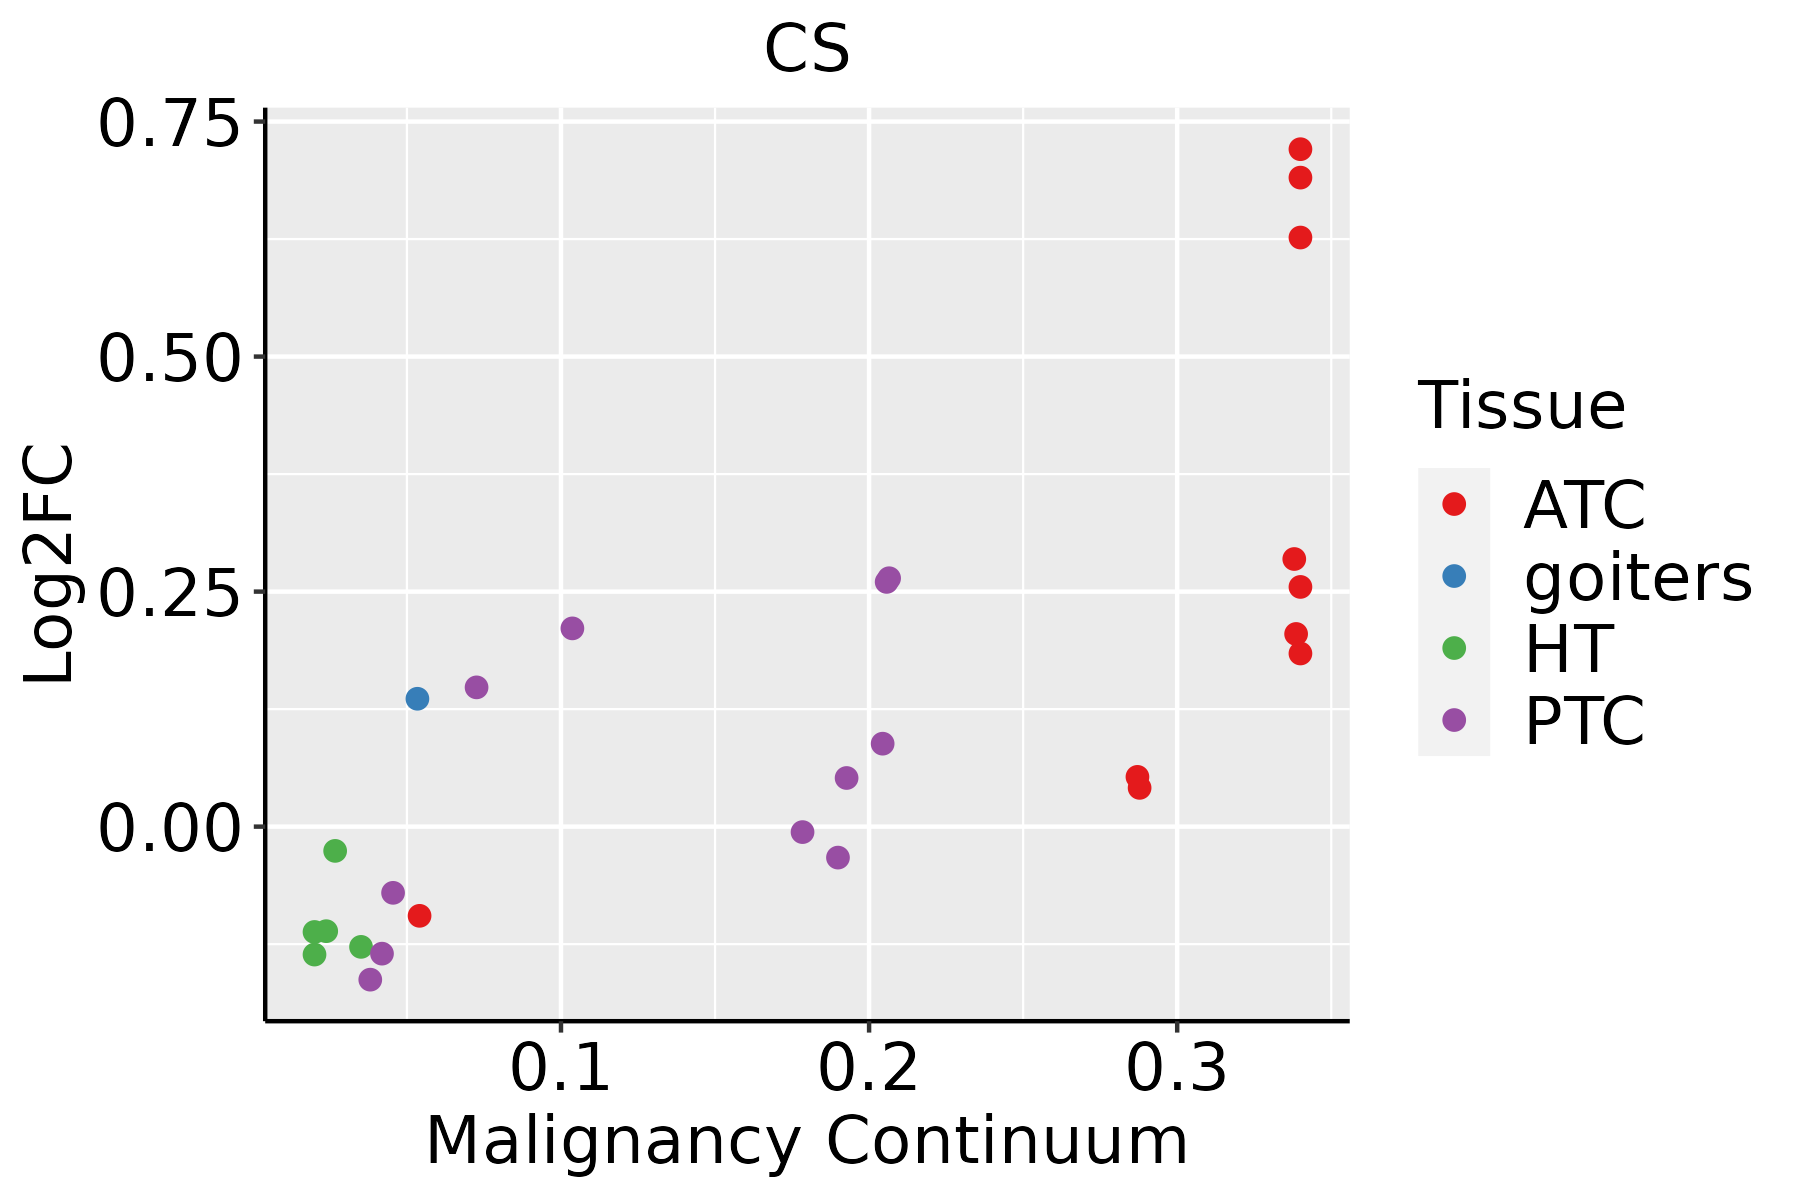
ATC: Anaplastic thyroid cancer
HT: Hashimoto's thyroiditis
PTC: Papillary thyroid cancer
∗log2FC in expression of this searched gene in stem-like cells from each diseased tissue sample relative to stem-like cells in normal samples in each tissue plotted against the malignancy continuum. Samples are colored based on if they are from different disease stage.

Top

Malignant transformation related pathway analysis

check buttonFind out the enriched GO biological processes and KEGG pathways involved in transition from healthy to precancer to cancer
check button Figure of enriched GO biological processes.
TissueDisease StageEnriched GO biological Processes
ColorectumADGO analysis - Figure of enriched GO biological processes: Top 15 enriched GO BP terms are showed in the bar plot of each disease state in each tissue. Each row represents a significant GO biological process which is colored according to the -log10(p.adjust).
ColorectumSERGO analysis - Figure of enriched GO biological processes: Top 15 enriched GO BP terms are showed in the bar plot of each disease state in each tissue. Each row represents a significant GO biological process which is colored according to the -log10(p.adjust).
ColorectumMSSGO analysis - Figure of enriched GO biological processes: Top 15 enriched GO BP terms are showed in the bar plot of each disease state in each tissue. Each row represents a significant GO biological process which is colored according to the -log10(p.adjust).
ColorectumMSI-HGO analysis - Figure of enriched GO biological processes: Top 15 enriched GO BP terms are showed in the bar plot of each disease state in each tissue. Each row represents a significant GO biological process which is colored according to the -log10(p.adjust).
ColorectumFAPGO analysis - Figure of enriched GO biological processes: Top 15 enriched GO BP terms are showed in the bar plot of each disease state in each tissue. Each row represents a significant GO biological process which is colored according to the -log10(p.adjust).
∗Top 15 enriched GO BP terms are showed in the bar plot of each disease state in each tissue. Each row represents a significant GO biological process which is colored according to the -log10(p.adjust).
Page: 1 2 3 4 5 6 7 8 9 

check button Enriched GO biological processes.
GO IDTissueDisease StageDescriptionGene RatioBg Ratiopvaluep.adjustCount
GO:00460349BreastPrecancerATP metabolic process82/1080277/187231.94e-365.19e-3382
GO:00061199BreastPrecanceroxidative phosphorylation53/1080141/187231.15e-292.04e-2653
GO:00090608BreastPrecanceraerobic respiration58/1080189/187235.69e-277.62e-2458
GO:00060918BreastPrecancergeneration of precursor metabolites and energy94/1080490/187231.54e-251.64e-2294
GO:00453338BreastPrecancercellular respiration59/1080230/187235.97e-235.32e-2059
GO:00159808BreastPrecancerenergy derivation by oxidation of organic compounds70/1080318/187238.33e-236.37e-2070
GO:00196468BreastPrecanceraerobic electron transport chain34/108087/187233.95e-202.64e-1734
GO:00427738BreastPrecancerATP synthesis coupled electron transport35/108095/187231.08e-195.76e-1735
GO:00427758BreastPrecancermitochondrial ATP synthesis coupled electron transport35/108095/187231.08e-195.76e-1735
GO:20012339BreastPrecancerregulation of apoptotic signaling pathway65/1080356/187237.70e-173.17e-1465
GO:00229048BreastPrecancerrespiratory electron transport chain35/1080114/187238.51e-173.26e-1435
GO:00229008BreastPrecancerelectron transport chain42/1080175/187231.37e-154.59e-1342
GO:00525479BreastPrecancerregulation of peptidase activity71/1080461/187232.72e-146.94e-1271
GO:00525489BreastPrecancerregulation of endopeptidase activity67/1080432/187231.06e-132.36e-1167
GO:00064578BreastPrecancerprotein folding43/1080212/187233.48e-137.45e-1143
GO:00064138BreastPrecancertranslational initiation30/1080118/187233.23e-125.58e-1030
GO:00064179BreastPrecancerregulation of translation67/1080468/187234.71e-127.64e-1067
GO:20001169BreastPrecancerregulation of cysteine-type endopeptidase activity43/1080235/187231.30e-111.83e-0943
GO:00432819BreastPrecancerregulation of cysteine-type endopeptidase activity involved in apoptotic process40/1080209/187231.59e-112.07e-0940
GO:00160329BreastPrecancerviral process58/1080415/187233.42e-103.16e-0858
Page: 1 2 3 4 5 6 7 8 9 10 11 12 13 14 15 16 17 18 19 20 21 22 23 24 25 26 27 28 29 30 31 32 33 34 35 36 37 38 39 40 41 42 43 44 45 46 47 48 49 50 51 52 53 54 55 56 57 58 59 60 61 62 63 64 65 66 67 68 69 70 71 72 73 74 75 76 77 78 79 80 81 82 83 84 85 86 87 88 89 90 91 92 93 94 95 96 97 98 99 100 101 102 103 104 105 106 107 108 109 110 111 112 113 114 115 116 117 118 119 120 121 122 123 124 125 126 127 128 129 130 131 132 133 134 135 136 137 138 139 140 141 142 143 144 145 146 147 148 149 150 151 152 153 154 155 156 157 158 159 160 161 162 163 164 165 166 167 168 169 170 171 172 173 174 175 176 177 178 179 180 181 182 183 184 185 186 187 188 189 190 191 192 193 194 195 196 197 198 199 200 201 202 203 204 205 206 207 208 209 210 211 212 213 214 215 216 217 218 219 220 221 222 223 224 225 226 227 228 229 230 231 232 233 234 235 236 237 238 239 240 241 242 243 244 245 246 247 248 249 250 251 252 253 254 255 256 257 258 259 260 261 262 263 264 265 266 267 268 269 270 271 272 273 274 275 276 277 278 279 280 281 282 283 284 285 286 287 288 289 290 291 292 293 294 295 296 297 298 299 300 301 302 303 304 305 306 307 308 309 310 311 312 313 314 315 316 317 318 319 320 321 322 323 324 325 326 327 328 329 330 331 332 333 334 335 336 337 338 339 340 341 342 343 344 345 346 347 348 349 350 351 352 353 354 355 356 357 358 359 360 361 362 363 364 365 366 367 368 369 370 371 372 373 374 375 376 377 378 379 380 381 382 383 384 385 386 387 388 389 390 391 392 393 394 395 396 397 398 399 400 401 402 403 404 405 406 407 408 409 410 411 412 413 414 415 416 417 418 419 420 421 422 423 424 425 426 427 428 429 430 431 432 433 434 435 436 437 438 439 440 441 442 443 444 445 446 447 448 449 450 451 452 453 454 455 456 457 

check button Enriched KEGG pathways.
Pathway IDTissueDisease StageDescriptionGene RatioBg Ratiopvaluep.adjustqvalueCount
hsa01200ColorectumADCarbon metabolism55/2092115/84655.53e-088.42e-075.37e-0755
hsa00020ColorectumADCitrate cycle (TCA cycle)20/209230/84651.43e-061.77e-051.13e-0520
hsa00630ColorectumADGlyoxylate and dicarboxylate metabolism14/209230/84657.25e-032.97e-021.89e-0214
hsa01230ColorectumADBiosynthesis of amino acids28/209275/84659.99e-033.89e-022.48e-0228
hsa012001ColorectumADCarbon metabolism55/2092115/84655.53e-088.42e-075.37e-0755
hsa000201ColorectumADCitrate cycle (TCA cycle)20/209230/84651.43e-061.77e-051.13e-0520
hsa006301ColorectumADGlyoxylate and dicarboxylate metabolism14/209230/84657.25e-032.97e-021.89e-0214
hsa012301ColorectumADBiosynthesis of amino acids28/209275/84659.99e-033.89e-022.48e-0228
hsa012002ColorectumSERCarbon metabolism40/1580115/84652.77e-053.41e-042.47e-0440
hsa012302ColorectumSERBiosynthesis of amino acids23/158075/84658.11e-034.14e-023.01e-0223
hsa012003ColorectumSERCarbon metabolism40/1580115/84652.77e-053.41e-042.47e-0440
hsa012303ColorectumSERBiosynthesis of amino acids23/158075/84658.11e-034.14e-023.01e-0223
hsa012004ColorectumMSSCarbon metabolism43/1875115/84651.37e-041.17e-037.19e-0443
hsa012005ColorectumMSSCarbon metabolism43/1875115/84651.37e-041.17e-037.19e-0443
hsa006302ColorectumMSI-HGlyoxylate and dicarboxylate metabolism8/79730/84655.34e-034.94e-024.14e-028
hsa006303ColorectumMSI-HGlyoxylate and dicarboxylate metabolism8/79730/84655.34e-034.94e-024.14e-028
hsa012006ColorectumFAPCarbon metabolism38/1404115/84651.04e-051.44e-048.76e-0538
hsa000206ColorectumFAPCitrate cycle (TCA cycle)14/140430/84651.16e-041.02e-036.21e-0414
hsa012007ColorectumFAPCarbon metabolism38/1404115/84651.04e-051.44e-048.76e-0538
hsa000207ColorectumFAPCitrate cycle (TCA cycle)14/140430/84651.16e-041.02e-036.21e-0414
Page: 1 2 3 

Top

Cell-cell communication analysis

check buttonIdentification of potential cell-cell interactions between two cell types and their ligand-receptor pairs for different disease states
LigandReceptorLRpairPathwayTissueDisease Stage
CSF1CSF1RCSF1_CSF1RCSFBreastDCIS
CSF3CSF3RCSF3_CSF3RCSF3BreastHealthy
CSF3CSF3RCSF3_CSF3RCSF3CervixADJ
ULBP1KLRK1_HCSTULBP1_KLRK1_HCSTNKG2DCervixADJ
CSF1CSF1RCSF1_CSF1RCSFCervixADJ
CSF3CSF3RCSF3_CSF3RCSF3CervixCC
IL34CSF1RIL34_CSF1RCSFCervixCC
CSF1CSF1RCSF1_CSF1RCSFCervixCC
CSF3CSF3RCSF3_CSF3RCSF3CervixHealthy
CSF1CSF1RCSF1_CSF1RCSFCervixPrecancer
IL34CSF1RIL34_CSF1RCSFCRCAD
CSF1CSF1RCSF1_CSF1RCSFCRCAD
CSF1CSF1RCSF1_CSF1RCSFCRCADJ
CSF1CSF1RCSF1_CSF1RCSFCRCMSI-H
CSF1CSF1RCSF1_CSF1RCSFCRCSER
CSF1CSF1RCSF1_CSF1RCSFEndometriumADJ
CSF1CSF1RCSF1_CSF1RCSFEndometriumAEH
CSF3CSF3RCSF3_CSF3RCSF3EndometriumEEC
CSF1CSF1RCSF1_CSF1RCSFEndometriumEEC
CSF1CSF1RCSF1_CSF1RCSFEndometriumHealthy
Page: 1 

Top

Single-cell gene regulatory network inference analysis

check buttonFind out the significant the regulons (TFs) and the target genes of each regulon across cell types for different disease states
TFCell TypeTissueDisease StageTarget GeneRSSRegulon Activity
∗The dot plots of a searched regulon are shown for all cell subpopulations in each disease state of each tissue based on the regulon specific score inferred using pySCENIC and by calculating the average expression.
Page: 1 

Top

Somatic mutation of malignant transformation related genes

check buttonAnnotation of somatic variants for genes involved in malignant transformation
Hugo SymbolVariant ClassVariant ClassificationdbSNP RSHGVScHGVSpHGVSp ShortSWISSPROTBIOTYPESIFTPolyPhenTumor Sample BarcodeTissueHistologySexAgeStageTherapy TypesDrugsOutcome
CSSNVMissense_Mutationc.964N>Cp.Asp322Hisp.D322HO75390protein_codingtolerated(0.05)benign(0.021)TCGA-A2-A0CX-01Breastbreast invasive carcinomaFemale<65I/IIChemotherapyadriamycinSD
CSSNVMissense_Mutationnovelc.1363N>Cp.Glu455Glnp.E455QO75390protein_codingtolerated(0.18)benign(0.04)TCGA-AC-A5XS-01Breastbreast invasive carcinomaFemale>=65I/IIHormone TherapyfemaraSD
CSSNVMissense_Mutationnovelc.820N>Cp.Thr274Prop.T274PO75390protein_codingdeleterious(0.03)probably_damaging(0.976)TCGA-D8-A1JM-01Breastbreast invasive carcinomaFemale<65I/IIChemotherapyHormone TherapydoxorubicineSD
CSinsertionFrame_Shift_Insnovelc.323_324insCAGTCAGTCATp.Lys109SerfsTer20p.K109Sfs*20O75390protein_codingTCGA-A8-A06P-01Breastbreast invasive carcinomaFemale<65III/IVUnspecificSD
CSinsertionIn_Frame_Insnovelc.321_322insTCTAGGAGGACTAATp.Lys107_Ala108insSerArgArgThrAsnp.K107_A108insSRRTNO75390protein_codingTCGA-A8-A06P-01Breastbreast invasive carcinomaFemale<65III/IVUnspecificSD
CSSNVMissense_Mutationnovelc.1374G>Tp.Met458Ilep.M458IO75390protein_codingtolerated(0.31)benign(0)TCGA-VS-A9UP-01Cervixcervical & endocervical cancerFemale<65I/IIChemotherapycisplatinPD
CSSNVMissense_Mutationc.91N>Gp.Thr31Alap.T31AO75390protein_codingtolerated(0.54)benign(0)TCGA-A6-2686-01Colorectumcolon adenocarcinomaFemale>=65I/IIUnknownUnknownSD
CSSNVMissense_Mutationc.1327N>Tp.Gly443Cysp.G443CO75390protein_codingdeleterious(0)probably_damaging(0.998)TCGA-AD-5900-01Colorectumcolon adenocarcinomaMale>=65I/IIUnknownUnknownSD
CSSNVMissense_Mutationrs779289848c.274N>Tp.Arg92Cysp.R92CO75390protein_codingdeleterious(0.03)benign(0.154)TCGA-AZ-4615-01Colorectumcolon adenocarcinomaMale>=65III/IVChemotherapyxelodaPD
CSSNVMissense_Mutationrs140943640c.370G>Ap.Val124Ilep.V124IO75390protein_codingtolerated(0.08)benign(0.011)TCGA-CK-4951-01Colorectumcolon adenocarcinomaFemale>=65I/IIUnknownUnknownPD
Page: 1 2 3 4 5 

Top

Related drugs of malignant transformation related genes

check buttonIdentification of chemicals and drugs interact with genes involved in malignant transfromation
(DGIdb 4.0)
Entrez IDSymbolCategoryInteraction TypesDrug Claim NameDrug NamePMIDs
Page: 1