
|
|||||
|
 | |
| |
| |
| |
| |
| |
|
Gene: CRYZ |
Gene summary for CRYZ |
| Gene information | Species | Human | Gene symbol | CRYZ | Gene ID | 1429 |
| Gene name | crystallin zeta | |
| Gene Alias | CRYZ | |
| Cytomap | 1p31.1 | |
| Gene Type | protein-coding | GO ID | GO:0003008 | UniProtAcc | Q08257 |
Top |
Malignant transformation analysis |
| Identification of the aberrant gene expression in precancerous and cancerous lesions by comparing the gene expression of stem-like cells in diseased tissues with normal stem cells |
| Entrez ID | Symbol | Replicates | Species | Organ | Tissue | Adj P-value | Log2FC | Malignancy |
| 1429 | CRYZ | LZE4T | Human | Esophagus | ESCC | 2.49e-02 | 8.83e-02 | 0.0811 |
| 1429 | CRYZ | LZE24T | Human | Esophagus | ESCC | 2.31e-08 | 5.76e-02 | 0.0596 |
| 1429 | CRYZ | P1T-E | Human | Esophagus | ESCC | 8.73e-03 | 1.07e-01 | 0.0875 |
| 1429 | CRYZ | P2T-E | Human | Esophagus | ESCC | 2.74e-23 | 4.51e-01 | 0.1177 |
| 1429 | CRYZ | P4T-E | Human | Esophagus | ESCC | 6.49e-19 | 5.10e-01 | 0.1323 |
| 1429 | CRYZ | P5T-E | Human | Esophagus | ESCC | 3.75e-03 | 5.05e-02 | 0.1327 |
| 1429 | CRYZ | P8T-E | Human | Esophagus | ESCC | 4.11e-09 | 1.65e-01 | 0.0889 |
| 1429 | CRYZ | P9T-E | Human | Esophagus | ESCC | 1.67e-03 | 8.73e-02 | 0.1131 |
| 1429 | CRYZ | P10T-E | Human | Esophagus | ESCC | 1.23e-14 | 2.55e-01 | 0.116 |
| 1429 | CRYZ | P11T-E | Human | Esophagus | ESCC | 7.54e-07 | 2.15e-01 | 0.1426 |
| 1429 | CRYZ | P12T-E | Human | Esophagus | ESCC | 1.70e-23 | 2.86e-01 | 0.1122 |
| 1429 | CRYZ | P15T-E | Human | Esophagus | ESCC | 3.91e-06 | -1.12e-02 | 0.1149 |
| 1429 | CRYZ | P16T-E | Human | Esophagus | ESCC | 2.08e-20 | 2.16e-01 | 0.1153 |
| 1429 | CRYZ | P17T-E | Human | Esophagus | ESCC | 7.79e-04 | 1.35e-01 | 0.1278 |
| 1429 | CRYZ | P19T-E | Human | Esophagus | ESCC | 7.67e-06 | 5.87e-01 | 0.1662 |
| 1429 | CRYZ | P20T-E | Human | Esophagus | ESCC | 4.99e-07 | 1.79e-01 | 0.1124 |
| 1429 | CRYZ | P21T-E | Human | Esophagus | ESCC | 7.70e-35 | 7.97e-01 | 0.1617 |
| 1429 | CRYZ | P22T-E | Human | Esophagus | ESCC | 7.20e-05 | -6.21e-03 | 0.1236 |
| 1429 | CRYZ | P23T-E | Human | Esophagus | ESCC | 2.24e-08 | 1.76e-01 | 0.108 |
| 1429 | CRYZ | P24T-E | Human | Esophagus | ESCC | 5.07e-10 | 1.51e-01 | 0.1287 |
| Page: 1 2 3 4 |
| Tissue | Expression Dynamics | Abbreviation |
| Esophagus | 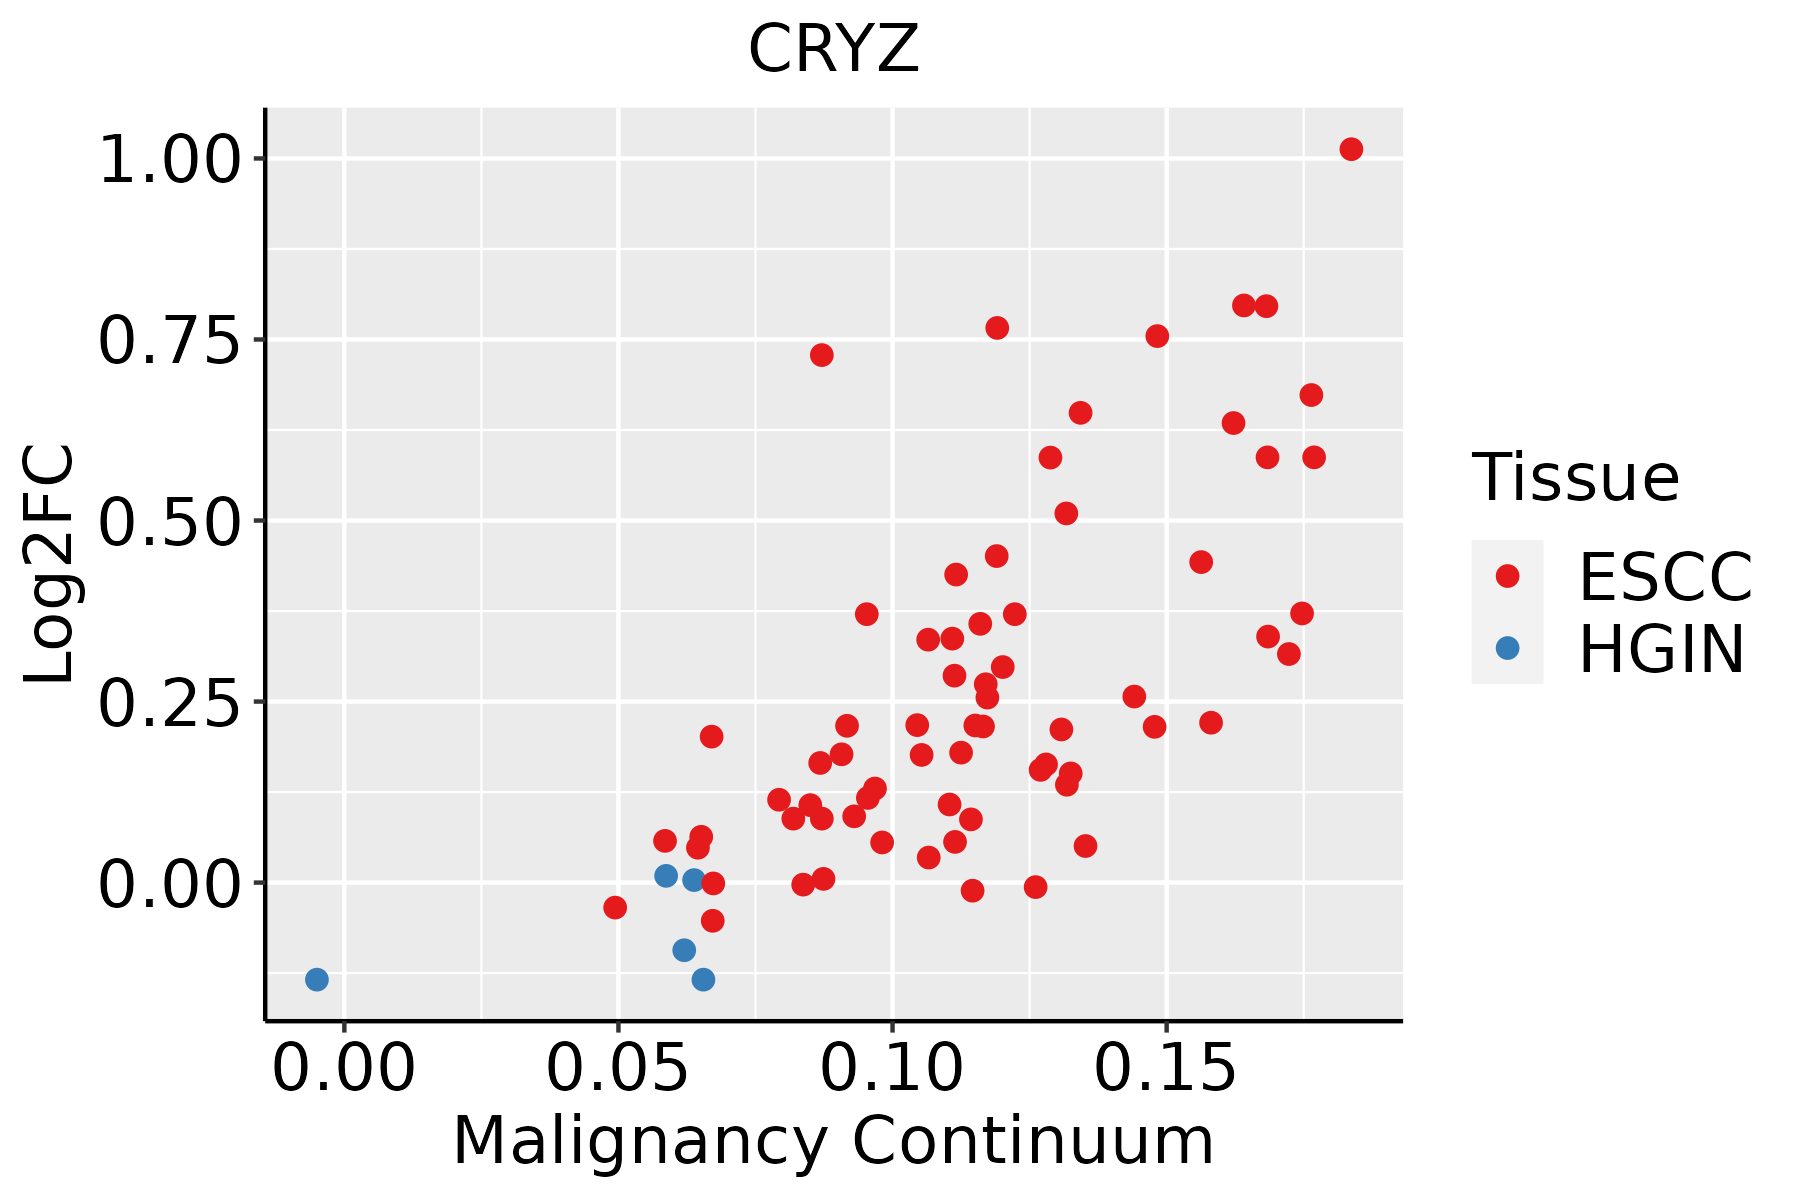 | ESCC: Esophageal squamous cell carcinoma |
| HGIN: High-grade intraepithelial neoplasias | ||
| LGIN: Low-grade intraepithelial neoplasias | ||
| Liver | 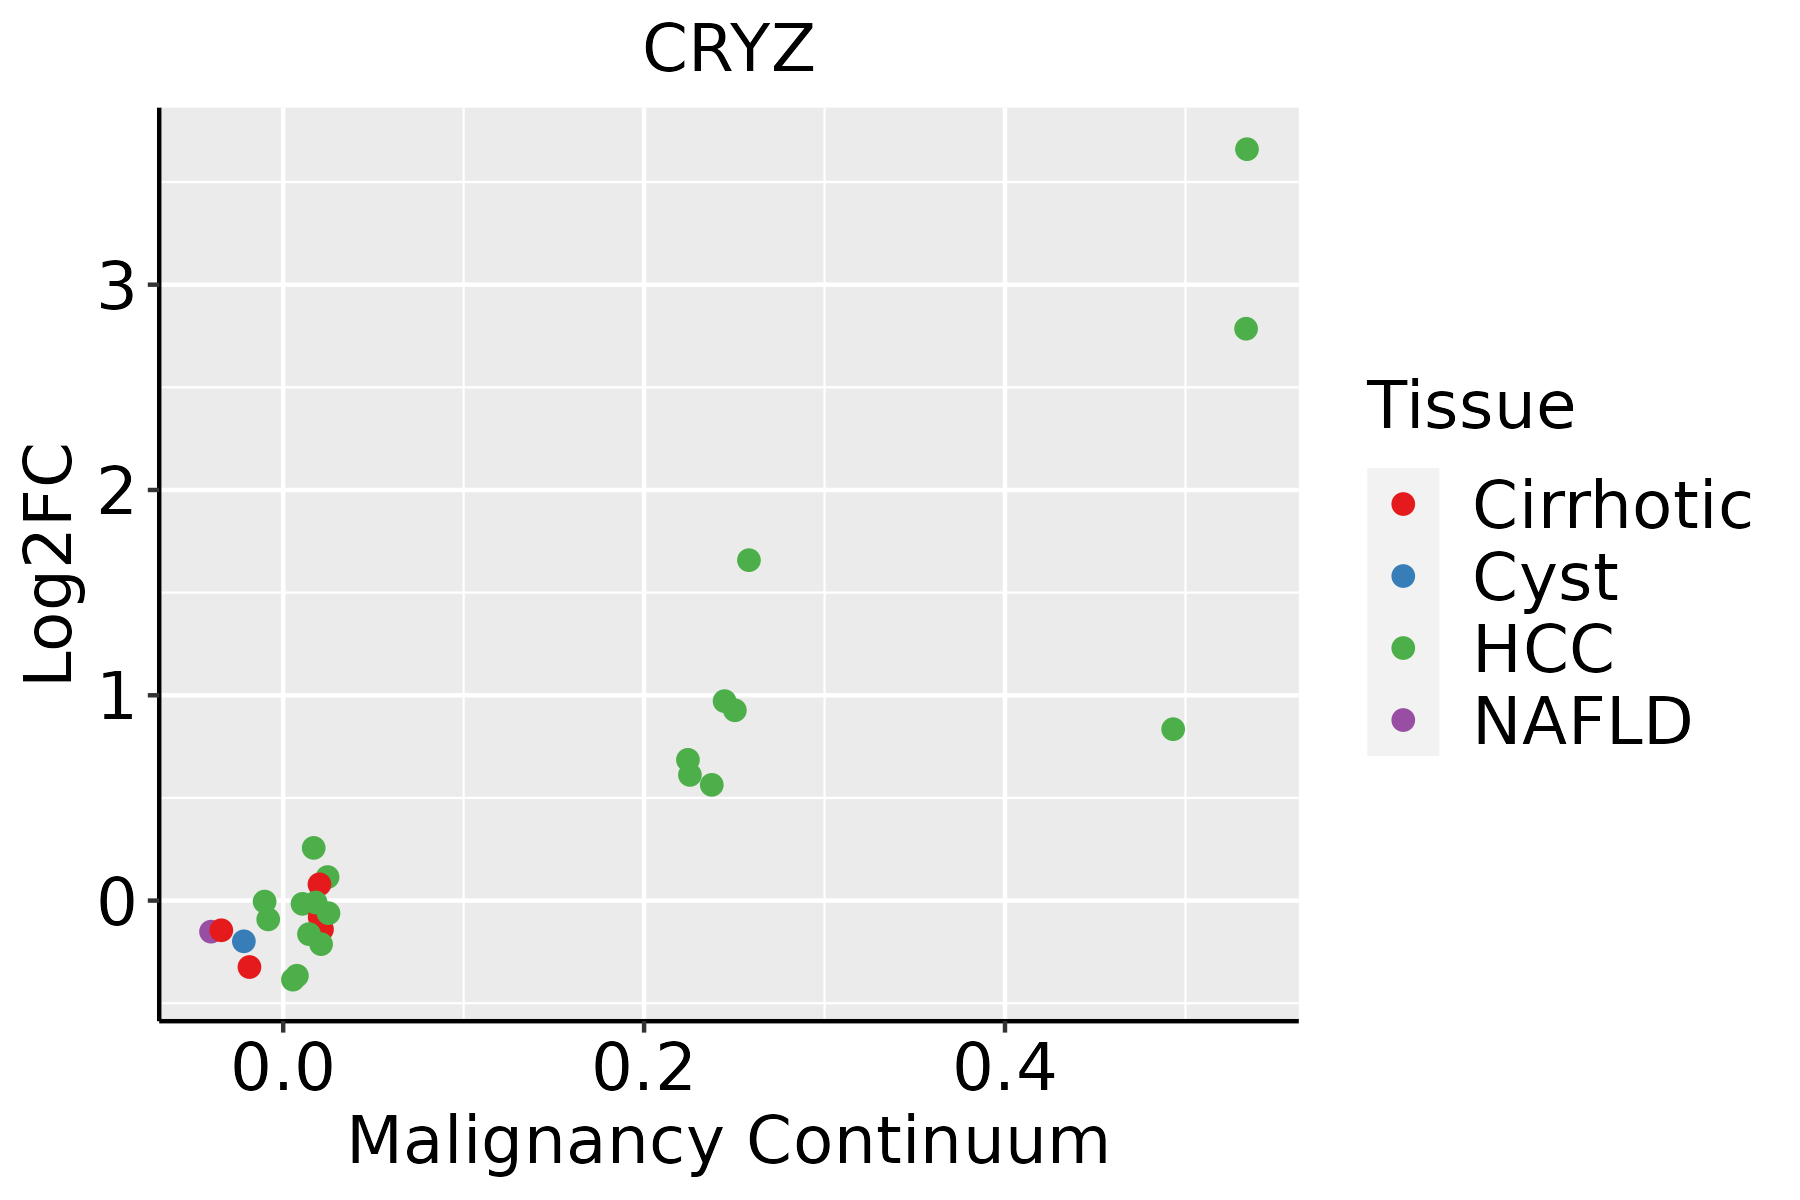 | HCC: Hepatocellular carcinoma |
| NAFLD: Non-alcoholic fatty liver disease | ||
| Oral Cavity | 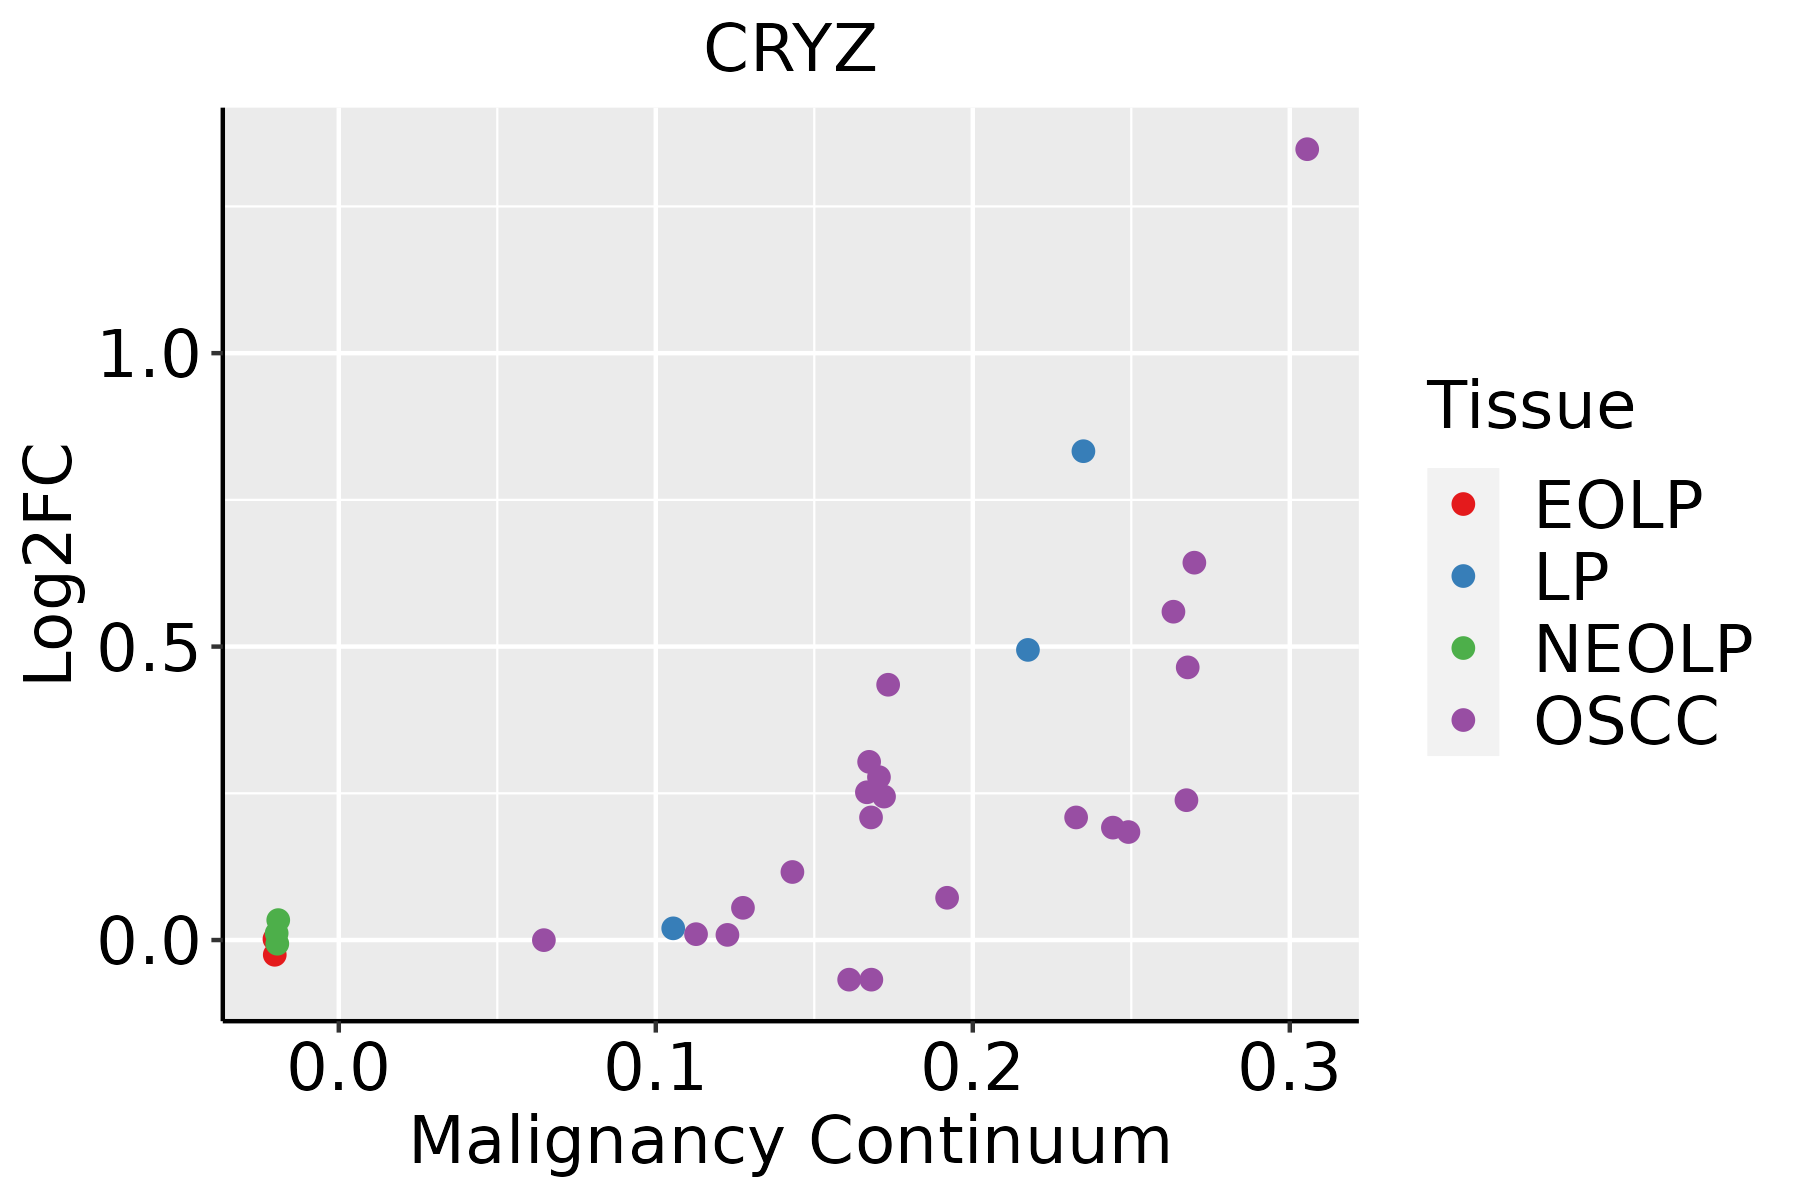 | EOLP: Erosive Oral lichen planus |
| LP: leukoplakia | ||
| NEOLP: Non-erosive oral lichen planus | ||
| OSCC: Oral squamous cell carcinoma |
| ∗log2FC in expression of this searched gene in stem-like cells from each diseased tissue sample relative to stem-like cells in normal samples in each tissue plotted against the malignancy continuum. Samples are colored based on if they are from different disease stage. |
Top |
Malignant transformation related pathway analysis |
| Find out the enriched GO biological processes and KEGG pathways involved in transition from healthy to precancer to cancer |
| Tissue | Disease Stage | Enriched GO biological Processes |
| Colorectum | AD |  |
| Colorectum | SER |  |
| Colorectum | MSS |  |
| Colorectum | MSI-H |  |
| Colorectum | FAP |  |
| ∗Top 15 enriched GO BP terms are showed in the bar plot of each disease state in each tissue. Each row represents a significant GO biological process which is colored according to the -log10(p.adjust). |
| Page: 1 2 3 4 5 6 7 8 9 |
| GO ID | Tissue | Disease Stage | Description | Gene Ratio | Bg Ratio | pvalue | p.adjust | Count |
| GO:190166112 | Esophagus | ESCC | quinone metabolic process | 34/8552 | 40/18723 | 3.00e-07 | 4.27e-06 | 34 |
| GO:000941020 | Esophagus | ESCC | response to xenobiotic stimulus | 253/8552 | 462/18723 | 4.55e-05 | 3.58e-04 | 253 |
| GO:00421805 | Esophagus | ESCC | cellular ketone metabolic process | 120/8552 | 211/18723 | 6.70e-04 | 3.55e-03 | 120 |
| GO:00512623 | Esophagus | ESCC | protein tetramerization | 54/8552 | 87/18723 | 1.50e-03 | 7.06e-03 | 54 |
| GO:00512592 | Esophagus | ESCC | protein complex oligomerization | 130/8552 | 238/18723 | 3.29e-03 | 1.36e-02 | 130 |
| GO:000941012 | Liver | Cirrhotic | response to xenobiotic stimulus | 165/4634 | 462/18723 | 6.82e-08 | 2.09e-06 | 165 |
| GO:00714661 | Liver | Cirrhotic | cellular response to xenobiotic stimulus | 66/4634 | 177/18723 | 1.34e-04 | 1.31e-03 | 66 |
| GO:000680511 | Liver | Cirrhotic | xenobiotic metabolic process | 43/4634 | 111/18723 | 7.51e-04 | 5.54e-03 | 43 |
| GO:0042178 | Liver | Cirrhotic | xenobiotic catabolic process | 17/4634 | 37/18723 | 4.02e-03 | 2.17e-02 | 17 |
| GO:000941022 | Liver | HCC | response to xenobiotic stimulus | 248/7958 | 462/18723 | 6.47e-07 | 1.02e-05 | 248 |
| GO:0051262 | Liver | HCC | protein tetramerization | 50/7958 | 87/18723 | 3.42e-03 | 1.55e-02 | 50 |
| GO:00714662 | Liver | HCC | cellular response to xenobiotic stimulus | 93/7958 | 177/18723 | 4.35e-03 | 1.89e-02 | 93 |
| GO:0051289 | Liver | HCC | protein homotetramerization | 33/7958 | 57/18723 | 1.37e-02 | 4.86e-02 | 33 |
| GO:19016613 | Oral cavity | OSCC | quinone metabolic process | 32/7305 | 40/18723 | 1.40e-07 | 2.34e-06 | 32 |
| GO:00421804 | Oral cavity | OSCC | cellular ketone metabolic process | 111/7305 | 211/18723 | 3.94e-05 | 3.45e-04 | 111 |
| GO:000941018 | Oral cavity | OSCC | response to xenobiotic stimulus | 222/7305 | 462/18723 | 4.00e-05 | 3.48e-04 | 222 |
| GO:0051259 | Oral cavity | OSCC | protein complex oligomerization | 121/7305 | 238/18723 | 1.29e-04 | 9.21e-04 | 121 |
| GO:00512622 | Oral cavity | OSCC | protein tetramerization | 48/7305 | 87/18723 | 1.60e-03 | 7.62e-03 | 48 |
| GO:190166111 | Oral cavity | LP | quinone metabolic process | 24/4623 | 40/18723 | 2.17e-06 | 4.85e-05 | 24 |
| GO:00512591 | Oral cavity | LP | protein complex oligomerization | 85/4623 | 238/18723 | 8.81e-05 | 1.11e-03 | 85 |
| Page: 1 2 |
| Pathway ID | Tissue | Disease Stage | Description | Gene Ratio | Bg Ratio | pvalue | p.adjust | qvalue | Count |
| Page: 1 |
Top |
Cell-cell communication analysis |
| Identification of potential cell-cell interactions between two cell types and their ligand-receptor pairs for different disease states |
| Ligand | Receptor | LRpair | Pathway | Tissue | Disease Stage |
| Page: 1 |
Top |
Single-cell gene regulatory network inference analysis |
| Find out the significant the regulons (TFs) and the target genes of each regulon across cell types for different disease states |
| TF | Cell Type | Tissue | Disease Stage | Target Gene | RSS | Regulon Activity |
| ∗The dot plots of a searched regulon are shown for all cell subpopulations in each disease state of each tissue based on the regulon specific score inferred using pySCENIC and by calculating the average expression. |
| Page: 1 |
Top |
Somatic mutation of malignant transformation related genes |
| Annotation of somatic variants for genes involved in malignant transformation |
| Hugo Symbol | Variant Class | Variant Classification | dbSNP RS | HGVSc | HGVSp | HGVSp Short | SWISSPROT | BIOTYPE | SIFT | PolyPhen | Tumor Sample Barcode | Tissue | Histology | Sex | Age | Stage | Therapy Types | Drugs | Outcome |
| CRYZ | SNV | Missense_Mutation | novel | c.434N>C | p.Cys145Ser | p.C145S | Q08257 | protein_coding | tolerated(0.51) | benign(0) | TCGA-GM-A3XL-01 | Breast | breast invasive carcinoma | Female | <65 | I/II | Chemotherapy | fluorouracil | CR |
| CRYZ | SNV | Missense_Mutation | c.916G>A | p.Glu306Lys | p.E306K | Q08257 | protein_coding | tolerated(0.1) | benign(0.031) | TCGA-C5-A3HE-01 | Cervix | cervical & endocervical cancer | Female | <65 | I/II | Unknown | Unknown | PD | |
| CRYZ | SNV | Missense_Mutation | novel | c.949N>T | p.His317Tyr | p.H317Y | Q08257 | protein_coding | tolerated(0.06) | benign(0.015) | TCGA-VS-A959-01 | Cervix | cervical & endocervical cancer | Female | >=65 | I/II | Unknown | Unknown | SD |
| CRYZ | SNV | Missense_Mutation | c.388N>A | p.Gly130Ser | p.G130S | Q08257 | protein_coding | deleterious(0.02) | benign(0.303) | TCGA-A6-3809-01 | Colorectum | colon adenocarcinoma | Female | >=65 | I/II | Unknown | Unknown | SD | |
| CRYZ | SNV | Missense_Mutation | c.608N>C | p.Val203Ala | p.V203A | Q08257 | protein_coding | tolerated(0.73) | benign(0) | TCGA-AA-3815-01 | Colorectum | colon adenocarcinoma | Female | >=65 | I/II | Unknown | Unknown | SD | |
| CRYZ | SNV | Missense_Mutation | novel | c.929A>C | p.Glu310Ala | p.E310A | Q08257 | protein_coding | tolerated(0.25) | benign(0.007) | TCGA-AA-3949-01 | Colorectum | colon adenocarcinoma | Female | >=65 | III/IV | Unknown | Unknown | SD |
| CRYZ | SNV | Missense_Mutation | c.522N>T | p.Leu174Phe | p.L174F | Q08257 | protein_coding | tolerated(0.07) | benign(0.042) | TCGA-AA-A00O-01 | Colorectum | colon adenocarcinoma | Female | >=65 | III/IV | Unknown | Unknown | SD | |
| CRYZ | SNV | Missense_Mutation | c.718G>A | p.Gly240Arg | p.G240R | Q08257 | protein_coding | tolerated(0.21) | benign(0.304) | TCGA-AD-6901-01 | Colorectum | colon adenocarcinoma | Male | >=65 | I/II | Chemotherapy | xeloda | PD | |
| CRYZ | SNV | Missense_Mutation | c.975N>T | p.Met325Ile | p.M325I | Q08257 | protein_coding | tolerated(0.64) | benign(0) | TCGA-G4-6310-01 | Colorectum | colon adenocarcinoma | Male | >=65 | III/IV | Chemotherapy | 5-fu | SD | |
| CRYZ | SNV | Missense_Mutation | c.764A>G | p.Asn255Ser | p.N255S | Q08257 | protein_coding | deleterious(0.04) | benign(0.029) | TCGA-QL-A97D-01 | Colorectum | colon adenocarcinoma | Female | >=65 | I/II | Unknown | Unknown | SD |
| Page: 1 2 3 4 |
Top |
Related drugs of malignant transformation related genes |
| Identification of chemicals and drugs interact with genes involved in malignant transfromation |
| (DGIdb 4.0) |
| Entrez ID | Symbol | Category | Interaction Types | Drug Claim Name | Drug Name | PMIDs |
| 1429 | CRYZ | ENZYME, DRUGGABLE GENOME | 2'-HYDROXYCHALCONE | 2'-HYDROXYCHALCONE | 20639112 |
| Page: 1 |

Copyright 2023-Present -The University of Texas Health Science Center at Houston |