
|
|||||
|
 | |
| |
| |
| |
| |
| |
|
Gene: CRYM |
Gene summary for CRYM |
| Gene information | Species | Human | Gene symbol | CRYM | Gene ID | 1428 |
| Gene name | crystallin mu | |
| Gene Alias | DFNA40 | |
| Cytomap | 16p12.2 | |
| Gene Type | protein-coding | GO ID | GO:0000122 | UniProtAcc | Q14894 |
Top |
Malignant transformation analysis |
| Identification of the aberrant gene expression in precancerous and cancerous lesions by comparing the gene expression of stem-like cells in diseased tissues with normal stem cells |
| Entrez ID | Symbol | Replicates | Species | Organ | Tissue | Adj P-value | Log2FC | Malignancy |
| 1428 | CRYM | HCC1_Meng | Human | Liver | HCC | 1.89e-25 | 5.11e-02 | 0.0246 |
| 1428 | CRYM | HCC1 | Human | Liver | HCC | 4.30e-02 | 2.21e+00 | 0.5336 |
| 1428 | CRYM | S014 | Human | Liver | HCC | 1.19e-07 | 3.77e-01 | 0.2254 |
| 1428 | CRYM | S015 | Human | Liver | HCC | 1.13e-10 | 5.06e-01 | 0.2375 |
| 1428 | CRYM | S016 | Human | Liver | HCC | 1.11e-09 | 3.77e-01 | 0.2243 |
| 1428 | CRYM | S028 | Human | Liver | HCC | 1.83e-06 | 2.45e-01 | 0.2503 |
| 1428 | CRYM | S029 | Human | Liver | HCC | 1.71e-04 | 1.99e-01 | 0.2581 |
| 1428 | CRYM | GSM5252131_BPH340PrSF_Via | Human | Prostate | BPH | 4.98e-10 | 5.03e-01 | -0.2126 |
| 1428 | CRYM | GSM5252135_BPH511PrPUr_Fcol_3GEX | Human | Prostate | BPH | 1.99e-07 | 3.27e-01 | -0.1833 |
| 1428 | CRYM | GSM5252137_BPH556PrGA2_Fcol | Human | Prostate | BPH | 7.98e-13 | 1.00e+00 | -0.23 |
| 1428 | CRYM | Dong_P3 | Human | Prostate | Tumor | 9.42e-11 | 2.10e-01 | 0.0278 |
| Page: 1 |
| Tissue | Expression Dynamics | Abbreviation |
| Liver | 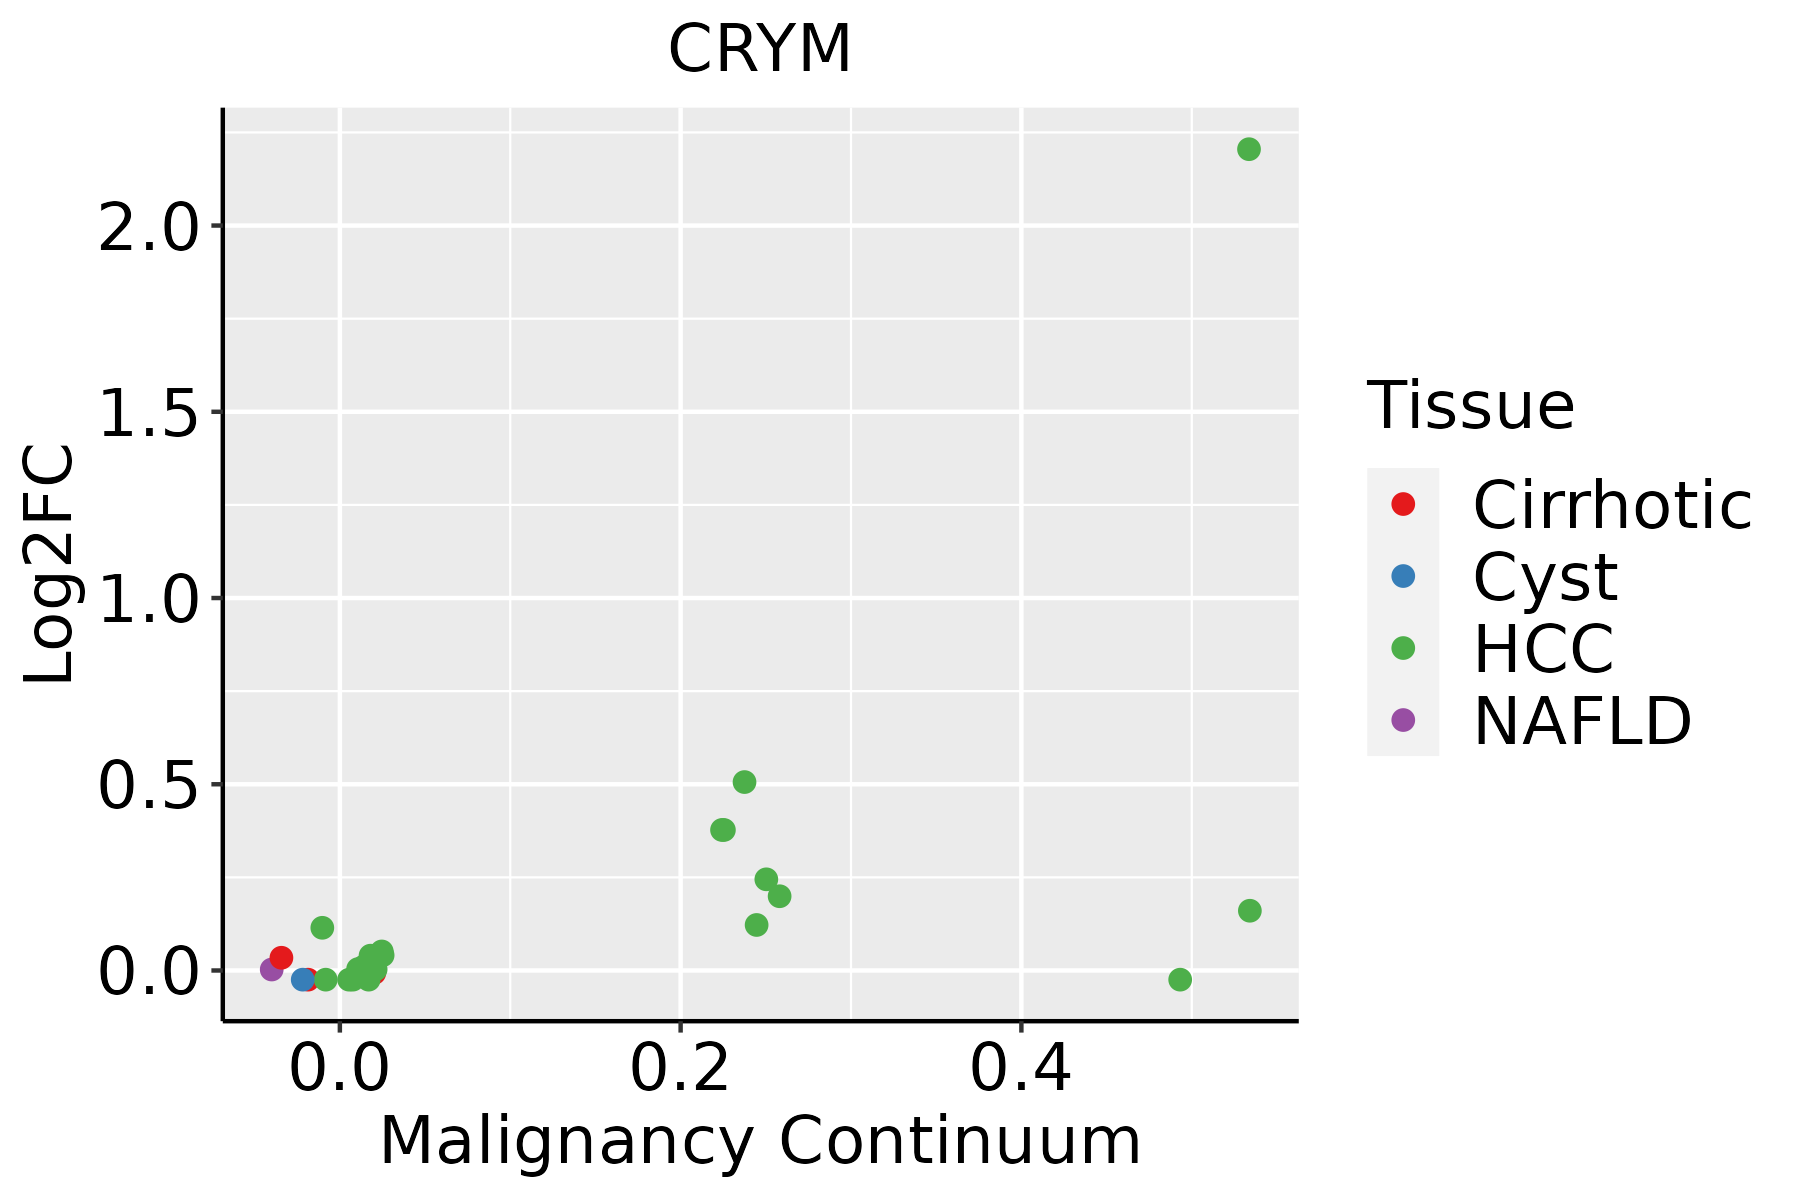 | HCC: Hepatocellular carcinoma |
| NAFLD: Non-alcoholic fatty liver disease | ||
| Prostate |  | BPH: Benign Prostatic Hyperplasia |
| ∗log2FC in expression of this searched gene in stem-like cells from each diseased tissue sample relative to stem-like cells in normal samples in each tissue plotted against the malignancy continuum. Samples are colored based on if they are from different disease stage. |
Top |
Malignant transformation related pathway analysis |
| Find out the enriched GO biological processes and KEGG pathways involved in transition from healthy to precancer to cancer |
| Tissue | Disease Stage | Enriched GO biological Processes |
| Colorectum | AD |  |
| Colorectum | SER |  |
| Colorectum | MSS |  |
| Colorectum | MSI-H |  |
| Colorectum | FAP |  |
| ∗Top 15 enriched GO BP terms are showed in the bar plot of each disease state in each tissue. Each row represents a significant GO biological process which is colored according to the -log10(p.adjust). |
| Page: 1 2 3 4 5 6 7 8 9 |
| GO ID | Tissue | Disease Stage | Description | Gene Ratio | Bg Ratio | pvalue | p.adjust | Count |
| GO:004428221 | Liver | HCC | small molecule catabolic process | 225/7958 | 376/18723 | 6.50e-12 | 2.80e-10 | 225 |
| GO:001605421 | Liver | HCC | organic acid catabolic process | 152/7958 | 240/18723 | 5.11e-11 | 1.92e-09 | 152 |
| GO:00463952 | Liver | HCC | carboxylic acid catabolic process | 149/7958 | 236/18723 | 1.11e-10 | 3.87e-09 | 149 |
| GO:19016052 | Liver | HCC | alpha-amino acid metabolic process | 124/7958 | 195/18723 | 2.07e-09 | 5.79e-08 | 124 |
| GO:000657521 | Liver | HCC | cellular modified amino acid metabolic process | 119/7958 | 188/18723 | 6.47e-09 | 1.67e-07 | 119 |
| GO:00065202 | Liver | HCC | cellular amino acid metabolic process | 167/7958 | 284/18723 | 1.91e-08 | 4.56e-07 | 167 |
| GO:00090632 | Liver | HCC | cellular amino acid catabolic process | 70/7958 | 110/18723 | 6.12e-06 | 7.52e-05 | 70 |
| GO:00090662 | Liver | HCC | aspartate family amino acid metabolic process | 34/7958 | 49/18723 | 1.28e-04 | 1.06e-03 | 34 |
| GO:19016062 | Liver | HCC | alpha-amino acid catabolic process | 53/7958 | 87/18723 | 4.01e-04 | 2.71e-03 | 53 |
| Page: 1 |
| Pathway ID | Tissue | Disease Stage | Description | Gene Ratio | Bg Ratio | pvalue | p.adjust | qvalue | Count |
| Page: 1 |
Top |
Cell-cell communication analysis |
| Identification of potential cell-cell interactions between two cell types and their ligand-receptor pairs for different disease states |
| Ligand | Receptor | LRpair | Pathway | Tissue | Disease Stage |
| Page: 1 |
Top |
Single-cell gene regulatory network inference analysis |
| Find out the significant the regulons (TFs) and the target genes of each regulon across cell types for different disease states |
| TF | Cell Type | Tissue | Disease Stage | Target Gene | RSS | Regulon Activity |
| ∗The dot plots of a searched regulon are shown for all cell subpopulations in each disease state of each tissue based on the regulon specific score inferred using pySCENIC and by calculating the average expression. |
| Page: 1 |
Top |
Somatic mutation of malignant transformation related genes |
| Annotation of somatic variants for genes involved in malignant transformation |
| Hugo Symbol | Variant Class | Variant Classification | dbSNP RS | HGVSc | HGVSp | HGVSp Short | SWISSPROT | BIOTYPE | SIFT | PolyPhen | Tumor Sample Barcode | Tissue | Histology | Sex | Age | Stage | Therapy Types | Drugs | Outcome |
| CRYM | SNV | Missense_Mutation | c.319N>A | p.Leu107Met | p.L107M | Q14894 | protein_coding | tolerated(0.06) | possibly_damaging(0.822) | TCGA-A8-A09W-01 | Breast | breast invasive carcinoma | Female | >=65 | III/IV | Unknown | Unknown | SD | |
| CRYM | insertion | Frame_Shift_Ins | novel | c.365_366insCC | p.Val123GlnfsTer10 | p.V123Qfs*10 | Q14894 | protein_coding | TCGA-A8-A07G-01 | Breast | breast invasive carcinoma | Female | >=65 | I/II | Chemotherapy | 5-fluorouracil | CR | ||
| CRYM | insertion | Nonsense_Mutation | novel | c.363_364insTTGTTGCATTAATAAAAATCTGTGCTCCCAGAAGAATCAAGAA | p.Ala122LeufsTer4 | p.A122Lfs*4 | Q14894 | protein_coding | TCGA-A8-A07G-01 | Breast | breast invasive carcinoma | Female | >=65 | I/II | Chemotherapy | 5-fluorouracil | CR | ||
| CRYM | SNV | Missense_Mutation | novel | c.167G>T | p.Arg56Met | p.R56M | Q14894 | protein_coding | tolerated(0.07) | benign(0.163) | TCGA-2W-A8YY-01 | Cervix | cervical & endocervical cancer | Female | <65 | I/II | Chemotherapy | cisplatin | CR |
| CRYM | SNV | Missense_Mutation | novel | c.892G>A | p.Glu298Lys | p.E298K | Q14894 | protein_coding | deleterious(0) | probably_damaging(0.971) | TCGA-EK-A3GK-01 | Cervix | cervical & endocervical cancer | Female | <65 | I/II | Unknown | Unknown | SD |
| CRYM | SNV | Missense_Mutation | novel | c.823N>A | p.Val275Met | p.V275M | Q14894 | protein_coding | tolerated(0.05) | probably_damaging(0.997) | TCGA-PN-A8MA-01 | Cervix | cervical & endocervical cancer | Female | <65 | I/II | Chemotherapy | cisplatin | SD |
| CRYM | SNV | Missense_Mutation | rs754271922 | c.506G>A | p.Arg169His | p.R169H | Q14894 | protein_coding | tolerated(0.15) | benign(0.206) | TCGA-5M-AAT6-01 | Colorectum | colon adenocarcinoma | Female | <65 | III/IV | Unknown | Unknown | PD |
| CRYM | SNV | Missense_Mutation | c.924T>G | p.Asp308Glu | p.D308E | Q14894 | protein_coding | tolerated(0.29) | benign(0.005) | TCGA-AA-3510-01 | Colorectum | colon adenocarcinoma | Male | >=65 | I/II | Unknown | Unknown | SD | |
| CRYM | SNV | Missense_Mutation | novel | c.89N>T | p.Ala30Val | p.A30V | Q14894 | protein_coding | tolerated(0.08) | possibly_damaging(0.475) | TCGA-AA-A00N-01 | Colorectum | colon adenocarcinoma | Male | >=65 | I/II | Unknown | Unknown | PD |
| CRYM | SNV | Missense_Mutation | novel | c.94N>A | p.Ala32Thr | p.A32T | Q14894 | protein_coding | tolerated(0.12) | possibly_damaging(0.499) | TCGA-A5-A1OF-01 | Endometrium | uterine corpus endometrioid carcinoma | Female | <65 | I/II | Unknown | Unknown | SD |
| Page: 1 2 3 |
Top |
Related drugs of malignant transformation related genes |
| Identification of chemicals and drugs interact with genes involved in malignant transfromation |
| (DGIdb 4.0) |
| Entrez ID | Symbol | Category | Interaction Types | Drug Claim Name | Drug Name | PMIDs |
| Page: 1 |

Copyright 2023-Present -The University of Texas Health Science Center at Houston |