
|
|||||
|
 | |
| |
| |
| |
| |
| |
|
Gene: CRYL1 |
Gene summary for CRYL1 |
| Gene information | Species | Human | Gene symbol | CRYL1 | Gene ID | 51084 |
| Gene name | crystallin lambda 1 | |
| Gene Alias | GDH | |
| Cytomap | 13q12.11 | |
| Gene Type | protein-coding | GO ID | GO:0006082 | UniProtAcc | Q9Y2S2 |
Top |
Malignant transformation analysis |
| Identification of the aberrant gene expression in precancerous and cancerous lesions by comparing the gene expression of stem-like cells in diseased tissues with normal stem cells |
| Entrez ID | Symbol | Replicates | Species | Organ | Tissue | Adj P-value | Log2FC | Malignancy |
| 51084 | CRYL1 | HTA11_3410_2000001011 | Human | Colorectum | AD | 3.82e-04 | -1.79e-01 | 0.0155 |
| 51084 | CRYL1 | HTA11_2487_2000001011 | Human | Colorectum | SER | 6.71e-05 | 5.45e-01 | -0.1808 |
| 51084 | CRYL1 | HTA11_347_2000001011 | Human | Colorectum | AD | 1.49e-13 | 5.25e-01 | -0.1954 |
| 51084 | CRYL1 | HTA11_83_2000001011 | Human | Colorectum | SER | 2.43e-02 | 4.91e-01 | -0.1526 |
| 51084 | CRYL1 | HTA11_99999970781_79442 | Human | Colorectum | MSS | 2.33e-02 | -2.20e-01 | 0.294 |
| 51084 | CRYL1 | HTA11_99999965104_69814 | Human | Colorectum | MSS | 1.78e-02 | 3.74e-01 | 0.281 |
| 51084 | CRYL1 | A002-C-010 | Human | Colorectum | FAP | 1.63e-02 | -2.49e-01 | 0.242 |
| 51084 | CRYL1 | A015-C-203 | Human | Colorectum | FAP | 2.06e-20 | -3.81e-01 | -0.1294 |
| 51084 | CRYL1 | A002-C-201 | Human | Colorectum | FAP | 8.61e-06 | -3.00e-01 | 0.0324 |
| 51084 | CRYL1 | A002-C-203 | Human | Colorectum | FAP | 6.19e-06 | -2.77e-01 | 0.2786 |
| 51084 | CRYL1 | A001-C-119 | Human | Colorectum | FAP | 7.87e-06 | -3.69e-01 | -0.1557 |
| 51084 | CRYL1 | A001-C-108 | Human | Colorectum | FAP | 5.68e-13 | -3.23e-01 | -0.0272 |
| 51084 | CRYL1 | A002-C-205 | Human | Colorectum | FAP | 3.80e-10 | -3.69e-01 | -0.1236 |
| 51084 | CRYL1 | A001-C-104 | Human | Colorectum | FAP | 1.16e-08 | -3.38e-01 | 0.0184 |
| 51084 | CRYL1 | A015-C-005 | Human | Colorectum | FAP | 8.57e-09 | -4.35e-01 | -0.0336 |
| 51084 | CRYL1 | A015-C-006 | Human | Colorectum | FAP | 4.66e-08 | -3.96e-01 | -0.0994 |
| 51084 | CRYL1 | A015-C-106 | Human | Colorectum | FAP | 9.86e-11 | -3.09e-01 | -0.0511 |
| 51084 | CRYL1 | A002-C-114 | Human | Colorectum | FAP | 2.85e-10 | -4.17e-01 | -0.1561 |
| 51084 | CRYL1 | A015-C-104 | Human | Colorectum | FAP | 1.86e-20 | -4.12e-01 | -0.1899 |
| 51084 | CRYL1 | A001-C-014 | Human | Colorectum | FAP | 5.09e-10 | -3.37e-01 | 0.0135 |
| Page: 1 2 3 4 5 6 7 |
| Tissue | Expression Dynamics | Abbreviation |
| Colorectum (GSE201348) |  | FAP: Familial adenomatous polyposis |
| CRC: Colorectal cancer | ||
| Colorectum (HTA11) |  | AD: Adenomas |
| SER: Sessile serrated lesions | ||
| MSI-H: Microsatellite-high colorectal cancer | ||
| MSS: Microsatellite stable colorectal cancer | ||
| Esophagus | 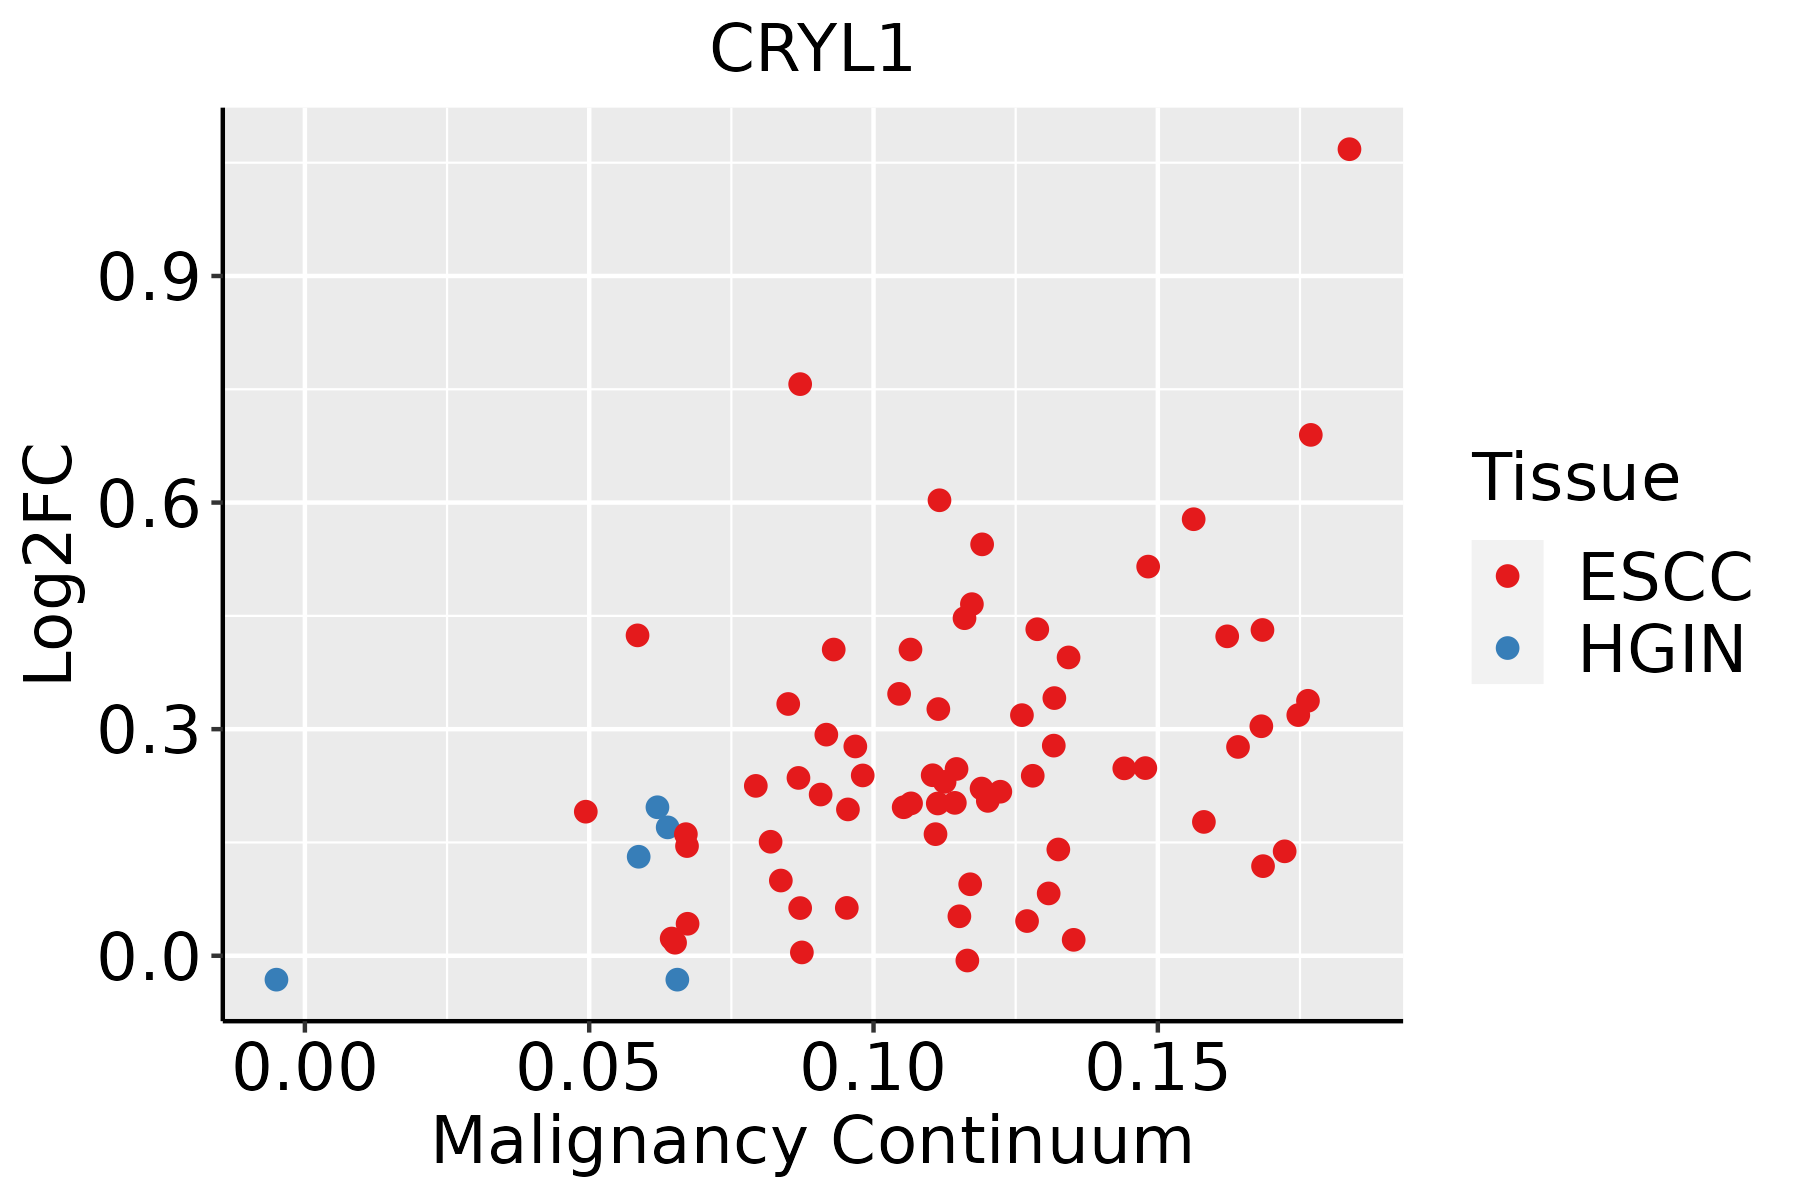 | ESCC: Esophageal squamous cell carcinoma |
| HGIN: High-grade intraepithelial neoplasias | ||
| LGIN: Low-grade intraepithelial neoplasias | ||
| GC | 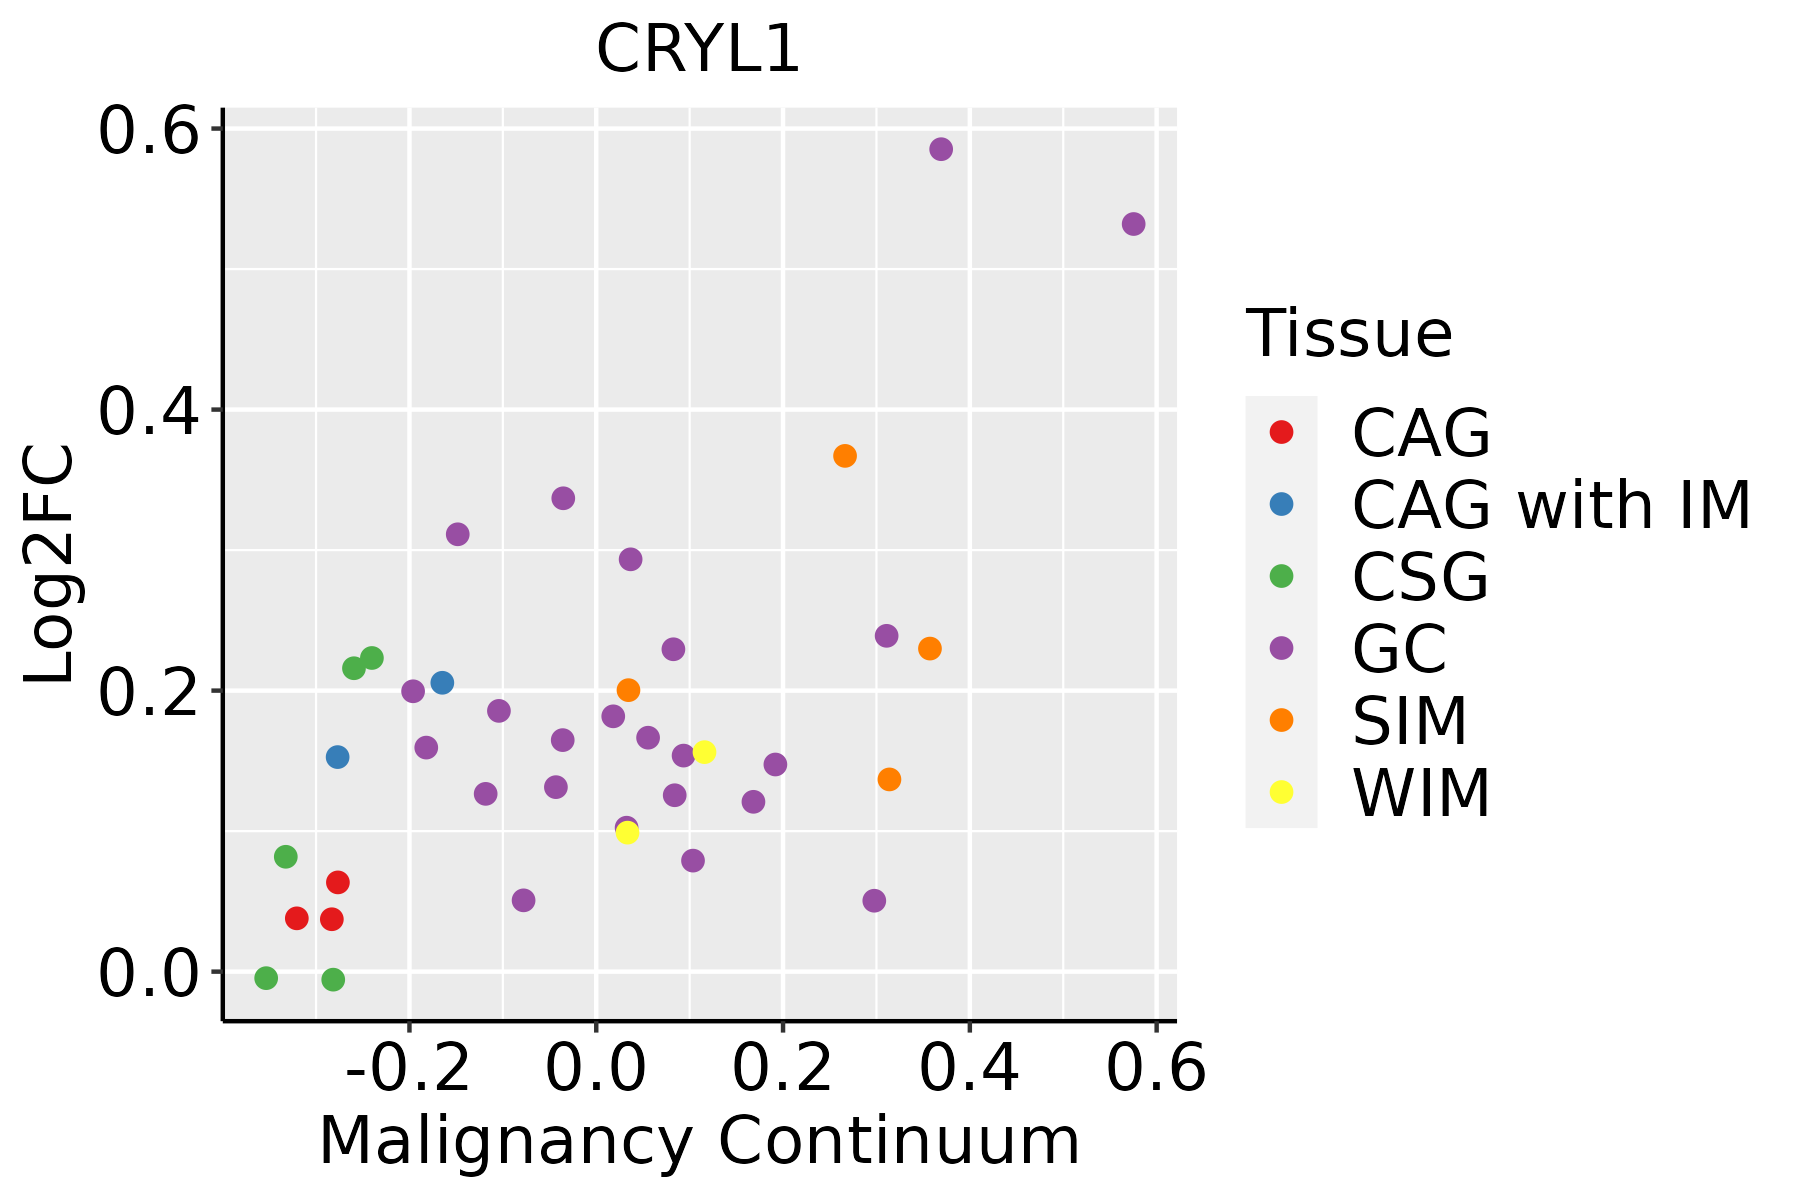 | CAG: Chronic atrophic gastritis |
| CAG with IM: Chronic atrophic gastritis with intestinal metaplasia | ||
| CSG: Chronic superficial gastritis | ||
| GC: Gastric cancer | ||
| SIM: Severe intestinal metaplasia | ||
| WIM: Wild intestinal metaplasia | ||
| Liver | 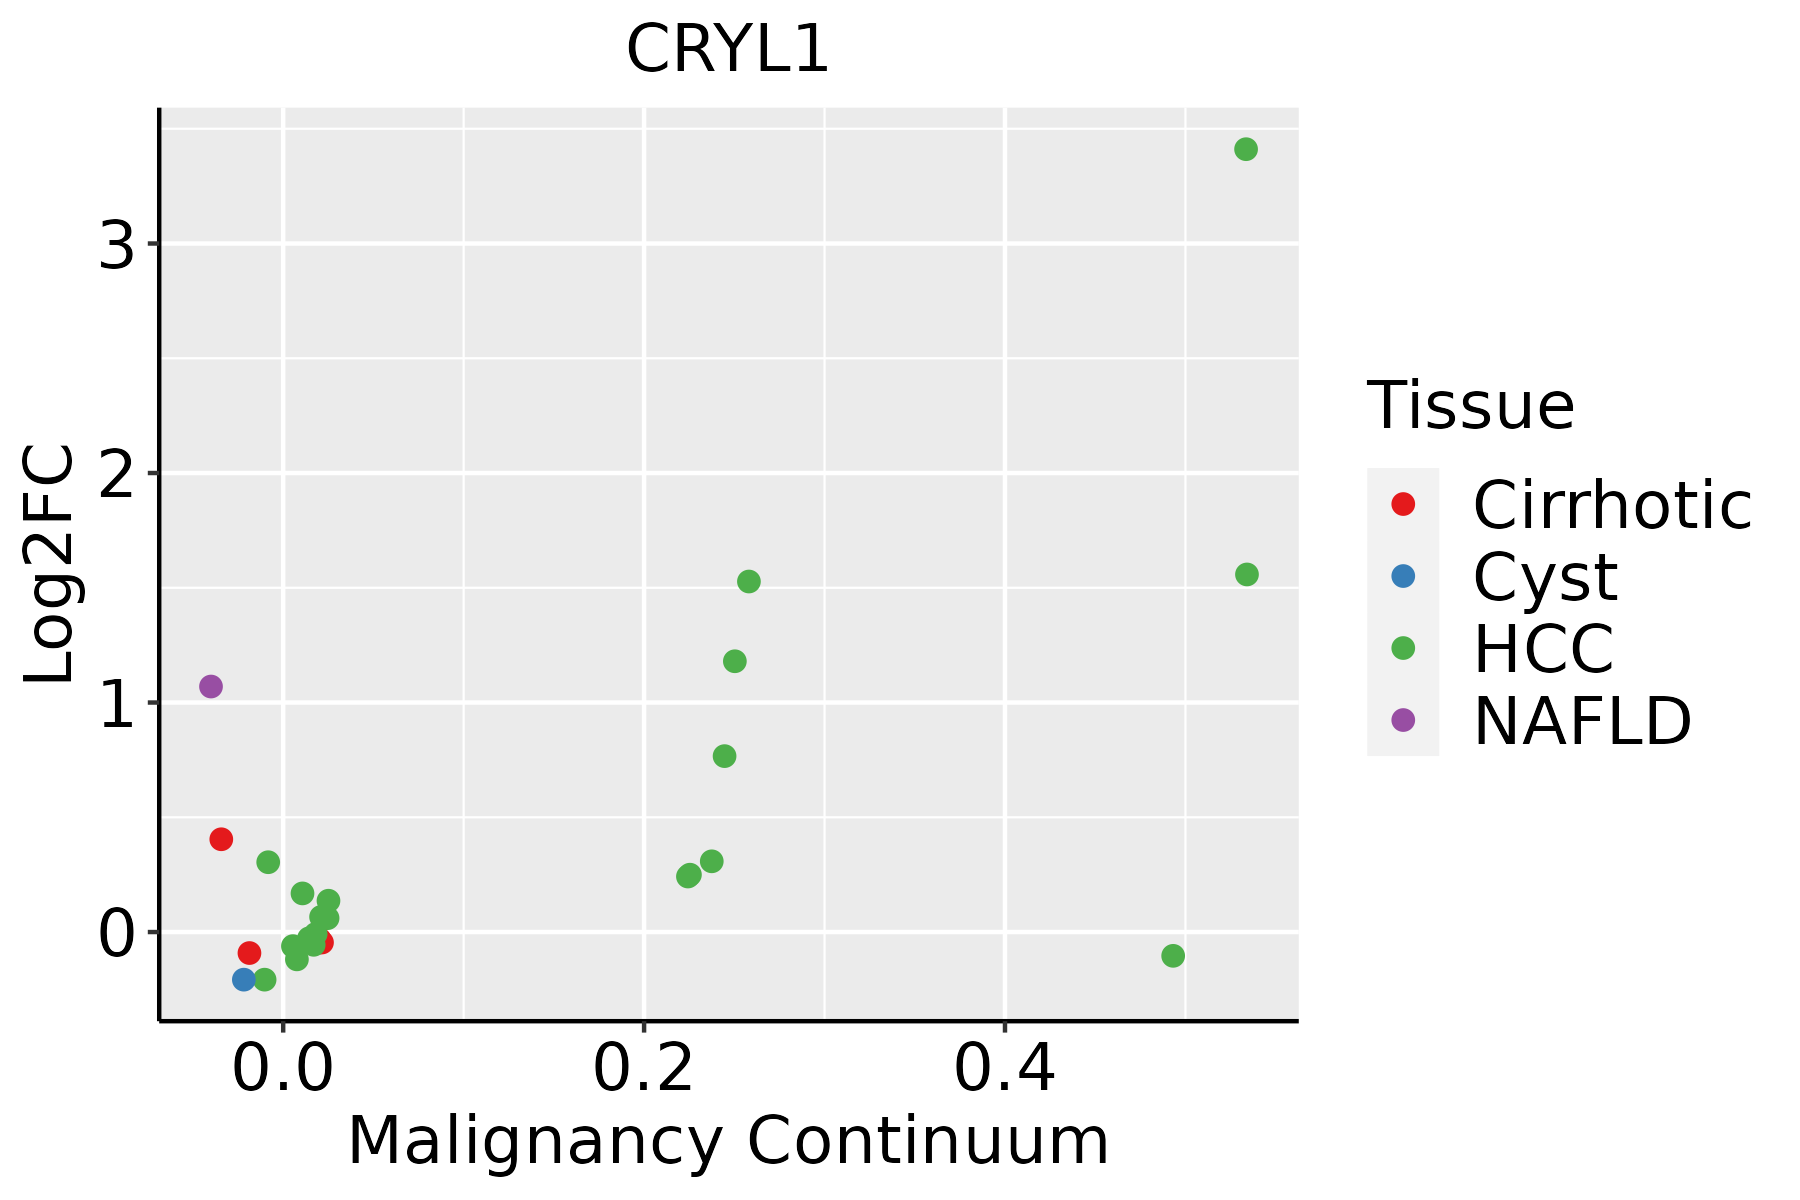 | HCC: Hepatocellular carcinoma |
| NAFLD: Non-alcoholic fatty liver disease | ||
| Oral Cavity | 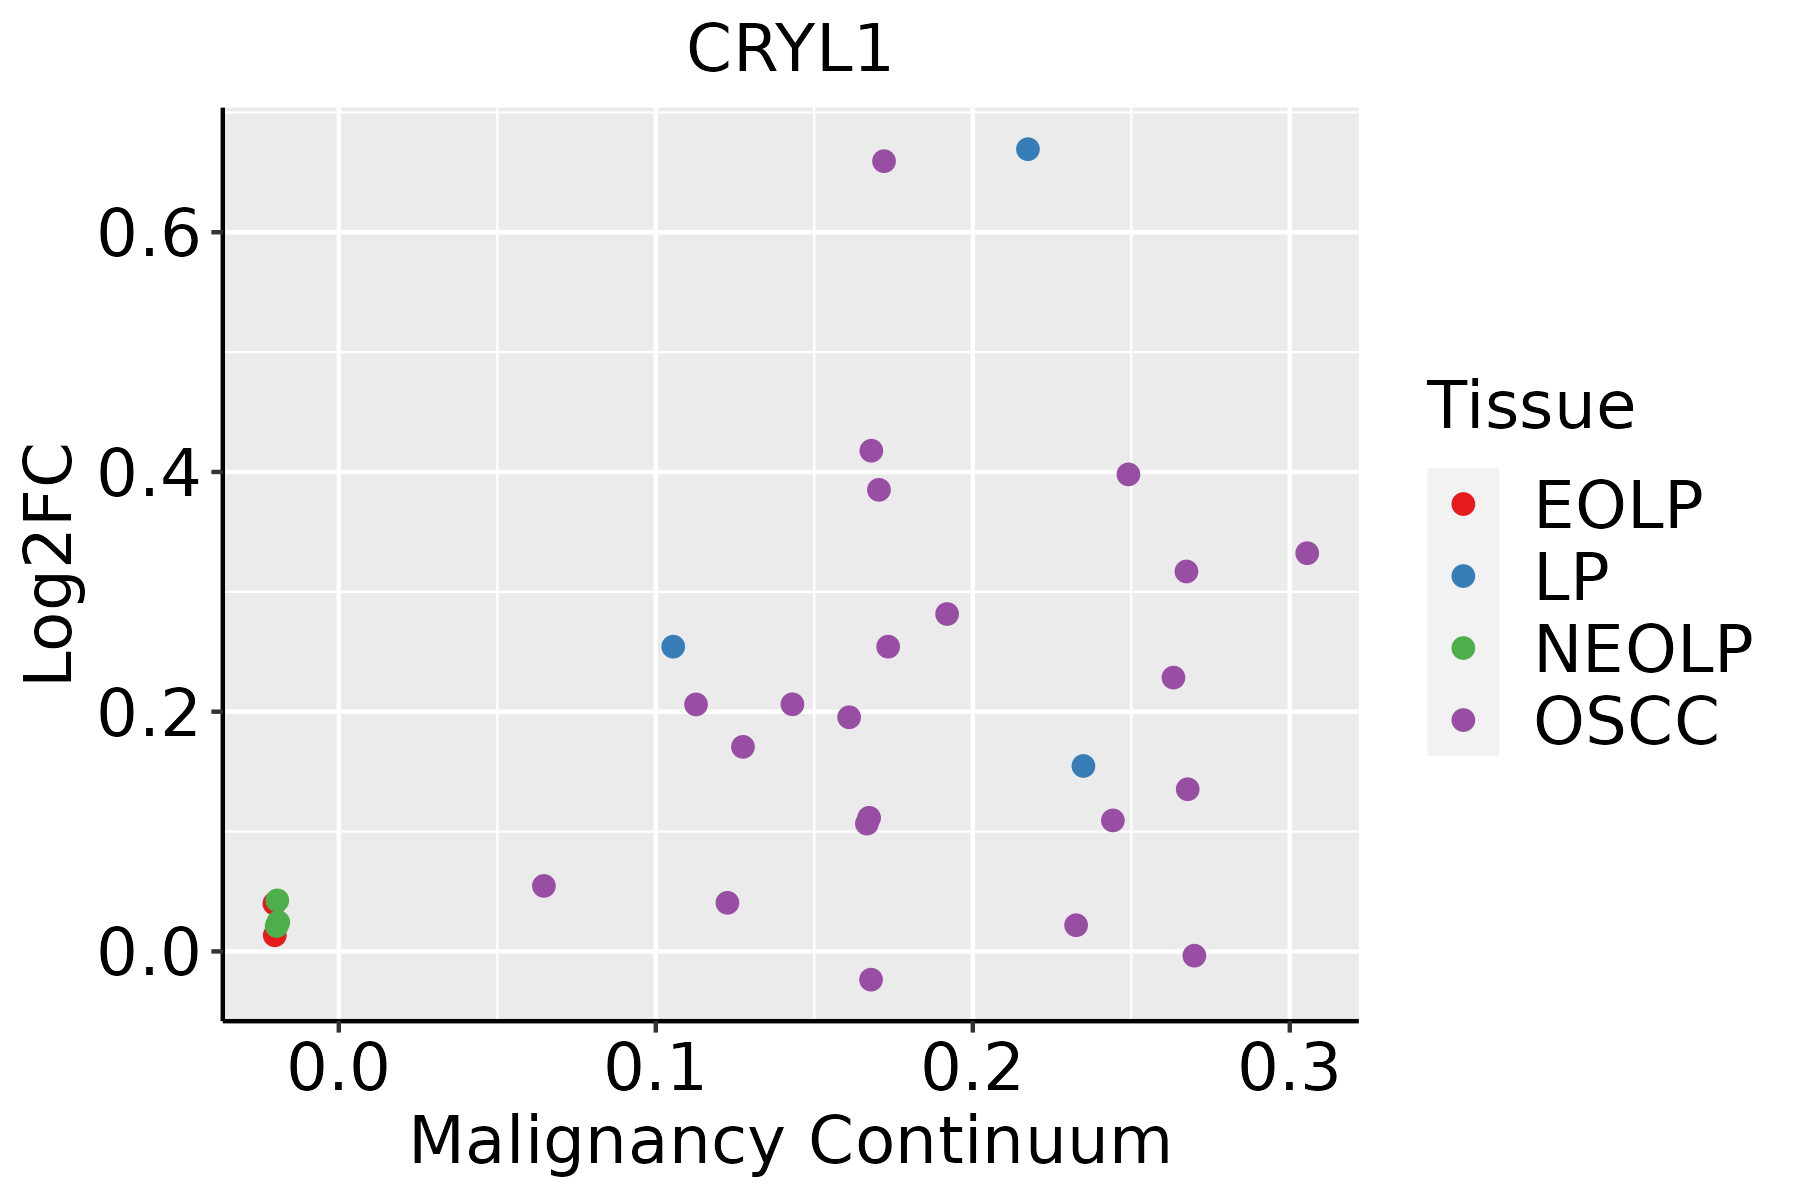 | EOLP: Erosive Oral lichen planus |
| LP: leukoplakia | ||
| NEOLP: Non-erosive oral lichen planus | ||
| OSCC: Oral squamous cell carcinoma | ||
| Thyroid |  | ATC: Anaplastic thyroid cancer |
| HT: Hashimoto's thyroiditis | ||
| PTC: Papillary thyroid cancer |
| ∗log2FC in expression of this searched gene in stem-like cells from each diseased tissue sample relative to stem-like cells in normal samples in each tissue plotted against the malignancy continuum. Samples are colored based on if they are from different disease stage. |
Top |
Malignant transformation related pathway analysis |
| Find out the enriched GO biological processes and KEGG pathways involved in transition from healthy to precancer to cancer |
| Tissue | Disease Stage | Enriched GO biological Processes |
| Colorectum | AD |  |
| Colorectum | SER |  |
| Colorectum | MSS |  |
| Colorectum | MSI-H |  |
| Colorectum | FAP |  |
| ∗Top 15 enriched GO BP terms are showed in the bar plot of each disease state in each tissue. Each row represents a significant GO biological process which is colored according to the -log10(p.adjust). |
| Page: 1 2 3 4 5 6 7 8 9 |
| GO ID | Tissue | Disease Stage | Description | Gene Ratio | Bg Ratio | pvalue | p.adjust | Count |
| GO:0006631 | Colorectum | AD | fatty acid metabolic process | 114/3918 | 390/18723 | 5.58e-05 | 9.44e-04 | 114 |
| GO:00066311 | Colorectum | SER | fatty acid metabolic process | 79/2897 | 390/18723 | 6.34e-03 | 4.56e-02 | 79 |
| GO:00066312 | Colorectum | MSS | fatty acid metabolic process | 95/3467 | 390/18723 | 2.20e-03 | 1.84e-02 | 95 |
| GO:00066313 | Colorectum | FAP | fatty acid metabolic process | 81/2622 | 390/18723 | 1.43e-04 | 2.24e-03 | 81 |
| GO:00066314 | Colorectum | CRC | fatty acid metabolic process | 65/2078 | 390/18723 | 5.30e-04 | 7.42e-03 | 65 |
| GO:00066318 | Esophagus | ESCC | fatty acid metabolic process | 217/8552 | 390/18723 | 4.21e-05 | 3.39e-04 | 217 |
| GO:00066316 | Liver | NAFLD | fatty acid metabolic process | 92/1882 | 390/18723 | 3.38e-15 | 3.29e-12 | 92 |
| GO:000663112 | Liver | Cirrhotic | fatty acid metabolic process | 165/4634 | 390/18723 | 1.29e-14 | 1.26e-12 | 165 |
| GO:000663122 | Liver | HCC | fatty acid metabolic process | 238/7958 | 390/18723 | 8.24e-14 | 4.84e-12 | 238 |
| GO:00066317 | Oral cavity | OSCC | fatty acid metabolic process | 186/7305 | 390/18723 | 2.65e-04 | 1.69e-03 | 186 |
| GO:00066315 | Stomach | GC | fatty acid metabolic process | 55/1159 | 390/18723 | 8.63e-09 | 8.38e-07 | 55 |
| GO:000663111 | Stomach | CAG with IM | fatty acid metabolic process | 46/1050 | 390/18723 | 1.53e-06 | 7.14e-05 | 46 |
| GO:000663121 | Stomach | CSG | fatty acid metabolic process | 43/1034 | 390/18723 | 1.25e-05 | 4.20e-04 | 43 |
| GO:000663141 | Stomach | SIM | fatty acid metabolic process | 38/708 | 390/18723 | 1.01e-07 | 8.64e-06 | 38 |
| Page: 1 |
| Pathway ID | Tissue | Disease Stage | Description | Gene Ratio | Bg Ratio | pvalue | p.adjust | qvalue | Count |
| Page: 1 |
Top |
Cell-cell communication analysis |
| Identification of potential cell-cell interactions between two cell types and their ligand-receptor pairs for different disease states |
| Ligand | Receptor | LRpair | Pathway | Tissue | Disease Stage |
| Page: 1 |
Top |
Single-cell gene regulatory network inference analysis |
| Find out the significant the regulons (TFs) and the target genes of each regulon across cell types for different disease states |
| TF | Cell Type | Tissue | Disease Stage | Target Gene | RSS | Regulon Activity |
| ∗The dot plots of a searched regulon are shown for all cell subpopulations in each disease state of each tissue based on the regulon specific score inferred using pySCENIC and by calculating the average expression. |
| Page: 1 |
Top |
Somatic mutation of malignant transformation related genes |
| Annotation of somatic variants for genes involved in malignant transformation |
| Hugo Symbol | Variant Class | Variant Classification | dbSNP RS | HGVSc | HGVSp | HGVSp Short | SWISSPROT | BIOTYPE | SIFT | PolyPhen | Tumor Sample Barcode | Tissue | Histology | Sex | Age | Stage | Therapy Types | Drugs | Outcome |
| CRYL1 | SNV | Missense_Mutation | novel | c.703N>C | p.Ile235Leu | p.I235L | Q9Y2S2 | protein_coding | tolerated_low_confidence(0.19) | benign(0.021) | TCGA-A2-A0D0-01 | Breast | breast invasive carcinoma | Female | <65 | I/II | Chemotherapy | cytoxan | SD |
| CRYL1 | SNV | Missense_Mutation | c.694N>C | p.Tyr232His | p.Y232H | Q9Y2S2 | protein_coding | deleterious_low_confidence(0) | probably_damaging(0.999) | TCGA-D8-A1XK-01 | Breast | breast invasive carcinoma | Female | <65 | I/II | Chemotherapy | doxorubicine+cyclophosphamide | SD | |
| CRYL1 | SNV | Missense_Mutation | novel | c.710N>A | p.Pro237His | p.P237H | Q9Y2S2 | protein_coding | deleterious_low_confidence(0) | probably_damaging(0.998) | TCGA-E2-A9RU-01 | Breast | breast invasive carcinoma | Female | >=65 | III/IV | Hormone Therapy | arimidex | SD |
| CRYL1 | deletion | Frame_Shift_Del | novel | c.342delN | p.Asp114GlufsTer4 | p.D114Efs*4 | Q9Y2S2 | protein_coding | TCGA-E2-A574-01 | Breast | breast invasive carcinoma | Female | <65 | I/II | Chemotherapy | adriamycin | SD | ||
| CRYL1 | SNV | Missense_Mutation | novel | c.256N>A | p.Glu86Lys | p.E86K | Q9Y2S2 | protein_coding | deleterious_low_confidence(0) | benign(0.03) | TCGA-C5-A7XC-01 | Cervix | cervical & endocervical cancer | Female | <65 | I/II | Unknown | Unknown | SD |
| CRYL1 | SNV | Missense_Mutation | c.565N>A | p.Glu189Lys | p.E189K | Q9Y2S2 | protein_coding | deleterious_low_confidence(0) | probably_damaging(0.971) | TCGA-EK-A3GK-01 | Cervix | cervical & endocervical cancer | Female | <65 | I/II | Unknown | Unknown | SD | |
| CRYL1 | SNV | Missense_Mutation | novel | c.647N>T | p.Ser216Phe | p.S216F | Q9Y2S2 | protein_coding | deleterious_low_confidence(0) | probably_damaging(0.981) | TCGA-A6-3808-01 | Colorectum | colon adenocarcinoma | Male | >=65 | I/II | Unknown | Unknown | SD |
| CRYL1 | SNV | Missense_Mutation | rs767757127 | c.589N>T | p.Arg197Cys | p.R197C | Q9Y2S2 | protein_coding | deleterious_low_confidence(0) | probably_damaging(1) | TCGA-AA-3663-01 | Colorectum | colon adenocarcinoma | Male | <65 | I/II | Unknown | Unknown | SD |
| CRYL1 | SNV | Missense_Mutation | rs760113420 | c.928N>A | p.Ala310Thr | p.A310T | Q9Y2S2 | protein_coding | deleterious_low_confidence(0) | possibly_damaging(0.531) | TCGA-AA-A00N-01 | Colorectum | colon adenocarcinoma | Male | >=65 | I/II | Unknown | Unknown | PD |
| CRYL1 | SNV | Missense_Mutation | c.497C>T | p.Pro166Leu | p.P166L | Q9Y2S2 | protein_coding | deleterious_low_confidence(0) | benign(0.079) | TCGA-AA-A02F-01 | Colorectum | colon adenocarcinoma | Female | >=65 | III/IV | Chemotherapy | folinic | PR |
| Page: 1 2 3 4 |
Top |
Related drugs of malignant transformation related genes |
| Identification of chemicals and drugs interact with genes involved in malignant transfromation |
| (DGIdb 4.0) |
| Entrez ID | Symbol | Category | Interaction Types | Drug Claim Name | Drug Name | PMIDs |
| Page: 1 |

Copyright 2023-Present -The University of Texas Health Science Center at Houston |