
|
|||||
|
 | |
| |
| |
| |
| |
| |
|
Gene: CRYBG3 |
Gene summary for CRYBG3 |
| Gene information | Species | Human | Gene symbol | CRYBG3 | Gene ID | 131544 |
| Gene name | crystallin beta-gamma domain containing 3 | |
| Gene Alias | DKFZp667G2110 | |
| Cytomap | 3q11.2 | |
| Gene Type | protein-coding | GO ID | GO:0001654 | UniProtAcc | Q68DQ2 |
Top |
Malignant transformation analysis |
| Identification of the aberrant gene expression in precancerous and cancerous lesions by comparing the gene expression of stem-like cells in diseased tissues with normal stem cells |
| Entrez ID | Symbol | Replicates | Species | Organ | Tissue | Adj P-value | Log2FC | Malignancy |
| 131544 | CRYBG3 | LZE2T | Human | Esophagus | ESCC | 3.17e-04 | 5.04e-01 | 0.082 |
| 131544 | CRYBG3 | LZE4T | Human | Esophagus | ESCC | 2.32e-03 | 6.26e-02 | 0.0811 |
| 131544 | CRYBG3 | LZE5T | Human | Esophagus | ESCC | 1.34e-04 | 4.07e-01 | 0.0514 |
| 131544 | CRYBG3 | LZE8T | Human | Esophagus | ESCC | 3.04e-09 | 4.49e-01 | 0.067 |
| 131544 | CRYBG3 | LZE20T | Human | Esophagus | ESCC | 6.34e-03 | 1.61e-01 | 0.0662 |
| 131544 | CRYBG3 | LZE24T | Human | Esophagus | ESCC | 1.66e-14 | 2.78e-01 | 0.0596 |
| 131544 | CRYBG3 | P1T-E | Human | Esophagus | ESCC | 4.95e-13 | 3.73e-01 | 0.0875 |
| 131544 | CRYBG3 | P2T-E | Human | Esophagus | ESCC | 1.16e-08 | 1.36e-01 | 0.1177 |
| 131544 | CRYBG3 | P4T-E | Human | Esophagus | ESCC | 3.47e-11 | 2.64e-01 | 0.1323 |
| 131544 | CRYBG3 | P5T-E | Human | Esophagus | ESCC | 5.99e-10 | 1.85e-01 | 0.1327 |
| 131544 | CRYBG3 | P8T-E | Human | Esophagus | ESCC | 7.43e-28 | 5.12e-01 | 0.0889 |
| 131544 | CRYBG3 | P9T-E | Human | Esophagus | ESCC | 3.08e-15 | 4.84e-01 | 0.1131 |
| 131544 | CRYBG3 | P10T-E | Human | Esophagus | ESCC | 1.11e-20 | 2.73e-01 | 0.116 |
| 131544 | CRYBG3 | P11T-E | Human | Esophagus | ESCC | 1.47e-03 | 1.93e-01 | 0.1426 |
| 131544 | CRYBG3 | P12T-E | Human | Esophagus | ESCC | 2.50e-06 | 1.71e-01 | 0.1122 |
| 131544 | CRYBG3 | P17T-E | Human | Esophagus | ESCC | 8.68e-03 | 1.32e-01 | 0.1278 |
| 131544 | CRYBG3 | P20T-E | Human | Esophagus | ESCC | 6.49e-17 | 3.59e-01 | 0.1124 |
| 131544 | CRYBG3 | P21T-E | Human | Esophagus | ESCC | 1.80e-19 | 4.62e-01 | 0.1617 |
| 131544 | CRYBG3 | P22T-E | Human | Esophagus | ESCC | 3.07e-13 | 2.37e-01 | 0.1236 |
| 131544 | CRYBG3 | P23T-E | Human | Esophagus | ESCC | 3.90e-17 | 5.67e-01 | 0.108 |
| Page: 1 2 3 4 5 |
| Tissue | Expression Dynamics | Abbreviation |
| Esophagus | 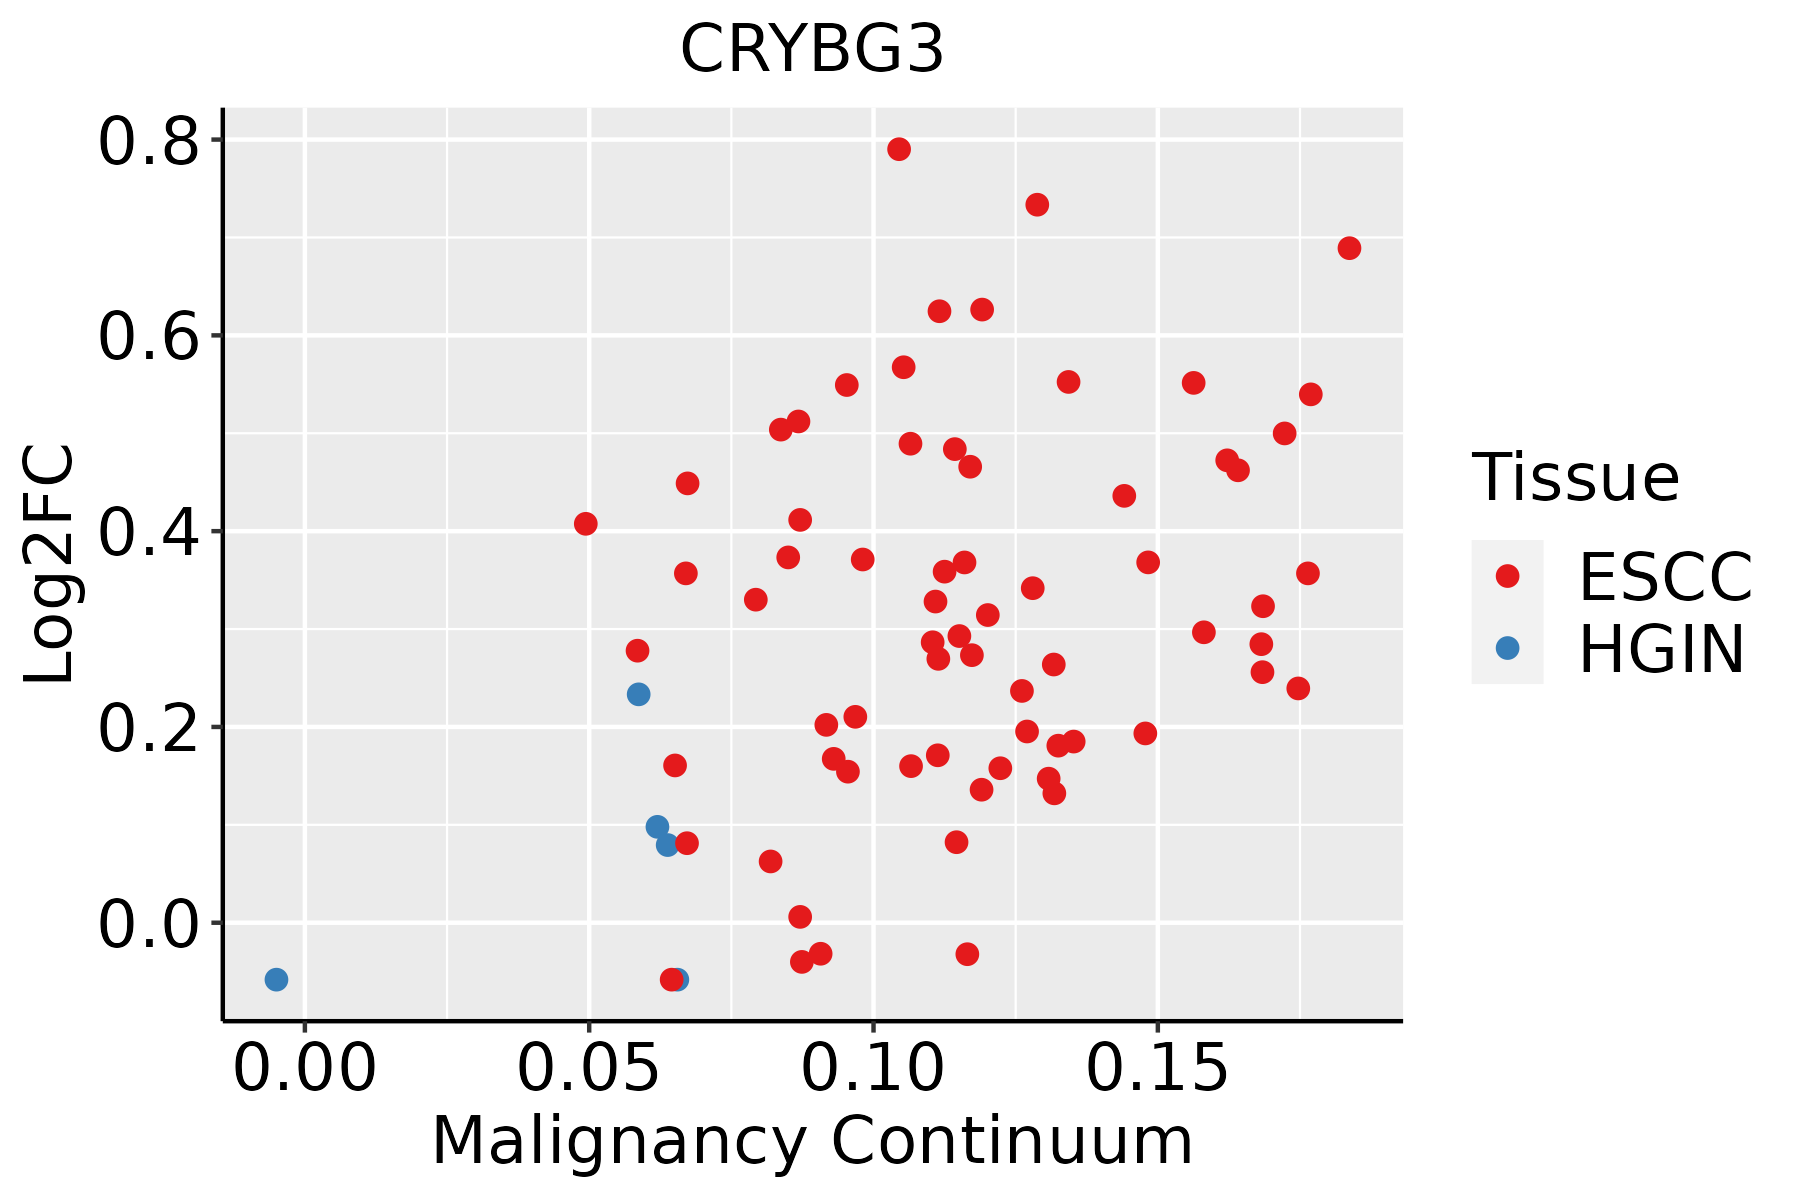 | ESCC: Esophageal squamous cell carcinoma |
| HGIN: High-grade intraepithelial neoplasias | ||
| LGIN: Low-grade intraepithelial neoplasias | ||
| Liver | 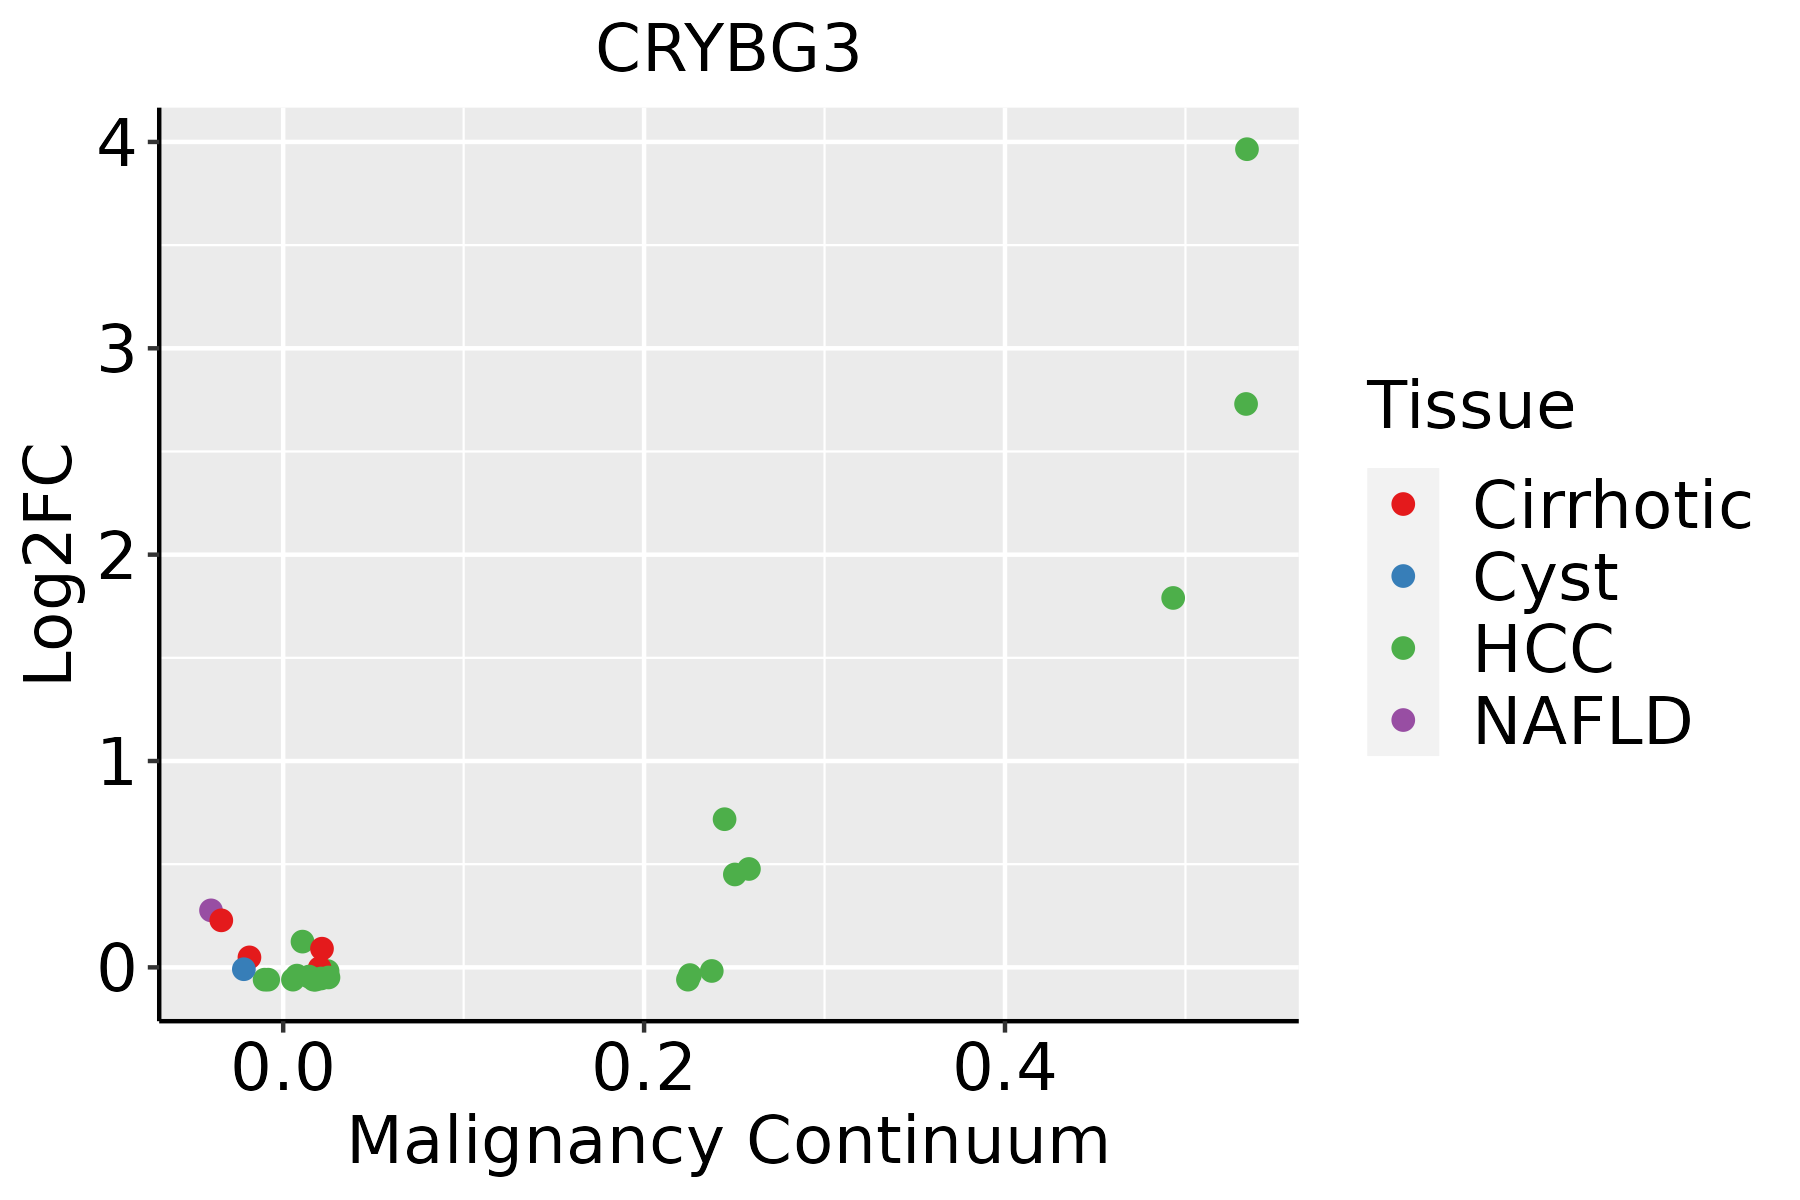 | HCC: Hepatocellular carcinoma |
| NAFLD: Non-alcoholic fatty liver disease | ||
| Thyroid |  | ATC: Anaplastic thyroid cancer |
| HT: Hashimoto's thyroiditis | ||
| PTC: Papillary thyroid cancer |
| ∗log2FC in expression of this searched gene in stem-like cells from each diseased tissue sample relative to stem-like cells in normal samples in each tissue plotted against the malignancy continuum. Samples are colored based on if they are from different disease stage. |
Top |
Malignant transformation related pathway analysis |
| Find out the enriched GO biological processes and KEGG pathways involved in transition from healthy to precancer to cancer |
| Tissue | Disease Stage | Enriched GO biological Processes |
| Colorectum | AD |  |
| Colorectum | SER |  |
| Colorectum | MSS |  |
| Colorectum | MSI-H |  |
| Colorectum | FAP |  |
| ∗Top 15 enriched GO BP terms are showed in the bar plot of each disease state in each tissue. Each row represents a significant GO biological process which is colored according to the -log10(p.adjust). |
| Page: 1 2 3 4 5 6 7 8 9 |
| GO ID | Tissue | Disease Stage | Description | Gene Ratio | Bg Ratio | pvalue | p.adjust | Count |
| Page: 1 |
| Pathway ID | Tissue | Disease Stage | Description | Gene Ratio | Bg Ratio | pvalue | p.adjust | qvalue | Count |
| Page: 1 |
Top |
Cell-cell communication analysis |
| Identification of potential cell-cell interactions between two cell types and their ligand-receptor pairs for different disease states |
| Ligand | Receptor | LRpair | Pathway | Tissue | Disease Stage |
| Page: 1 |
Top |
Single-cell gene regulatory network inference analysis |
| Find out the significant the regulons (TFs) and the target genes of each regulon across cell types for different disease states |
| TF | Cell Type | Tissue | Disease Stage | Target Gene | RSS | Regulon Activity |
| ∗The dot plots of a searched regulon are shown for all cell subpopulations in each disease state of each tissue based on the regulon specific score inferred using pySCENIC and by calculating the average expression. |
| Page: 1 |
Top |
Somatic mutation of malignant transformation related genes |
| Annotation of somatic variants for genes involved in malignant transformation |
| Hugo Symbol | Variant Class | Variant Classification | dbSNP RS | HGVSc | HGVSp | HGVSp Short | SWISSPROT | BIOTYPE | SIFT | PolyPhen | Tumor Sample Barcode | Tissue | Histology | Sex | Age | Stage | Therapy Types | Drugs | Outcome |
| CRYBG3 | SNV | Missense_Mutation | novel | c.1711G>A | p.Asp571Asn | p.D571N | Q68DQ2 | protein_coding | tolerated(0.11) | benign(0.085) | TCGA-5L-AAT1-01 | Breast | breast invasive carcinoma | Female | <65 | III/IV | Hormone Therapy | letrozol | SD |
| CRYBG3 | SNV | Missense_Mutation | c.7111C>A | p.Gln2371Lys | p.Q2371K | Q68DQ2 | protein_coding | tolerated(0.1) | benign(0.291) | TCGA-A8-A09G-01 | Breast | breast invasive carcinoma | Female | >=65 | III/IV | Unknown | Unknown | SD | |
| CRYBG3 | SNV | Missense_Mutation | rs746125280 | c.7034N>A | p.Arg2345Gln | p.R2345Q | Q68DQ2 | protein_coding | tolerated(1) | benign(0.001) | TCGA-AN-A046-01 | Breast | breast invasive carcinoma | Female | >=65 | I/II | Unknown | Unknown | SD |
| CRYBG3 | SNV | Missense_Mutation | c.6529N>A | p.Asp2177Asn | p.D2177N | Q68DQ2 | protein_coding | tolerated(0.05) | possibly_damaging(0.664) | TCGA-AR-A250-01 | Breast | breast invasive carcinoma | Female | <65 | I/II | Chemotherapy | doxorubicin | SD | |
| CRYBG3 | SNV | Missense_Mutation | c.6995N>C | p.Val2332Ala | p.V2332A | Q68DQ2 | protein_coding | deleterious(0) | possibly_damaging(0.887) | TCGA-B6-A0RE-01 | Breast | breast invasive carcinoma | Female | <65 | I/II | Unknown | Unknown | SD | |
| CRYBG3 | SNV | Missense_Mutation | rs766412063 | c.8465N>A | p.Ser2822Asn | p.S2822N | Q68DQ2 | protein_coding | deleterious(0) | probably_damaging(1) | TCGA-BH-A0HF-01 | Breast | breast invasive carcinoma | Female | >=65 | I/II | Hormone Therapy | arimidex | SD |
| CRYBG3 | SNV | Missense_Mutation | c.6079N>A | p.His2027Asn | p.H2027N | Q68DQ2 | protein_coding | deleterious(0.02) | benign(0) | TCGA-D8-A27G-01 | Breast | breast invasive carcinoma | Female | >=65 | I/II | Unknown | Unknown | SD | |
| CRYBG3 | SNV | Missense_Mutation | c.7598N>G | p.His2533Arg | p.H2533R | Q68DQ2 | protein_coding | tolerated(0.31) | benign(0.345) | TCGA-E2-A14W-01 | Breast | breast invasive carcinoma | Male | >=65 | I/II | Chemotherapy | cytoxan | SD | |
| CRYBG3 | SNV | Missense_Mutation | rs753391188 | c.7687N>T | p.Arg2563Trp | p.R2563W | Q68DQ2 | protein_coding | deleterious(0) | probably_damaging(0.975) | TCGA-E2-A155-01 | Breast | breast invasive carcinoma | Female | <65 | I/II | Chemotherapy | cytoxan | SD |
| CRYBG3 | SNV | Missense_Mutation | c.7360N>C | p.Glu2454Gln | p.E2454Q | Q68DQ2 | protein_coding | deleterious(0.01) | probably_damaging(0.974) | TCGA-E2-A15M-01 | Breast | breast invasive carcinoma | Female | >=65 | I/II | Hormone Therapy | arimidex | SD |
| Page: 1 2 3 4 5 6 7 8 9 10 11 12 13 14 15 16 17 18 19 20 21 22 23 |
Top |
Related drugs of malignant transformation related genes |
| Identification of chemicals and drugs interact with genes involved in malignant transfromation |
| (DGIdb 4.0) |
| Entrez ID | Symbol | Category | Interaction Types | Drug Claim Name | Drug Name | PMIDs |
| Page: 1 |

Copyright 2023-Present -The University of Texas Health Science Center at Houston |