
|
|||||
|
 | |
| |
| |
| |
| |
| |
|
Gene: CRTC1 |
Gene summary for CRTC1 |
| Gene information | Species | Human | Gene symbol | CRTC1 | Gene ID | 23373 |
| Gene name | CREB regulated transcription coactivator 1 | |
| Gene Alias | MAML2 | |
| Cytomap | 19p13.11 | |
| Gene Type | protein-coding | GO ID | GO:0003008 | UniProtAcc | Q6UUV9 |
Top |
Malignant transformation analysis |
| Identification of the aberrant gene expression in precancerous and cancerous lesions by comparing the gene expression of stem-like cells in diseased tissues with normal stem cells |
| Entrez ID | Symbol | Replicates | Species | Organ | Tissue | Adj P-value | Log2FC | Malignancy |
| 23373 | CRTC1 | HCC1_Meng | Human | Liver | HCC | 1.38e-23 | 8.36e-03 | 0.0246 |
| 23373 | CRTC1 | HCC2_Meng | Human | Liver | HCC | 3.93e-04 | 2.57e-02 | 0.0107 |
| 23373 | CRTC1 | HCC1 | Human | Liver | HCC | 4.48e-02 | 1.86e+00 | 0.5336 |
| 23373 | CRTC1 | HCC2 | Human | Liver | HCC | 1.90e-04 | 2.06e+00 | 0.5341 |
| 23373 | CRTC1 | S014 | Human | Liver | HCC | 2.58e-09 | 4.77e-01 | 0.2254 |
| 23373 | CRTC1 | S015 | Human | Liver | HCC | 2.14e-10 | 6.09e-01 | 0.2375 |
| 23373 | CRTC1 | S016 | Human | Liver | HCC | 2.76e-11 | 4.65e-01 | 0.2243 |
| Page: 1 |
| Tissue | Expression Dynamics | Abbreviation |
| Liver | 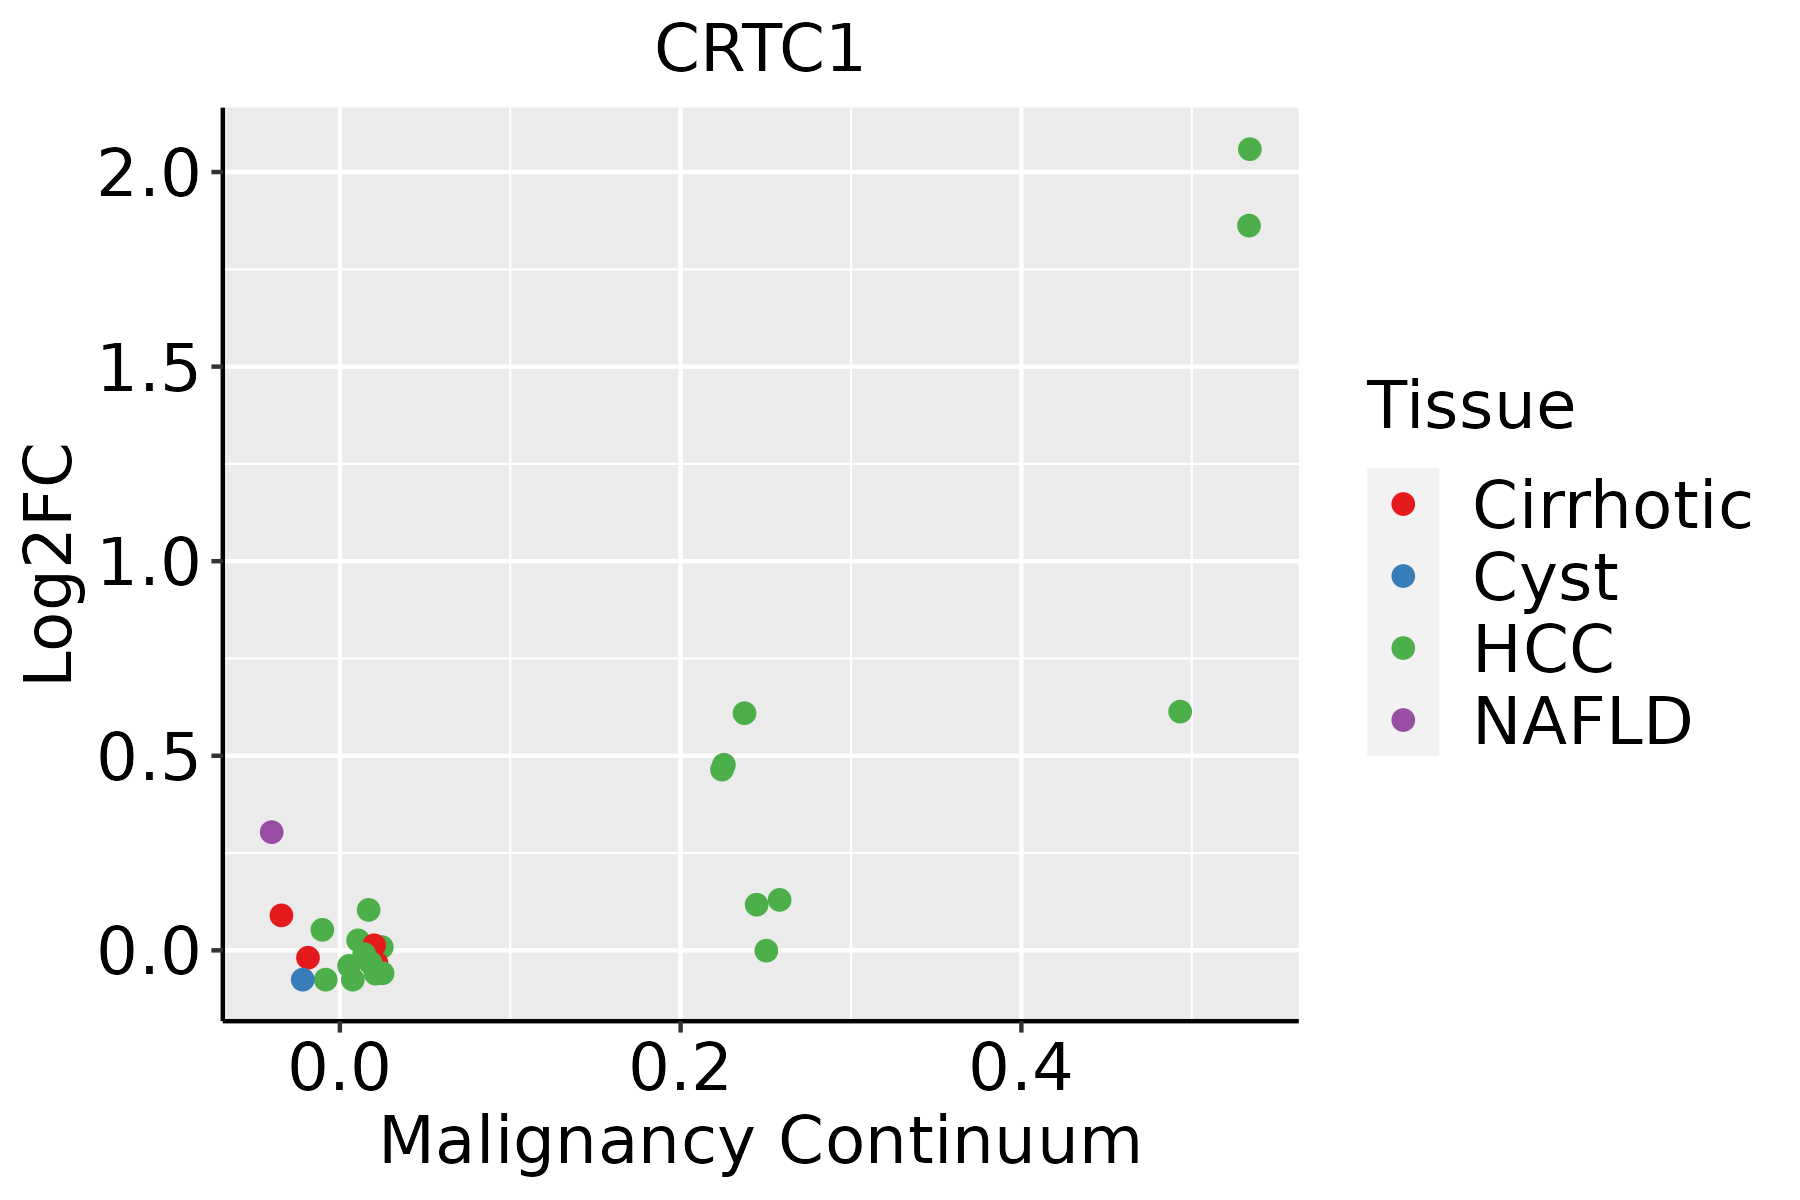 | HCC: Hepatocellular carcinoma |
| NAFLD: Non-alcoholic fatty liver disease |
| ∗log2FC in expression of this searched gene in stem-like cells from each diseased tissue sample relative to stem-like cells in normal samples in each tissue plotted against the malignancy continuum. Samples are colored based on if they are from different disease stage. |
Top |
Malignant transformation related pathway analysis |
| Find out the enriched GO biological processes and KEGG pathways involved in transition from healthy to precancer to cancer |
| Tissue | Disease Stage | Enriched GO biological Processes |
| Colorectum | AD |  |
| Colorectum | SER |  |
| Colorectum | MSS |  |
| Colorectum | MSI-H |  |
| Colorectum | FAP |  |
| ∗Top 15 enriched GO BP terms are showed in the bar plot of each disease state in each tissue. Each row represents a significant GO biological process which is colored according to the -log10(p.adjust). |
| Page: 1 2 3 4 5 6 7 8 9 |
| GO ID | Tissue | Disease Stage | Description | Gene Ratio | Bg Ratio | pvalue | p.adjust | Count |
| GO:003134611 | Liver | HCC | positive regulation of cell projection organization | 193/7958 | 353/18723 | 2.28e-06 | 3.08e-05 | 193 |
| GO:000762321 | Liver | HCC | circadian rhythm | 117/7958 | 210/18723 | 7.29e-05 | 6.54e-04 | 117 |
| GO:004851121 | Liver | HCC | rhythmic process | 156/7958 | 298/18723 | 3.54e-04 | 2.46e-03 | 156 |
| GO:00510902 | Liver | HCC | regulation of DNA-binding transcription factor activity | 220/7958 | 440/18723 | 8.04e-04 | 4.82e-03 | 220 |
| GO:001097511 | Liver | HCC | regulation of neuron projection development | 220/7958 | 445/18723 | 1.68e-03 | 8.78e-03 | 220 |
| GO:0010976 | Liver | HCC | positive regulation of neuron projection development | 88/7958 | 163/18723 | 1.98e-03 | 1.00e-02 | 88 |
| GO:00093146 | Liver | HCC | response to radiation | 223/7958 | 456/18723 | 3.08e-03 | 1.43e-02 | 223 |
| GO:0051262 | Liver | HCC | protein tetramerization | 50/7958 | 87/18723 | 3.42e-03 | 1.55e-02 | 50 |
| GO:00510913 | Liver | HCC | positive regulation of DNA-binding transcription factor activity | 131/7958 | 260/18723 | 5.98e-03 | 2.45e-02 | 131 |
| GO:004275211 | Liver | HCC | regulation of circadian rhythm | 65/7958 | 121/18723 | 8.25e-03 | 3.24e-02 | 65 |
| GO:001635811 | Liver | HCC | dendrite development | 121/7958 | 243/18723 | 1.26e-02 | 4.56e-02 | 121 |
| GO:0051289 | Liver | HCC | protein homotetramerization | 33/7958 | 57/18723 | 1.37e-02 | 4.86e-02 | 33 |
| Page: 1 |
| Pathway ID | Tissue | Disease Stage | Description | Gene Ratio | Bg Ratio | pvalue | p.adjust | qvalue | Count |
| hsa0516622 | Liver | HCC | Human T-cell leukemia virus 1 infection | 139/4020 | 222/8465 | 3.17e-06 | 2.79e-05 | 1.55e-05 | 139 |
| hsa0516632 | Liver | HCC | Human T-cell leukemia virus 1 infection | 139/4020 | 222/8465 | 3.17e-06 | 2.79e-05 | 1.55e-05 | 139 |
| Page: 1 |
Top |
Cell-cell communication analysis |
| Identification of potential cell-cell interactions between two cell types and their ligand-receptor pairs for different disease states |
| Ligand | Receptor | LRpair | Pathway | Tissue | Disease Stage |
| Page: 1 |
Top |
Single-cell gene regulatory network inference analysis |
| Find out the significant the regulons (TFs) and the target genes of each regulon across cell types for different disease states |
| TF | Cell Type | Tissue | Disease Stage | Target Gene | RSS | Regulon Activity |
| ∗The dot plots of a searched regulon are shown for all cell subpopulations in each disease state of each tissue based on the regulon specific score inferred using pySCENIC and by calculating the average expression. |
| Page: 1 |
Top |
Somatic mutation of malignant transformation related genes |
| Annotation of somatic variants for genes involved in malignant transformation |
| Hugo Symbol | Variant Class | Variant Classification | dbSNP RS | HGVSc | HGVSp | HGVSp Short | SWISSPROT | BIOTYPE | SIFT | PolyPhen | Tumor Sample Barcode | Tissue | Histology | Sex | Age | Stage | Therapy Types | Drugs | Outcome |
| CRTC1 | SNV | Missense_Mutation | novel | c.1795G>A | p.Gly599Arg | p.G599R | Q6UUV9 | protein_coding | tolerated(0.05) | benign(0.057) | TCGA-E2-A1LE-01 | Breast | breast invasive carcinoma | Female | >=65 | III/IV | Chemotherapy | herceptin | PD |
| CRTC1 | deletion | Frame_Shift_Del | rs779900748 | c.1754delN | p.Ser588AlafsTer6 | p.S588Afs*6 | Q6UUV9 | protein_coding | TCGA-BH-A18G-01 | Breast | breast invasive carcinoma | Female | >=65 | I/II | Unknown | Unknown | SD | ||
| CRTC1 | SNV | Missense_Mutation | novel | c.1843N>C | p.Glu615Gln | p.E615Q | Q6UUV9 | protein_coding | deleterious(0) | possibly_damaging(0.869) | TCGA-C5-A8YT-01 | Cervix | cervical & endocervical cancer | Female | <65 | I/II | Chemotherapy | cisplatin | PD |
| CRTC1 | SNV | Missense_Mutation | c.1329N>C | p.Glu443Asp | p.E443D | Q6UUV9 | protein_coding | tolerated_low_confidence(0.56) | benign(0) | TCGA-DR-A0ZM-01 | Cervix | cervical & endocervical cancer | Female | <65 | III/IV | Unspecific | Cisplatin | SD | |
| CRTC1 | SNV | Missense_Mutation | c.488N>A | p.Arg163Lys | p.R163K | Q6UUV9 | protein_coding | deleterious(0.01) | probably_damaging(0.928) | TCGA-IR-A3LA-01 | Cervix | cervical & endocervical cancer | Female | <65 | I/II | Chemotherapy | cisplatin | CR | |
| CRTC1 | SNV | Missense_Mutation | c.214G>A | p.Gly72Arg | p.G72R | Q6UUV9 | protein_coding | tolerated(0.08) | probably_damaging(0.912) | TCGA-Q1-A73O-01 | Cervix | cervical & endocervical cancer | Female | <65 | I/II | Chemotherapy | cisplatin | CR | |
| CRTC1 | SNV | Missense_Mutation | c.215G>A | p.Gly72Glu | p.G72E | Q6UUV9 | protein_coding | deleterious(0) | probably_damaging(0.986) | TCGA-Q1-A73O-01 | Cervix | cervical & endocervical cancer | Female | <65 | I/II | Chemotherapy | cisplatin | CR | |
| CRTC1 | SNV | Missense_Mutation | c.790G>A | p.Asp264Asn | p.D264N | Q6UUV9 | protein_coding | deleterious(0) | probably_damaging(0.996) | TCGA-VS-A8QA-01 | Cervix | cervical & endocervical cancer | Female | <65 | I/II | Unknown | Unknown | SD | |
| CRTC1 | deletion | Frame_Shift_Del | rs779900748 | c.1761delC | p.Ser588AlafsTer6 | p.S588Afs*6 | Q6UUV9 | protein_coding | TCGA-EA-A410-01 | Cervix | cervical & endocervical cancer | Female | <65 | I/II | Unknown | Unknown | SD | ||
| CRTC1 | SNV | Missense_Mutation | c.8N>T | p.Thr3Ile | p.T3I | Q6UUV9 | protein_coding | deleterious(0) | possibly_damaging(0.518) | TCGA-A6-6780-01 | Colorectum | colon adenocarcinoma | Male | >=65 | I/II | Unknown | Unknown | SD |
| Page: 1 2 3 4 5 6 7 8 |
Top |
Related drugs of malignant transformation related genes |
| Identification of chemicals and drugs interact with genes involved in malignant transfromation |
| (DGIdb 4.0) |
| Entrez ID | Symbol | Category | Interaction Types | Drug Claim Name | Drug Name | PMIDs |
| 23373 | CRTC1 | CLINICALLY ACTIONABLE | XL765 | |||
| 23373 | CRTC1 | CLINICALLY ACTIONABLE | N/A | |||
| 23373 | CRTC1 | CLINICALLY ACTIONABLE | INK128 | SAPANISERTIB | ||
| 23373 | CRTC1 | CLINICALLY ACTIONABLE | NVP-BEZ235 | DACTOLISIB | ||
| 23373 | CRTC1 | CLINICALLY ACTIONABLE | PKI-587 | GEDATOLISIB |
| Page: 1 |

Copyright 2023-Present -The University of Texas Health Science Center at Houston |