
|
|||||
|
 | |
| |
| |
| |
| |
| |
|
Gene: CRTAM |
Gene summary for CRTAM |
| Gene information | Species | Human | Gene symbol | CRTAM | Gene ID | 56253 |
| Gene name | cytotoxic and regulatory T cell molecule | |
| Gene Alias | CD355 | |
| Cytomap | 11q24.1 | |
| Gene Type | protein-coding | GO ID | GO:0001767 | UniProtAcc | O95727 |
Top |
Malignant transformation analysis |
| Identification of the aberrant gene expression in precancerous and cancerous lesions by comparing the gene expression of stem-like cells in diseased tissues with normal stem cells |
| Entrez ID | Symbol | Replicates | Species | Organ | Tissue | Adj P-value | Log2FC | Malignancy |
| 56253 | CRTAM | HCC1 | Human | Liver | HCC | 1.12e-02 | 6.41e-01 | 0.5336 |
| 56253 | CRTAM | HCC2 | Human | Liver | HCC | 7.48e-07 | 7.37e-01 | 0.5341 |
| 56253 | CRTAM | HCC5 | Human | Liver | HCC | 1.44e-13 | 7.62e-01 | 0.4932 |
| Page: 1 |
| Tissue | Expression Dynamics | Abbreviation |
| Liver | 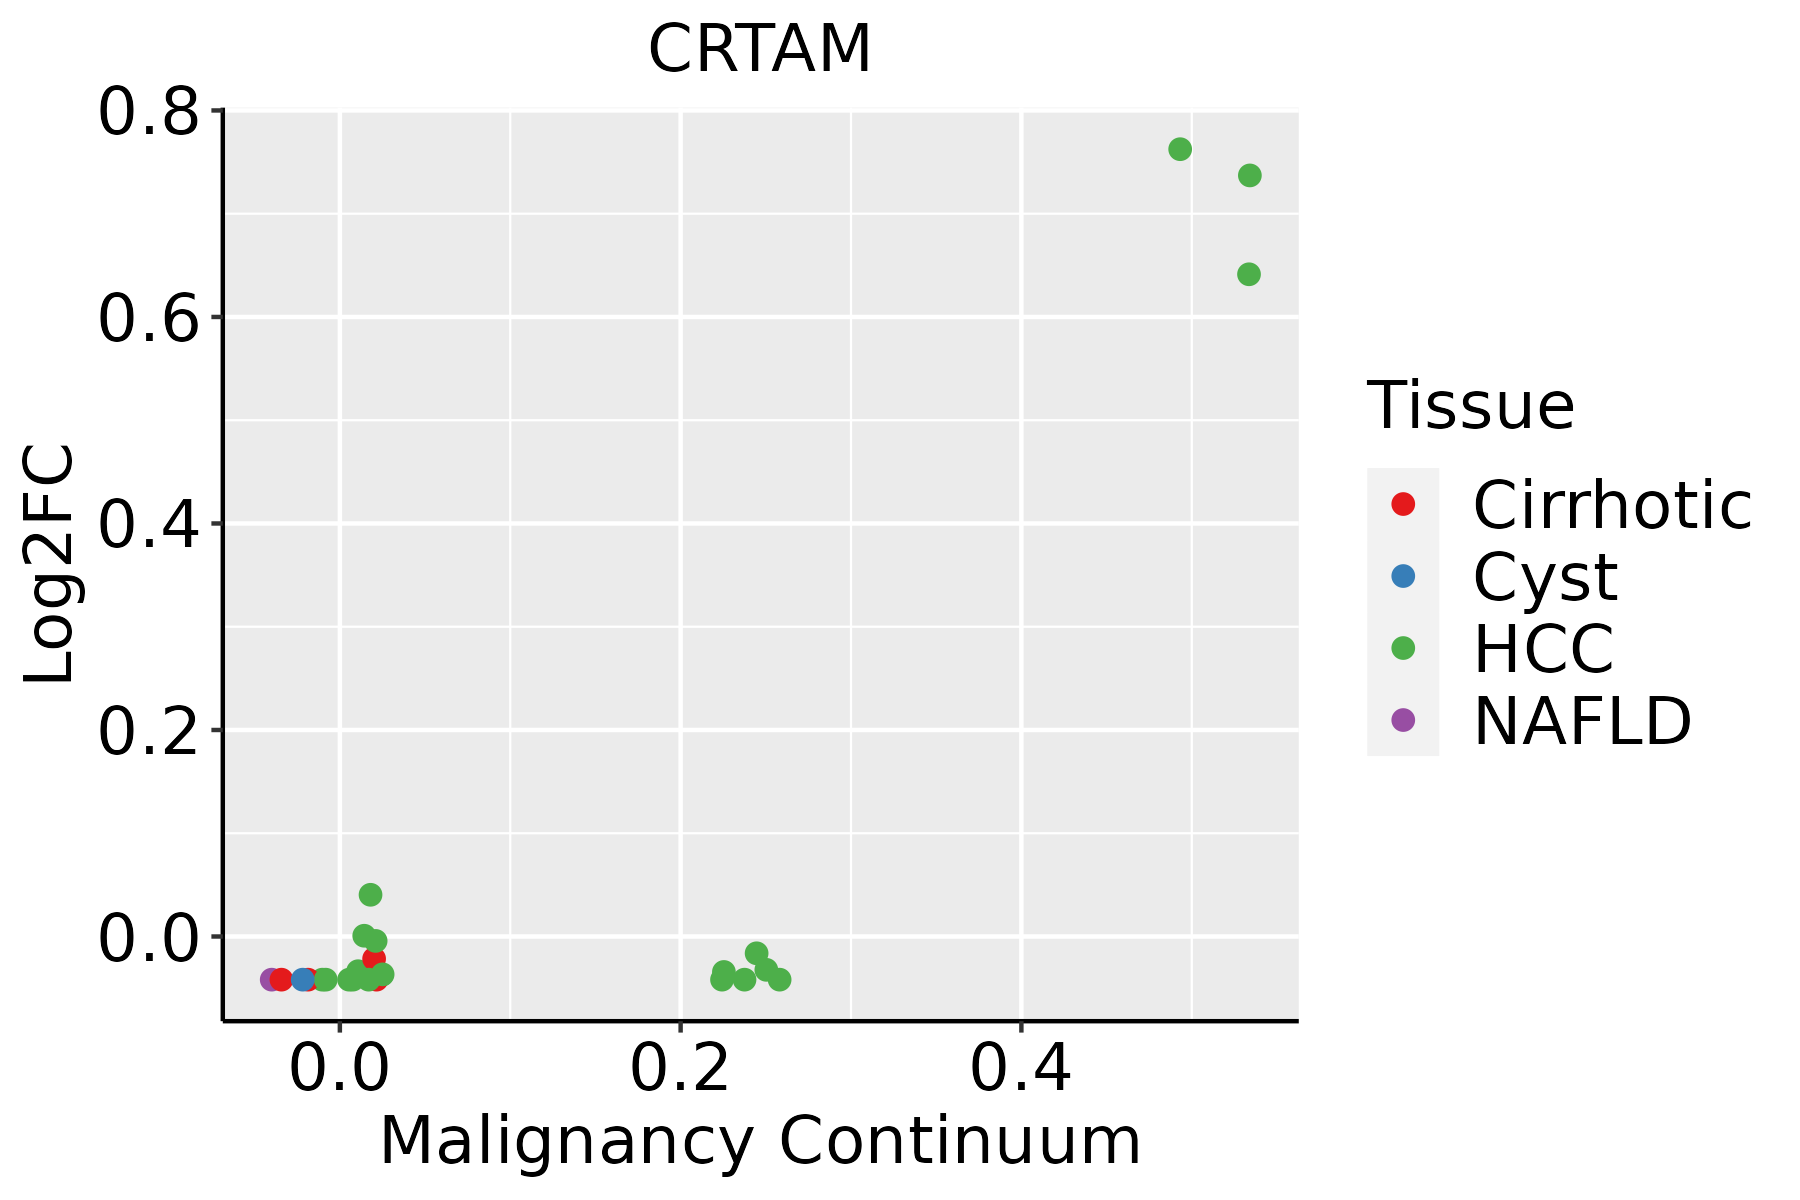 | HCC: Hepatocellular carcinoma |
| NAFLD: Non-alcoholic fatty liver disease |
| ∗log2FC in expression of this searched gene in stem-like cells from each diseased tissue sample relative to stem-like cells in normal samples in each tissue plotted against the malignancy continuum. Samples are colored based on if they are from different disease stage. |
Top |
Malignant transformation related pathway analysis |
| Find out the enriched GO biological processes and KEGG pathways involved in transition from healthy to precancer to cancer |
| Tissue | Disease Stage | Enriched GO biological Processes |
| Colorectum | AD |  |
| Colorectum | SER |  |
| Colorectum | MSS |  |
| Colorectum | MSI-H |  |
| Colorectum | FAP |  |
| ∗Top 15 enriched GO BP terms are showed in the bar plot of each disease state in each tissue. Each row represents a significant GO biological process which is colored according to the -log10(p.adjust). |
| Page: 1 2 3 4 5 6 7 8 9 |
| GO ID | Tissue | Disease Stage | Description | Gene Ratio | Bg Ratio | pvalue | p.adjust | Count |
| GO:000716322 | Liver | HCC | establishment or maintenance of cell polarity | 133/7958 | 218/18723 | 2.48e-08 | 5.73e-07 | 133 |
| GO:00028312 | Liver | HCC | regulation of response to biotic stimulus | 173/7958 | 327/18723 | 8.55e-05 | 7.48e-04 | 173 |
| GO:003001022 | Liver | HCC | establishment of cell polarity | 82/7958 | 143/18723 | 2.38e-04 | 1.79e-03 | 82 |
| GO:00450881 | Liver | HCC | regulation of innate immune response | 113/7958 | 218/18723 | 3.27e-03 | 1.50e-02 | 113 |
| Page: 1 |
| Pathway ID | Tissue | Disease Stage | Description | Gene Ratio | Bg Ratio | pvalue | p.adjust | qvalue | Count |
| Page: 1 |
Top |
Cell-cell communication analysis |
| Identification of potential cell-cell interactions between two cell types and their ligand-receptor pairs for different disease states |
| Ligand | Receptor | LRpair | Pathway | Tissue | Disease Stage |
| Page: 1 |
Top |
Single-cell gene regulatory network inference analysis |
| Find out the significant the regulons (TFs) and the target genes of each regulon across cell types for different disease states |
| TF | Cell Type | Tissue | Disease Stage | Target Gene | RSS | Regulon Activity |
| ∗The dot plots of a searched regulon are shown for all cell subpopulations in each disease state of each tissue based on the regulon specific score inferred using pySCENIC and by calculating the average expression. |
| Page: 1 |
Top |
Somatic mutation of malignant transformation related genes |
| Annotation of somatic variants for genes involved in malignant transformation |
| Hugo Symbol | Variant Class | Variant Classification | dbSNP RS | HGVSc | HGVSp | HGVSp Short | SWISSPROT | BIOTYPE | SIFT | PolyPhen | Tumor Sample Barcode | Tissue | Histology | Sex | Age | Stage | Therapy Types | Drugs | Outcome |
| CRTAM | SNV | Missense_Mutation | c.11G>C | p.Arg4Thr | p.R4T | O95727 | protein_coding | tolerated(0.08) | benign(0) | TCGA-A1-A0SI-01 | Breast | breast invasive carcinoma | Female | <65 | I/II | Unknown | Unknown | SD | |
| CRTAM | SNV | Missense_Mutation | c.960G>C | p.Lys320Asn | p.K320N | O95727 | protein_coding | deleterious(0) | probably_damaging(0.997) | TCGA-AC-A23H-01 | Breast | breast invasive carcinoma | Female | >=65 | I/II | Unknown | Unknown | PD | |
| CRTAM | SNV | Missense_Mutation | novel | c.944N>T | p.Ala315Val | p.A315V | O95727 | protein_coding | deleterious(0) | probably_damaging(0.941) | TCGA-AN-A046-01 | Breast | breast invasive carcinoma | Female | >=65 | I/II | Unknown | Unknown | SD |
| CRTAM | SNV | Missense_Mutation | c.104C>T | p.Thr35Ile | p.T35I | O95727 | protein_coding | tolerated(0.15) | benign(0.092) | TCGA-AN-A0AR-01 | Breast | breast invasive carcinoma | Female | <65 | I/II | Unknown | Unknown | SD | |
| CRTAM | SNV | Missense_Mutation | c.964G>C | p.Glu322Gln | p.E322Q | O95727 | protein_coding | deleterious(0) | probably_damaging(0.994) | TCGA-GM-A2DB-01 | Breast | breast invasive carcinoma | Female | <65 | I/II | Chemotherapy | taxol | CR | |
| CRTAM | insertion | Frame_Shift_Ins | novel | c.559_560insATATGAT | p.Thr187AsnfsTer31 | p.T187Nfs*31 | O95727 | protein_coding | TCGA-A8-A09B-01 | Breast | breast invasive carcinoma | Female | <65 | III/IV | Chemotherapy | 5-fluorouracil | SD | ||
| CRTAM | insertion | In_Frame_Ins | novel | c.562_563insCCCTAT | p.Thr187_Tyr188insSerLeu | p.T187_Y188insSL | O95727 | protein_coding | TCGA-A8-A09B-01 | Breast | breast invasive carcinoma | Female | <65 | III/IV | Chemotherapy | 5-fluorouracil | SD | ||
| CRTAM | SNV | Missense_Mutation | c.137C>G | p.Ser46Cys | p.S46C | O95727 | protein_coding | deleterious(0.01) | possibly_damaging(0.607) | TCGA-VS-A9UH-01 | Cervix | cervical & endocervical cancer | Female | <65 | I/II | Chemotherapy | cisplatin | CR | |
| CRTAM | SNV | Missense_Mutation | novel | c.307N>T | p.Asp103Tyr | p.D103Y | O95727 | protein_coding | deleterious(0.05) | possibly_damaging(0.592) | TCGA-VS-A9UJ-01 | Cervix | cervical & endocervical cancer | Female | <65 | I/II | Unknown | Unknown | PD |
| CRTAM | SNV | Missense_Mutation | c.811A>G | p.Thr271Ala | p.T271A | O95727 | protein_coding | tolerated(0.28) | benign(0) | TCGA-AA-3811-01 | Colorectum | colon adenocarcinoma | Female | >=65 | III/IV | Unknown | Unknown | PD |
| Page: 1 2 3 4 5 |
Top |
Related drugs of malignant transformation related genes |
| Identification of chemicals and drugs interact with genes involved in malignant transfromation |
| (DGIdb 4.0) |
| Entrez ID | Symbol | Category | Interaction Types | Drug Claim Name | Drug Name | PMIDs |
| Page: 1 |

Copyright 2023-Present -The University of Texas Health Science Center at Houston |