
|
|||||
|
 | |
| |
| |
| |
| |
| |
|
Gene: CRMP1 |
Gene summary for CRMP1 |
| Gene information | Species | Human | Gene symbol | CRMP1 | Gene ID | 1400 |
| Gene name | collapsin response mediator protein 1 | |
| Gene Alias | CRMP-1 | |
| Cytomap | 4p16.2 | |
| Gene Type | protein-coding | GO ID | GO:0000226 | UniProtAcc | B3KT07 |
Top |
Malignant transformation analysis |
| Identification of the aberrant gene expression in precancerous and cancerous lesions by comparing the gene expression of stem-like cells in diseased tissues with normal stem cells |
| Entrez ID | Symbol | Replicates | Species | Organ | Tissue | Adj P-value | Log2FC | Malignancy |
| 1400 | CRMP1 | LZE7T | Human | Esophagus | ESCC | 8.32e-04 | 2.55e-01 | 0.0667 |
| 1400 | CRMP1 | P10T-E | Human | Esophagus | ESCC | 1.56e-08 | 2.10e-01 | 0.116 |
| 1400 | CRMP1 | P12T-E | Human | Esophagus | ESCC | 2.63e-13 | 4.21e-01 | 0.1122 |
| 1400 | CRMP1 | P21T-E | Human | Esophagus | ESCC | 2.96e-04 | 1.42e-01 | 0.1617 |
| 1400 | CRMP1 | P26T-E | Human | Esophagus | ESCC | 2.18e-02 | 8.32e-02 | 0.1276 |
| 1400 | CRMP1 | P28T-E | Human | Esophagus | ESCC | 2.45e-18 | 3.63e-01 | 0.1149 |
| 1400 | CRMP1 | P30T-E | Human | Esophagus | ESCC | 1.11e-14 | 7.72e-01 | 0.137 |
| 1400 | CRMP1 | P32T-E | Human | Esophagus | ESCC | 6.66e-09 | 2.29e-01 | 0.1666 |
| 1400 | CRMP1 | P49T-E | Human | Esophagus | ESCC | 1.17e-10 | 8.88e-01 | 0.1768 |
| 1400 | CRMP1 | P52T-E | Human | Esophagus | ESCC | 1.54e-12 | 3.82e-01 | 0.1555 |
| 1400 | CRMP1 | P74T-E | Human | Esophagus | ESCC | 5.51e-09 | 3.29e-01 | 0.1479 |
| 1400 | CRMP1 | P107T-E | Human | Esophagus | ESCC | 9.41e-05 | 2.51e-01 | 0.171 |
| 1400 | CRMP1 | ATC13 | Human | Thyroid | ATC | 3.80e-36 | 7.75e-01 | 0.34 |
| 1400 | CRMP1 | ATC3 | Human | Thyroid | ATC | 6.22e-03 | 2.13e-01 | 0.338 |
| 1400 | CRMP1 | ATC5 | Human | Thyroid | ATC | 2.60e-44 | 8.31e-01 | 0.34 |
| Page: 1 |
| Tissue | Expression Dynamics | Abbreviation |
| Esophagus | 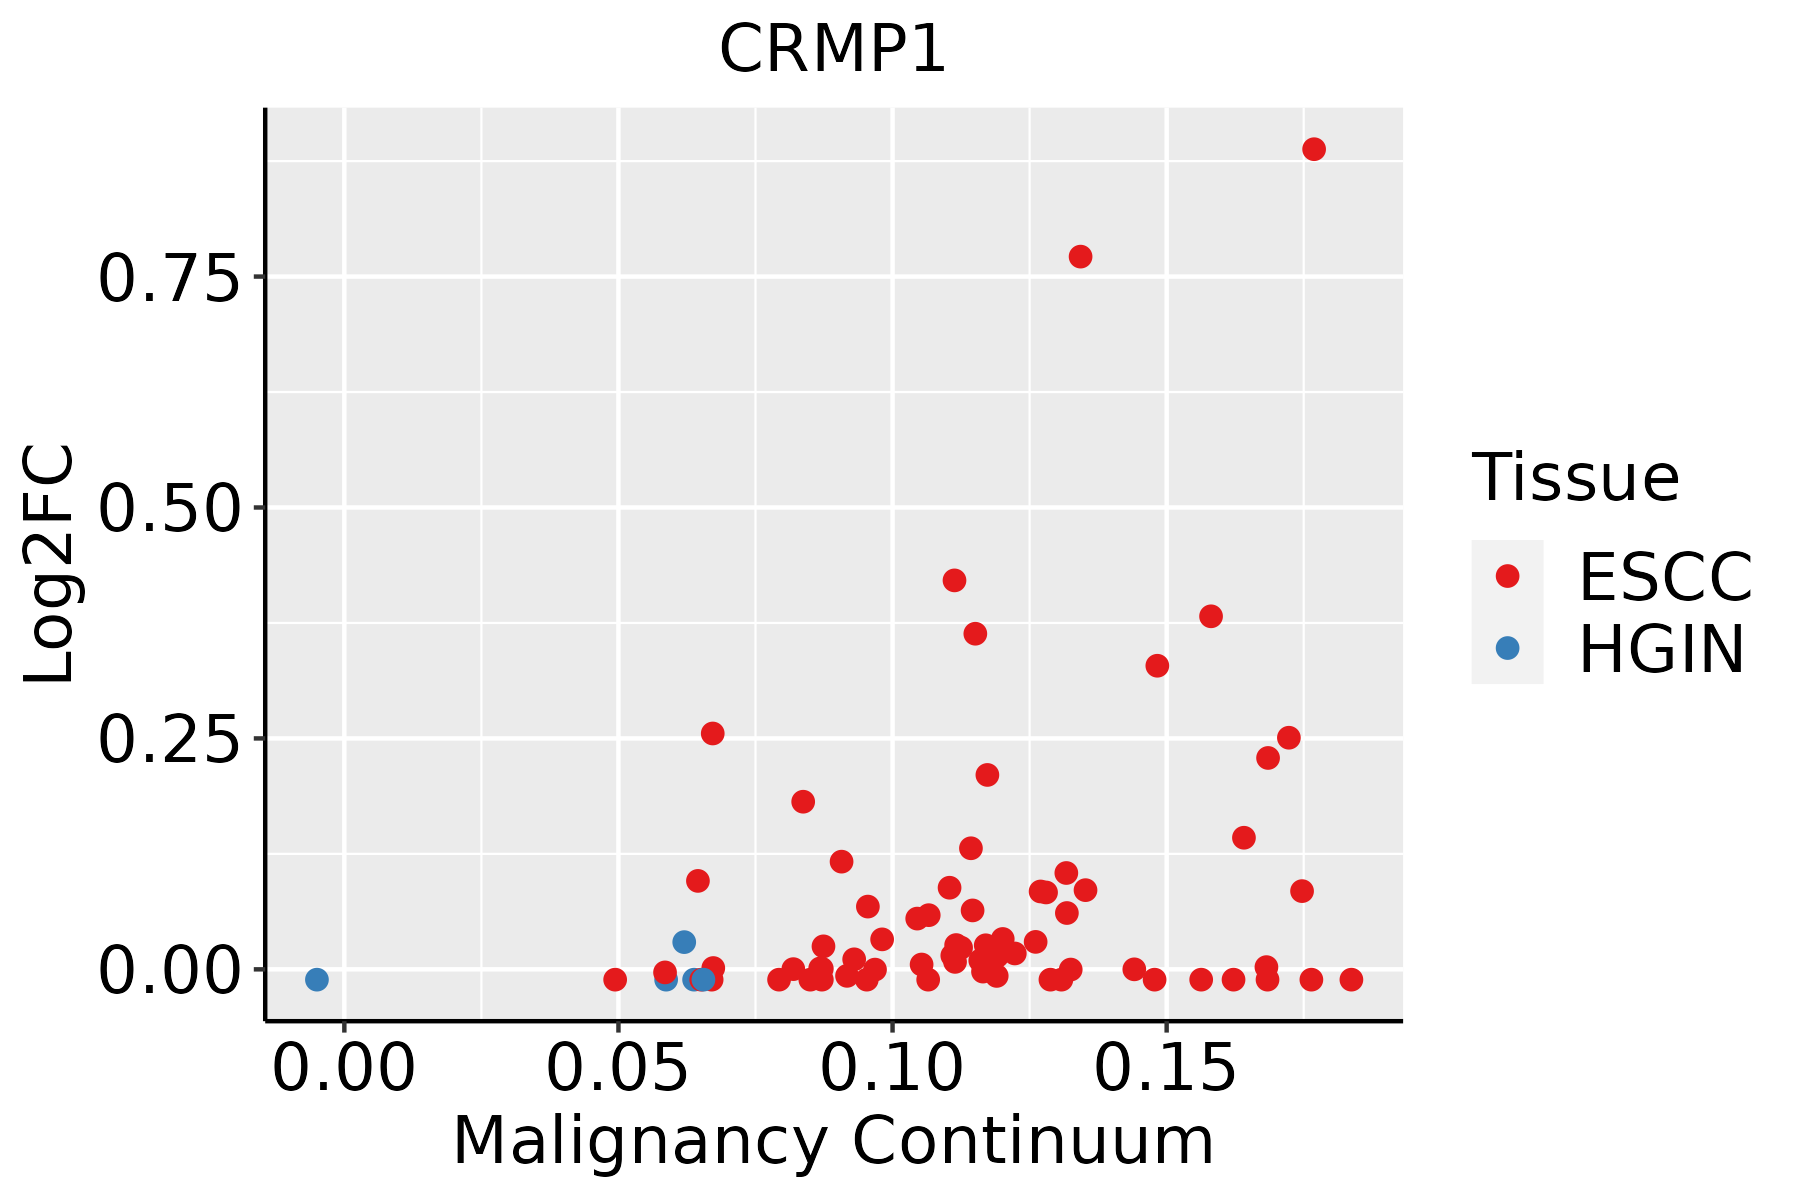 | ESCC: Esophageal squamous cell carcinoma |
| HGIN: High-grade intraepithelial neoplasias | ||
| LGIN: Low-grade intraepithelial neoplasias | ||
| Thyroid | 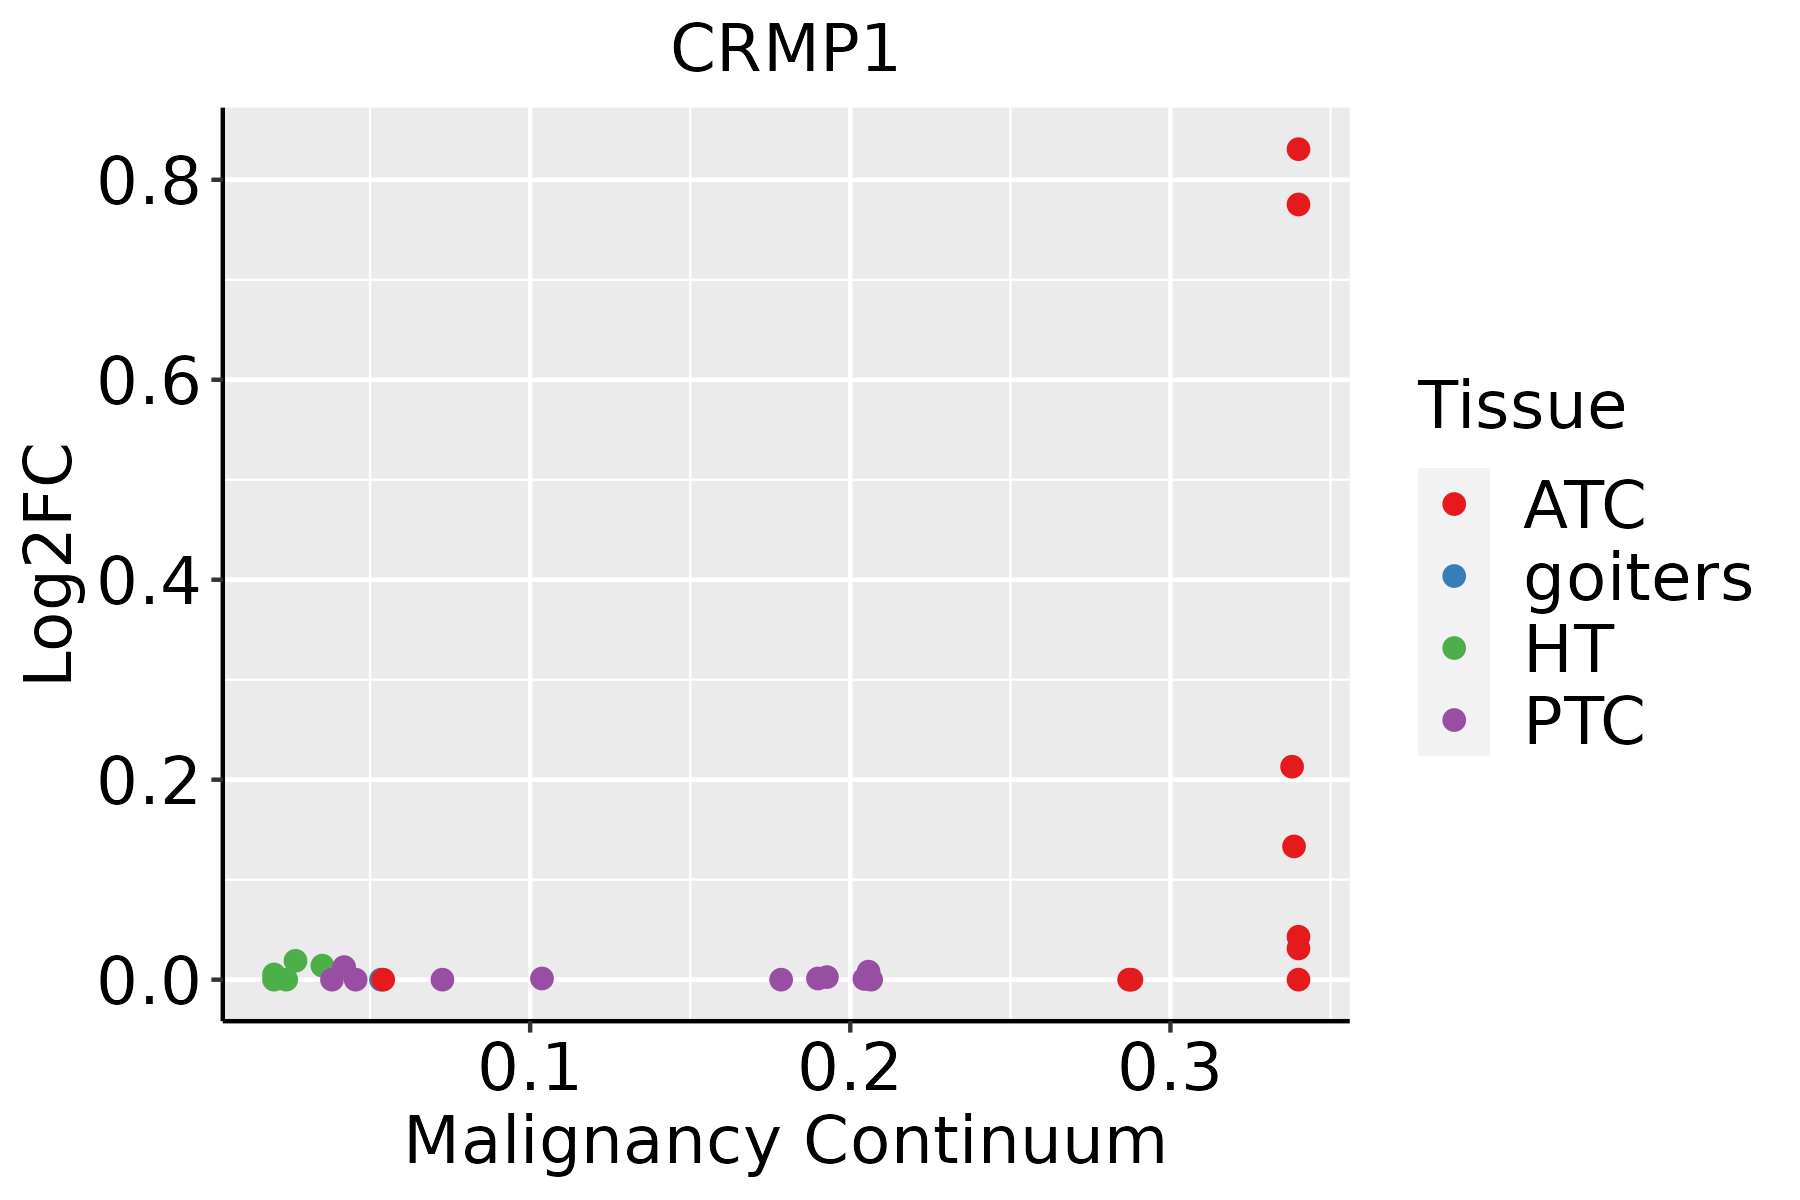 | ATC: Anaplastic thyroid cancer |
| HT: Hashimoto's thyroiditis | ||
| PTC: Papillary thyroid cancer |
| ∗log2FC in expression of this searched gene in stem-like cells from each diseased tissue sample relative to stem-like cells in normal samples in each tissue plotted against the malignancy continuum. Samples are colored based on if they are from different disease stage. |
Top |
Malignant transformation related pathway analysis |
| Find out the enriched GO biological processes and KEGG pathways involved in transition from healthy to precancer to cancer |
| Tissue | Disease Stage | Enriched GO biological Processes |
| Colorectum | AD |  |
| Colorectum | SER |  |
| Colorectum | MSS |  |
| Colorectum | MSI-H |  |
| Colorectum | FAP |  |
| ∗Top 15 enriched GO BP terms are showed in the bar plot of each disease state in each tissue. Each row represents a significant GO biological process which is colored according to the -log10(p.adjust). |
| Page: 1 2 3 4 5 6 7 8 9 |
| GO ID | Tissue | Disease Stage | Description | Gene Ratio | Bg Ratio | pvalue | p.adjust | Count |
| GO:0051098111 | Esophagus | ESCC | regulation of binding | 251/8552 | 363/18723 | 6.73e-20 | 8.46e-18 | 251 |
| GO:004339320 | Esophagus | ESCC | regulation of protein binding | 135/8552 | 196/18723 | 3.69e-11 | 1.22e-09 | 135 |
| GO:0051100111 | Esophagus | ESCC | negative regulation of binding | 109/8552 | 162/18723 | 2.10e-08 | 4.03e-07 | 109 |
| GO:003209116 | Esophagus | ESCC | negative regulation of protein binding | 65/8552 | 94/18723 | 3.46e-06 | 3.82e-05 | 65 |
| GO:006156415 | Esophagus | ESCC | axon development | 251/8552 | 467/18723 | 2.41e-04 | 1.49e-03 | 251 |
| GO:001097516 | Esophagus | ESCC | regulation of neuron projection development | 240/8552 | 445/18723 | 2.48e-04 | 1.53e-03 | 240 |
| GO:000740915 | Esophagus | ESCC | axonogenesis | 219/8552 | 418/18723 | 3.14e-03 | 1.31e-02 | 219 |
| GO:005109834 | Thyroid | ATC | regulation of binding | 203/6293 | 363/18723 | 1.18e-18 | 1.55e-16 | 203 |
| GO:004339327 | Thyroid | ATC | regulation of protein binding | 110/6293 | 196/18723 | 6.99e-11 | 2.22e-09 | 110 |
| GO:001097523 | Thyroid | ATC | regulation of neuron projection development | 212/6293 | 445/18723 | 4.16e-10 | 1.14e-08 | 212 |
| GO:006156423 | Thyroid | ATC | axon development | 220/6293 | 467/18723 | 6.85e-10 | 1.80e-08 | 220 |
| GO:000740919 | Thyroid | ATC | axonogenesis | 197/6293 | 418/18723 | 5.09e-09 | 1.13e-07 | 197 |
| GO:005110027 | Thyroid | ATC | negative regulation of binding | 86/6293 | 162/18723 | 2.41e-07 | 3.73e-06 | 86 |
| GO:003209119 | Thyroid | ATC | negative regulation of protein binding | 51/6293 | 94/18723 | 2.97e-05 | 2.48e-04 | 51 |
| GO:003134514 | Thyroid | ATC | negative regulation of cell projection organization | 86/6293 | 186/18723 | 2.25e-04 | 1.46e-03 | 86 |
| GO:001097712 | Thyroid | ATC | negative regulation of neuron projection development | 66/6293 | 137/18723 | 2.82e-04 | 1.80e-03 | 66 |
| GO:00074113 | Thyroid | ATC | axon guidance | 96/6293 | 227/18723 | 3.74e-03 | 1.63e-02 | 96 |
| GO:00974853 | Thyroid | ATC | neuron projection guidance | 96/6293 | 228/18723 | 4.36e-03 | 1.81e-02 | 96 |
| Page: 1 |
| Pathway ID | Tissue | Disease Stage | Description | Gene Ratio | Bg Ratio | pvalue | p.adjust | qvalue | Count |
| Page: 1 |
Top |
Cell-cell communication analysis |
| Identification of potential cell-cell interactions between two cell types and their ligand-receptor pairs for different disease states |
| Ligand | Receptor | LRpair | Pathway | Tissue | Disease Stage |
| Page: 1 |
Top |
Single-cell gene regulatory network inference analysis |
| Find out the significant the regulons (TFs) and the target genes of each regulon across cell types for different disease states |
| TF | Cell Type | Tissue | Disease Stage | Target Gene | RSS | Regulon Activity |
| ∗The dot plots of a searched regulon are shown for all cell subpopulations in each disease state of each tissue based on the regulon specific score inferred using pySCENIC and by calculating the average expression. |
| Page: 1 |
Top |
Somatic mutation of malignant transformation related genes |
| Annotation of somatic variants for genes involved in malignant transformation |
| Hugo Symbol | Variant Class | Variant Classification | dbSNP RS | HGVSc | HGVSp | HGVSp Short | SWISSPROT | BIOTYPE | SIFT | PolyPhen | Tumor Sample Barcode | Tissue | Histology | Sex | Age | Stage | Therapy Types | Drugs | Outcome |
| CRMP1 | SNV | Missense_Mutation | rs768870212 | c.1625N>T | p.Ala542Val | p.A542V | Q14194 | protein_coding | tolerated(0.06) | benign(0.013) | TCGA-A7-A26H-01 | Breast | breast invasive carcinoma | Female | >=65 | I/II | Hormone Therapy | anastrozole | PD |
| CRMP1 | SNV | Missense_Mutation | novel | c.1177N>G | p.Ile393Val | p.I393V | Q14194 | protein_coding | deleterious(0.03) | benign(0.018) | TCGA-AC-A3W5-01 | Breast | breast invasive carcinoma | Female | >=65 | I/II | Chemotherapy | docetaxel | CR |
| CRMP1 | SNV | Missense_Mutation | rs187171314 | c.1907N>T | p.Ser636Leu | p.S636L | Q14194 | protein_coding | deleterious(0.05) | probably_damaging(0.93) | TCGA-AC-A62Y-01 | Breast | breast invasive carcinoma | Female | >=65 | I/II | Unknown | Unknown | SD |
| CRMP1 | SNV | Missense_Mutation | novel | c.932T>C | p.Val311Ala | p.V311A | Q14194 | protein_coding | deleterious(0.01) | possibly_damaging(0.55) | TCGA-AN-A046-01 | Breast | breast invasive carcinoma | Female | >=65 | I/II | Unknown | Unknown | SD |
| CRMP1 | SNV | Missense_Mutation | rs758401728 | c.1622C>T | p.Ser541Leu | p.S541L | Q14194 | protein_coding | tolerated(0.71) | benign(0.051) | TCGA-E2-A155-01 | Breast | breast invasive carcinoma | Female | <65 | I/II | Chemotherapy | cytoxan | SD |
| CRMP1 | SNV | Missense_Mutation | rs201976585 | c.1750C>T | p.Pro584Ser | p.P584S | Q14194 | protein_coding | tolerated(0.08) | benign(0.009) | TCGA-EW-A1J5-01 | Breast | breast invasive carcinoma | Female | <65 | I/II | Chemotherapy | adriamycin | SD |
| CRMP1 | deletion | Frame_Shift_Del | novel | c.865delN | p.Gln289LysfsTer20 | p.Q289Kfs*20 | Q14194 | protein_coding | TCGA-EW-A2FV-01 | Breast | breast invasive carcinoma | Female | <65 | III/IV | Chemotherapy | docetaxel | SD | ||
| CRMP1 | SNV | Missense_Mutation | c.683C>G | p.Ser228Cys | p.S228C | Q14194 | protein_coding | tolerated(0.19) | benign(0.029) | TCGA-DR-A0ZM-01 | Cervix | cervical & endocervical cancer | Female | <65 | III/IV | Unspecific | Cisplatin | SD | |
| CRMP1 | SNV | Missense_Mutation | rs768763171 | c.1754G>A | p.Arg585Gln | p.R585Q | Q14194 | protein_coding | tolerated(0.11) | probably_damaging(0.984) | TCGA-EA-A3HU-01 | Cervix | cervical & endocervical cancer | Female | <65 | I/II | Unknown | Unknown | SD |
| CRMP1 | SNV | Missense_Mutation | novel | c.479N>T | p.Gly160Val | p.G160V | Q14194 | protein_coding | deleterious(0) | probably_damaging(0.996) | TCGA-VS-A9U6-01 | Cervix | cervical & endocervical cancer | Female | <65 | I/II | Chemotherapy | cisplatin | PD |
| Page: 1 2 3 4 5 6 7 8 9 10 11 12 |
Top |
Related drugs of malignant transformation related genes |
| Identification of chemicals and drugs interact with genes involved in malignant transfromation |
| (DGIdb 4.0) |
| Entrez ID | Symbol | Category | Interaction Types | Drug Claim Name | Drug Name | PMIDs |
| 1400 | CRMP1 | NA | METHIMAZOLE | METHIMAZOLE | 11694350 |
| Page: 1 |

Copyright 2023-Present -The University of Texas Health Science Center at Houston |