Schematic overview of the cellular and molecular mechanisms involved in the cancer progression, including the proposed cellular and molecular mechanisms in cancer cells trajectory. AT1: alveolar type 1 cells; AT2: alveolar type 2 cells; AAH: atypical adenomatous hyperplasia; AIS: adenocarcinoma in situ; MIA: minimally invasive adenocarcinoma; IA: invasive adenocarcinoma; EMT: epithelial-mesenchymal transition

Home

Download

Statistics

Help

Contact

Center for Computational Systems Medicine
leaf

Gene summary

leaf

Malignant transformation analysis

leaf

Malignant transformation related pathway analysis

leaf

Cell-cell communication analysis

leaf

Single-cell gene regulatory network inference analysis

leaf

Somatic mutation of malignant transformation related genes

leaf

Related drugs of malignant transformation related genes

Gene: CRLS1

Gene summary for CRLS1

check button Gene summary.

Gene informationSpeciesHuman
Gene symbol

CRLS1

Gene ID

54675

Gene namecardiolipin synthase 1
Gene AliasC20orf155
Cytomap20p12.3
Gene Typeprotein-coding
GO ID

GO:0001101

UniProtAcc

Q9UJA2


Top

Malignant transformation analysis

check button Identification of the aberrant gene expression in precancerous and cancerous lesions by comparing the gene expression of stem-like cells in diseased tissues with normal stem cells
check button Malignant transformation involving gene list.
Entrez IDSymbolReplicatesSpeciesOrganTissueAdj P-valueLog2FCMalignancy
54675CRLS1LZE2THumanEsophagusESCC1.17e-022.38e-010.082
54675CRLS1LZE20THumanEsophagusESCC1.90e-028.32e-020.0662
54675CRLS1LZE24THumanEsophagusESCC1.88e-153.19e-010.0596
54675CRLS1P1T-EHumanEsophagusESCC2.94e-095.03e-010.0875
54675CRLS1P2T-EHumanEsophagusESCC1.06e-295.32e-010.1177
54675CRLS1P4T-EHumanEsophagusESCC8.49e-521.21e+000.1323
54675CRLS1P5T-EHumanEsophagusESCC4.43e-285.26e-010.1327
54675CRLS1P8T-EHumanEsophagusESCC2.15e-264.50e-010.0889
54675CRLS1P9T-EHumanEsophagusESCC1.25e-164.22e-010.1131
54675CRLS1P10T-EHumanEsophagusESCC6.26e-459.09e-010.116
54675CRLS1P11T-EHumanEsophagusESCC3.06e-176.73e-010.1426
54675CRLS1P12T-EHumanEsophagusESCC8.34e-255.54e-010.1122
54675CRLS1P15T-EHumanEsophagusESCC5.78e-305.77e-010.1149
54675CRLS1P16T-EHumanEsophagusESCC4.27e-275.79e-010.1153
54675CRLS1P17T-EHumanEsophagusESCC6.05e-052.33e-010.1278
54675CRLS1P19T-EHumanEsophagusESCC6.00e-044.20e-010.1662
54675CRLS1P20T-EHumanEsophagusESCC3.38e-234.97e-010.1124
54675CRLS1P21T-EHumanEsophagusESCC6.00e-366.04e-010.1617
54675CRLS1P22T-EHumanEsophagusESCC2.49e-141.92e-010.1236
54675CRLS1P23T-EHumanEsophagusESCC1.02e-348.96e-010.108
Page: 1 2 3 4 5 6 

check button Transcriptomic changes along malignancy continuum.
TissueExpression DynamicsAbbreviation
EsophagusThe image shows the transcriptomic changes along malignancy continuum.log2FC in expression of this searched gene in stem-like cells from each diseased tissue sample relative to stem-like cells in normal samples in each tissue plotted against the malignancy continuum. Samples are colored based on if they are from different disease stage.ESCC: Esophageal squamous cell carcinoma
HGIN: High-grade intraepithelial neoplasias
LGIN: Low-grade intraepithelial neoplasias
LiverThe image shows the transcriptomic changes along malignancy continuum.log2FC in expression of this searched gene in stem-like cells from each diseased tissue sample relative to stem-like cells in normal samples in each tissue plotted against the malignancy continuum. Samples are colored based on if they are from different disease stage.HCC: Hepatocellular carcinoma
NAFLD: Non-alcoholic fatty liver disease
Oral CavityThe image shows the transcriptomic changes along malignancy continuum.log2FC in expression of this searched gene in stem-like cells from each diseased tissue sample relative to stem-like cells in normal samples in each tissue plotted against the malignancy continuum. Samples are colored based on if they are from different disease stage.EOLP: Erosive Oral lichen planus
LP: leukoplakia
NEOLP: Non-erosive oral lichen planus
OSCC: Oral squamous cell carcinoma
SkinThe image shows the transcriptomic changes along malignancy continuum.log2FC in expression of this searched gene in stem-like cells from each diseased tissue sample relative to stem-like cells in normal samples in each tissue plotted against the malignancy continuum. Samples are colored based on if they are from different disease stage.
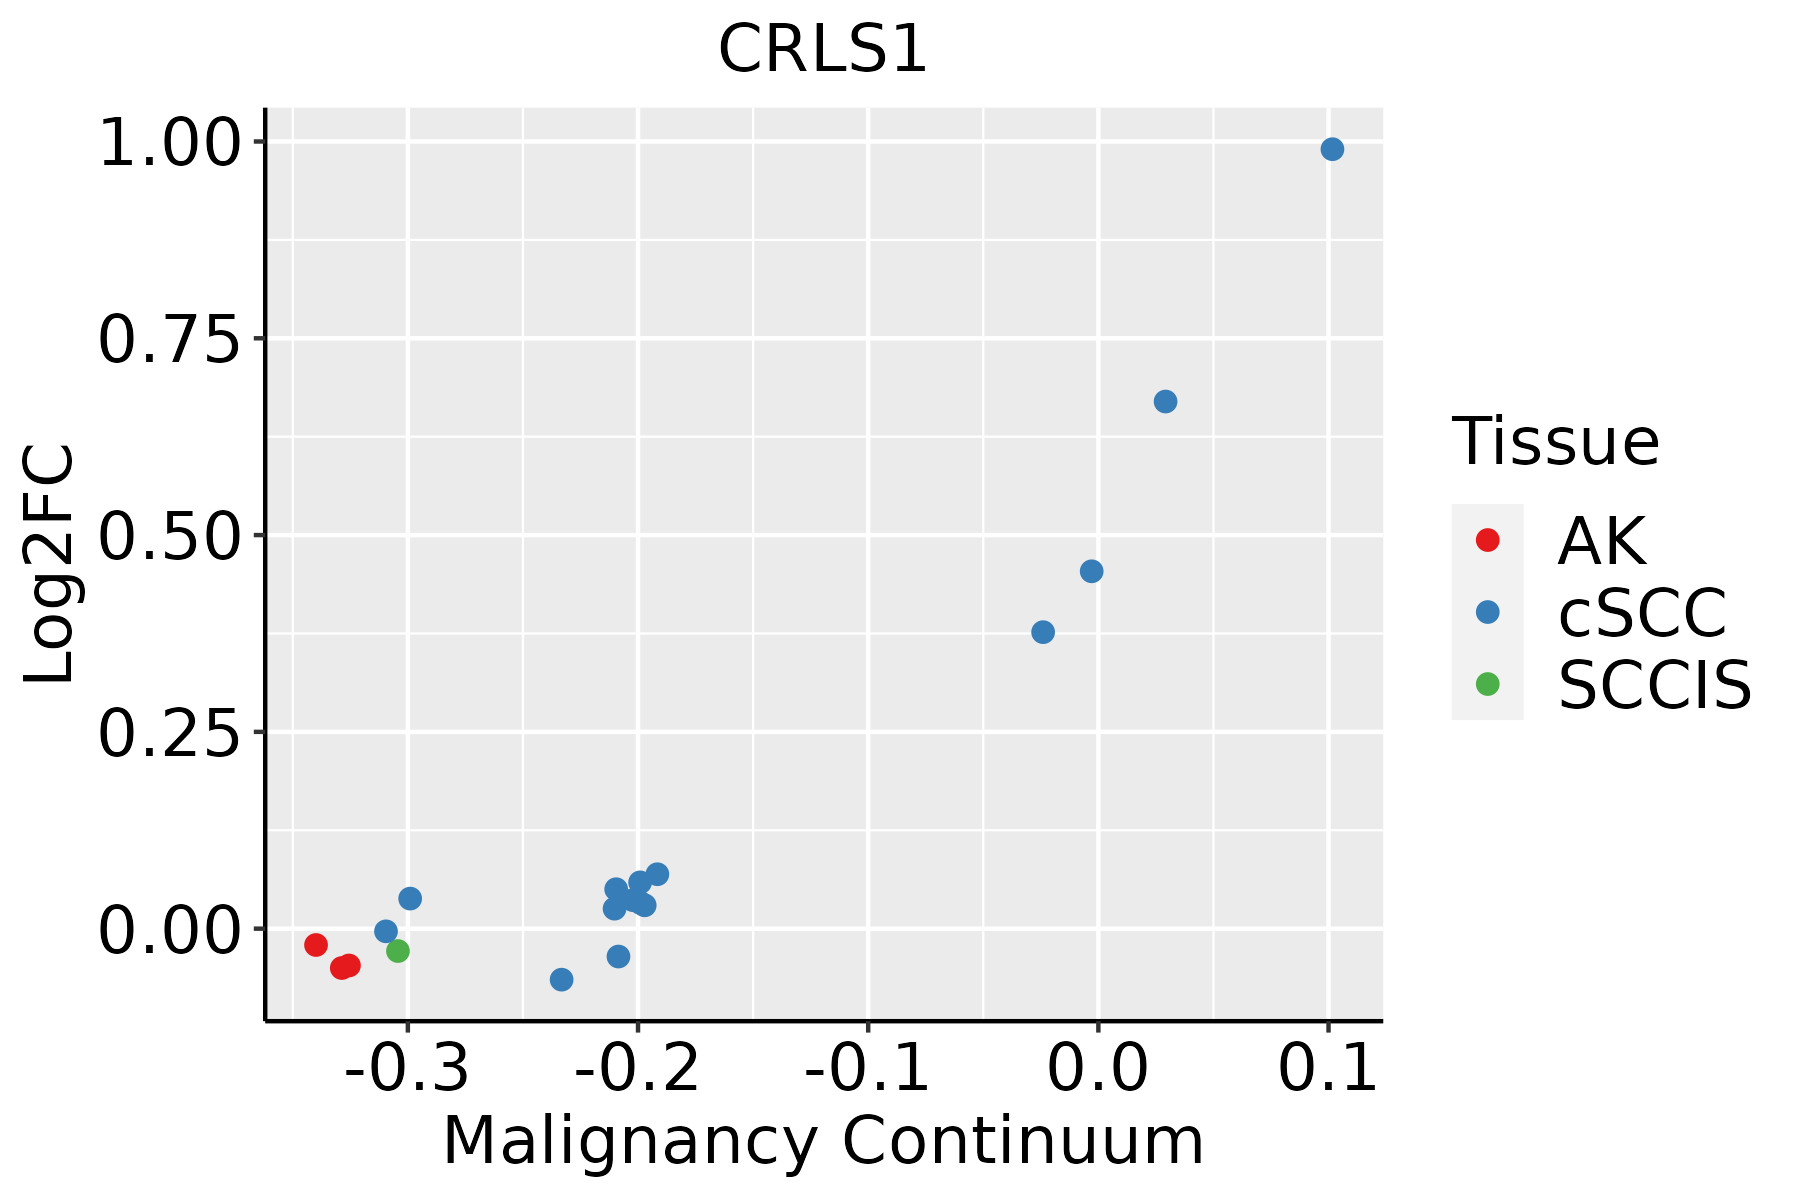
AK: Actinic keratosis
cSCC: Cutaneous squamous cell carcinoma
SCCIS:squamous cell carcinoma in situ
ThyroidThe image shows the transcriptomic changes along malignancy continuum.log2FC in expression of this searched gene in stem-like cells from each diseased tissue sample relative to stem-like cells in normal samples in each tissue plotted against the malignancy continuum. Samples are colored based on if they are from different disease stage.ATC: Anaplastic thyroid cancer
HT: Hashimoto's thyroiditis
PTC: Papillary thyroid cancer
∗log2FC in expression of this searched gene in stem-like cells from each diseased tissue sample relative to stem-like cells in normal samples in each tissue plotted against the malignancy continuum. Samples are colored based on if they are from different disease stage.

Top

Malignant transformation related pathway analysis

check buttonFind out the enriched GO biological processes and KEGG pathways involved in transition from healthy to precancer to cancer
check button Figure of enriched GO biological processes.
TissueDisease StageEnriched GO biological Processes
ColorectumADGO analysis - Figure of enriched GO biological processes: Top 15 enriched GO BP terms are showed in the bar plot of each disease state in each tissue. Each row represents a significant GO biological process which is colored according to the -log10(p.adjust).
ColorectumSERGO analysis - Figure of enriched GO biological processes: Top 15 enriched GO BP terms are showed in the bar plot of each disease state in each tissue. Each row represents a significant GO biological process which is colored according to the -log10(p.adjust).
ColorectumMSSGO analysis - Figure of enriched GO biological processes: Top 15 enriched GO BP terms are showed in the bar plot of each disease state in each tissue. Each row represents a significant GO biological process which is colored according to the -log10(p.adjust).
ColorectumMSI-HGO analysis - Figure of enriched GO biological processes: Top 15 enriched GO BP terms are showed in the bar plot of each disease state in each tissue. Each row represents a significant GO biological process which is colored according to the -log10(p.adjust).
ColorectumFAPGO analysis - Figure of enriched GO biological processes: Top 15 enriched GO BP terms are showed in the bar plot of each disease state in each tissue. Each row represents a significant GO biological process which is colored according to the -log10(p.adjust).
∗Top 15 enriched GO BP terms are showed in the bar plot of each disease state in each tissue. Each row represents a significant GO biological process which is colored according to the -log10(p.adjust).
Page: 1 2 3 4 5 6 7 8 9 

check button Enriched GO biological processes.
GO IDTissueDisease StageDescriptionGene RatioBg Ratiopvaluep.adjustCount
GO:00086544EsophagusESCCphospholipid biosynthetic process162/8552253/187232.59e-095.73e-08162
GO:00464744EsophagusESCCglycerophospholipid biosynthetic process135/8552211/187235.75e-081.02e-06135
GO:00450175EsophagusESCCglycerolipid biosynthetic process154/8552252/187235.20e-076.96e-06154
GO:00066446EsophagusESCCphospholipid metabolic process218/8552383/187235.37e-065.59e-05218
GO:00066505EsophagusESCCglycerophospholipid metabolic process174/8552306/187234.92e-053.85e-04174
GO:00432007EsophagusESCCresponse to amino acid74/8552116/187236.23e-054.76e-0474
GO:000110110EsophagusESCCresponse to acid chemical84/8552135/187237.70e-055.74e-0484
GO:00464864EsophagusESCCglycerolipid metabolic process211/8552392/187236.51e-043.46e-03211
GO:00464863LiverNAFLDglycerolipid metabolic process66/1882392/187231.94e-055.52e-0466
GO:00466837LiverNAFLDresponse to organophosphorus28/1882131/187239.05e-051.82e-0328
GO:00450174LiverNAFLDglycerolipid biosynthetic process43/1882252/187233.83e-045.73e-0343
GO:00464742LiverNAFLDglycerophospholipid biosynthetic process33/1882211/187236.93e-034.88e-0233
GO:00011013LiverCirrhoticresponse to acid chemical52/4634135/187232.65e-042.36e-0352
GO:0097066LiverCirrhoticresponse to thyroid hormone15/463426/187233.43e-042.93e-0315
GO:00432002LiverCirrhoticresponse to amino acid45/4634116/187235.54e-044.36e-0345
GO:004668311LiverCirrhoticresponse to organophosphorus45/4634131/187238.57e-033.97e-0245
GO:00086542LiverHCCphospholipid biosynthetic process150/7958253/187234.77e-081.03e-06150
GO:00066444LiverHCCphospholipid metabolic process214/7958383/187237.25e-081.48e-06214
GO:004648611LiverHCCglycerolipid metabolic process215/7958392/187234.54e-077.49e-06215
GO:004501711LiverHCCglycerolipid biosynthetic process143/7958252/187233.27e-064.31e-05143
Page: 1 2 3 

check button Enriched KEGG pathways.
Pathway IDTissueDisease StageDescriptionGene RatioBg Ratiopvaluep.adjustqvalueCount
Page: 1 

Top

Cell-cell communication analysis

check buttonIdentification of potential cell-cell interactions between two cell types and their ligand-receptor pairs for different disease states
LigandReceptorLRpairPathwayTissueDisease Stage
Page: 1 

Top

Single-cell gene regulatory network inference analysis

check buttonFind out the significant the regulons (TFs) and the target genes of each regulon across cell types for different disease states
TFCell TypeTissueDisease StageTarget GeneRSSRegulon Activity
∗The dot plots of a searched regulon are shown for all cell subpopulations in each disease state of each tissue based on the regulon specific score inferred using pySCENIC and by calculating the average expression.
Page: 1 

Top

Somatic mutation of malignant transformation related genes

check buttonAnnotation of somatic variants for genes involved in malignant transformation
Hugo SymbolVariant ClassVariant ClassificationdbSNP RSHGVScHGVSpHGVSp ShortSWISSPROTBIOTYPESIFTPolyPhenTumor Sample BarcodeTissueHistologySexAgeStageTherapy TypesDrugsOutcome
CRLS1SNVMissense_Mutationc.509C>Ap.Pro170Glnp.P170QQ9UJA2protein_codingdeleterious(0)probably_damaging(0.972)TCGA-A8-A0A7-01Breastbreast invasive carcinomaFemale<65I/IIUnknownUnknownSD
CRLS1SNVMissense_Mutationrs749890487c.720N>Ap.Phe240Leup.F240LQ9UJA2protein_codingtolerated(0.45)benign(0.037)TCGA-D8-A1XK-01Breastbreast invasive carcinomaFemale<65I/IIChemotherapydoxorubicine+cyclophosphamideSD
CRLS1SNVMissense_Mutationnovelc.545N>Cp.Val182Alap.V182AQ9UJA2protein_codingdeleterious(0.03)benign(0.174)TCGA-LL-A5YN-01Breastbreast invasive carcinomaFemale<65I/IIChemotherapycarboplatinSD
CRLS1deletionIn_Frame_Delc.758_769delNNNNNNNNNNNNp.Ser256_Ala259delp.S256_A259delQ9UJA2protein_codingTCGA-AA-3660-01Colorectumcolon adenocarcinomaFemale<65I/IIUnknownUnknownSD
CRLS1SNVMissense_Mutationnovelc.338N>Cp.Leu113Serp.L113SQ9UJA2protein_codingdeleterious(0)probably_damaging(0.998)TCGA-AJ-A3EK-01Endometriumuterine corpus endometrioid carcinomaFemale<65I/IIChemotherapycarboplatinCR
CRLS1SNVMissense_Mutationnovelc.394G>Ap.Asp132Asnp.D132NQ9UJA2protein_codingtolerated(0.31)benign(0.058)TCGA-AP-A1DV-01Endometriumuterine corpus endometrioid carcinomaFemale<65I/IIUnknownUnknownSD
CRLS1SNVMissense_Mutationrs753805913c.877N>Tp.Arg293Trpp.R293WQ9UJA2protein_codingdeleterious(0)probably_damaging(0.928)TCGA-AX-A2HD-01Endometriumuterine corpus endometrioid carcinomaFemale>=65III/IVUnknownUnknownSD
CRLS1SNVMissense_Mutationnovelc.431G>Ap.Gly144Glup.G144EQ9UJA2protein_codingdeleterious(0)probably_damaging(0.996)TCGA-B5-A3FC-01Endometriumuterine corpus endometrioid carcinomaFemale<65I/IIUnknownUnknownSD
CRLS1SNVMissense_Mutationnovelc.340T>Cp.Ser114Prop.S114PQ9UJA2protein_codingtolerated(0.08)probably_damaging(0.959)TCGA-FI-A2D5-01Endometriumuterine corpus endometrioid carcinomaFemale<65III/IVChemotherapycarboplatinumPD
CRLS1deletionFrame_Shift_Delnovelc.626delNp.Tyr211MetfsTer26p.Y211Mfs*26Q9UJA2protein_codingTCGA-AP-A051-01Endometriumuterine corpus endometrioid carcinomaFemale>=65I/IIUnknownUnknownSD
Page: 1 2 

Top

Related drugs of malignant transformation related genes

check buttonIdentification of chemicals and drugs interact with genes involved in malignant transfromation
(DGIdb 4.0)
Entrez IDSymbolCategoryInteraction TypesDrug Claim NameDrug NamePMIDs
Page: 1