
|
|||||
|
 | |
| |
| |
| |
| |
| |
|
Gene: CRLF3 |
Gene summary for CRLF3 |
| Gene information | Species | Human | Gene symbol | CRLF3 | Gene ID | 51379 |
| Gene name | cytokine receptor like factor 3 | |
| Gene Alias | CREME-9 | |
| Cytomap | 17q11.2 | |
| Gene Type | protein-coding | GO ID | GO:0000082 | UniProtAcc | Q8IUI8 |
Top |
Malignant transformation analysis |
| Identification of the aberrant gene expression in precancerous and cancerous lesions by comparing the gene expression of stem-like cells in diseased tissues with normal stem cells |
| Entrez ID | Symbol | Replicates | Species | Organ | Tissue | Adj P-value | Log2FC | Malignancy |
| 51379 | CRLF3 | LZE4T | Human | Esophagus | ESCC | 7.67e-09 | 1.94e-01 | 0.0811 |
| 51379 | CRLF3 | LZE7T | Human | Esophagus | ESCC | 3.71e-04 | 3.03e-01 | 0.0667 |
| 51379 | CRLF3 | LZE24T | Human | Esophagus | ESCC | 4.88e-13 | 2.82e-01 | 0.0596 |
| 51379 | CRLF3 | LZE6T | Human | Esophagus | ESCC | 1.68e-05 | 3.07e-01 | 0.0845 |
| 51379 | CRLF3 | P1T-E | Human | Esophagus | ESCC | 9.78e-03 | 1.75e-01 | 0.0875 |
| 51379 | CRLF3 | P2T-E | Human | Esophagus | ESCC | 7.36e-19 | 2.26e-01 | 0.1177 |
| 51379 | CRLF3 | P4T-E | Human | Esophagus | ESCC | 2.90e-15 | 2.38e-01 | 0.1323 |
| 51379 | CRLF3 | P5T-E | Human | Esophagus | ESCC | 8.45e-13 | 2.02e-01 | 0.1327 |
| 51379 | CRLF3 | P8T-E | Human | Esophagus | ESCC | 3.73e-18 | 1.27e-01 | 0.0889 |
| 51379 | CRLF3 | P9T-E | Human | Esophagus | ESCC | 1.32e-11 | 1.67e-01 | 0.1131 |
| 51379 | CRLF3 | P10T-E | Human | Esophagus | ESCC | 4.94e-13 | 7.23e-02 | 0.116 |
| 51379 | CRLF3 | P11T-E | Human | Esophagus | ESCC | 4.38e-08 | 3.15e-01 | 0.1426 |
| 51379 | CRLF3 | P12T-E | Human | Esophagus | ESCC | 8.50e-17 | 2.41e-01 | 0.1122 |
| 51379 | CRLF3 | P15T-E | Human | Esophagus | ESCC | 3.10e-17 | 3.18e-01 | 0.1149 |
| 51379 | CRLF3 | P16T-E | Human | Esophagus | ESCC | 6.05e-09 | 1.94e-01 | 0.1153 |
| 51379 | CRLF3 | P17T-E | Human | Esophagus | ESCC | 2.38e-05 | 2.82e-01 | 0.1278 |
| 51379 | CRLF3 | P19T-E | Human | Esophagus | ESCC | 2.26e-02 | 2.97e-01 | 0.1662 |
| 51379 | CRLF3 | P20T-E | Human | Esophagus | ESCC | 1.26e-13 | 1.97e-01 | 0.1124 |
| 51379 | CRLF3 | P21T-E | Human | Esophagus | ESCC | 1.39e-16 | 3.59e-01 | 0.1617 |
| 51379 | CRLF3 | P22T-E | Human | Esophagus | ESCC | 2.73e-12 | 2.25e-01 | 0.1236 |
| Page: 1 2 3 |
| Tissue | Expression Dynamics | Abbreviation |
| Endometrium | 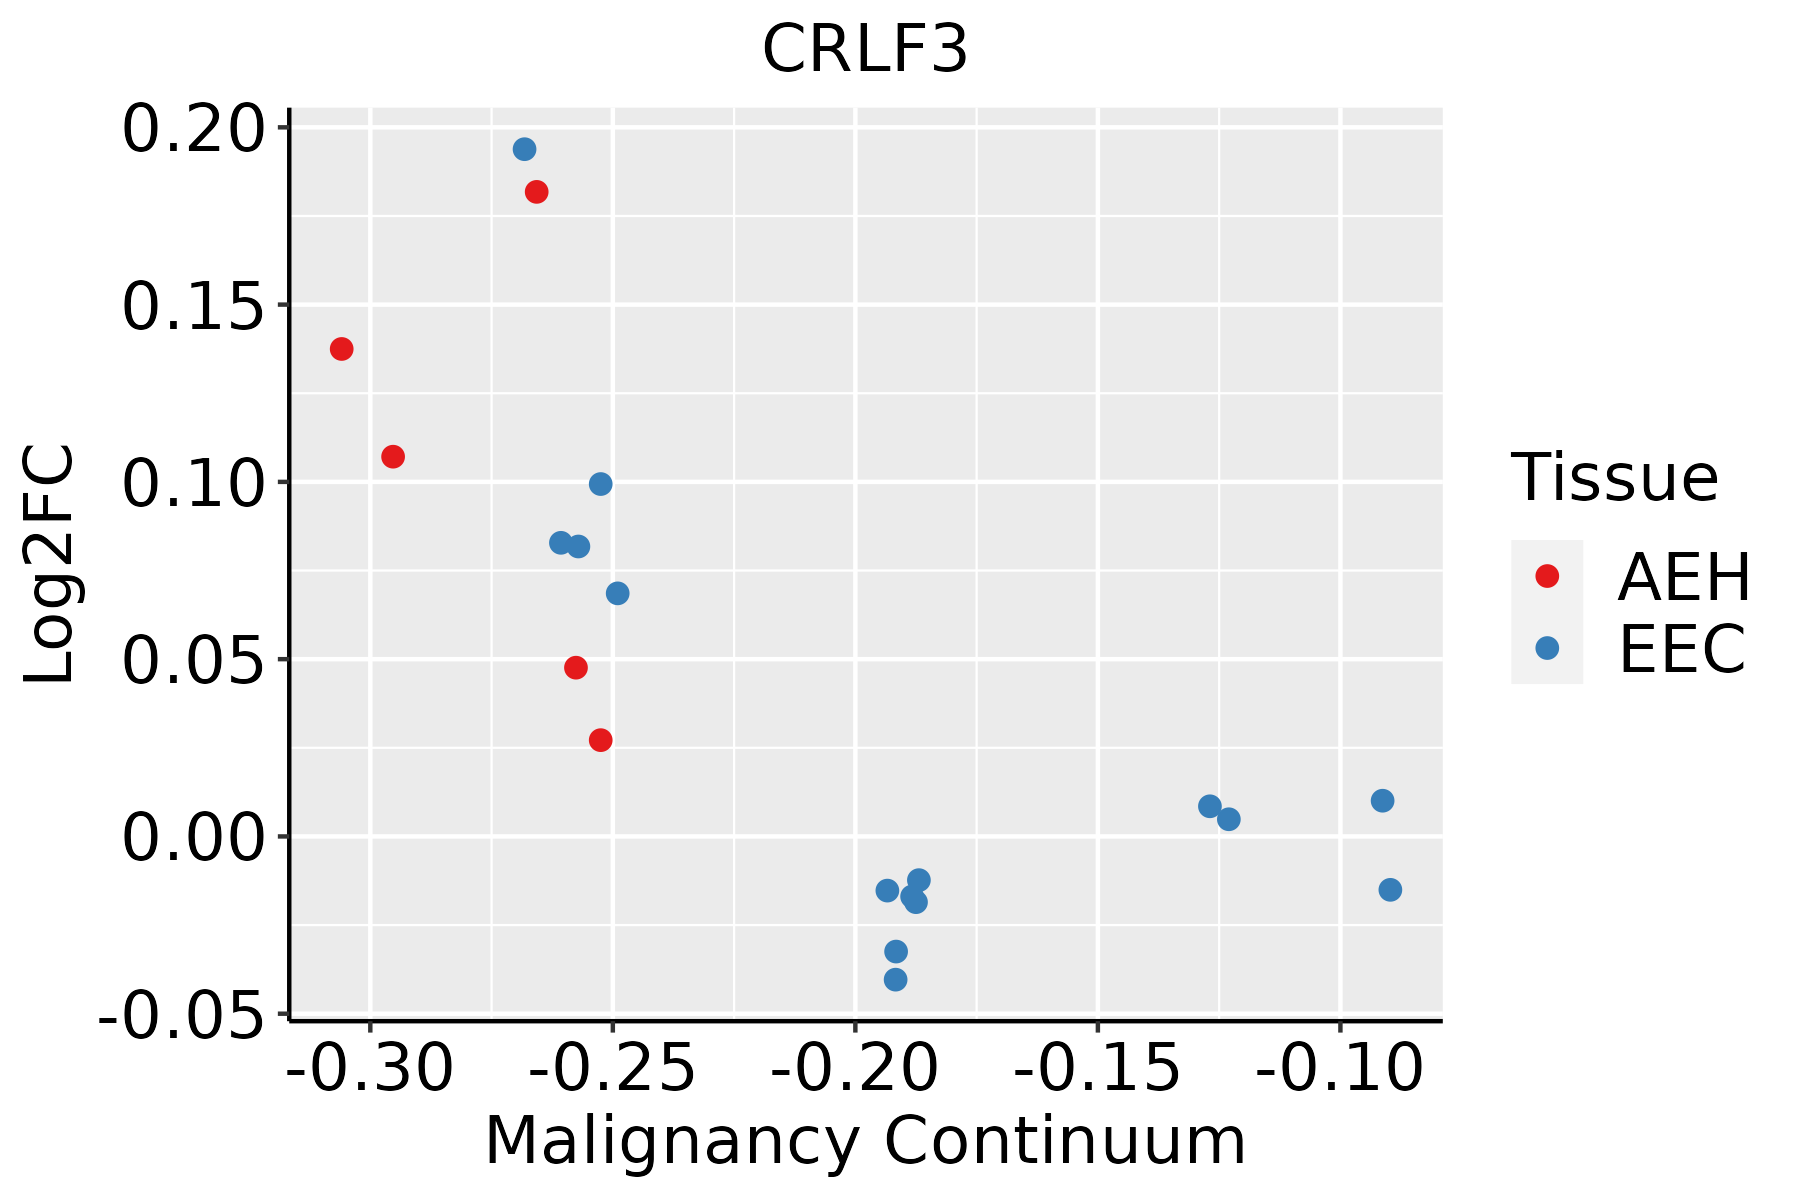 | AEH: Atypical endometrial hyperplasia |
| EEC: Endometrioid Cancer | ||
| Esophagus | 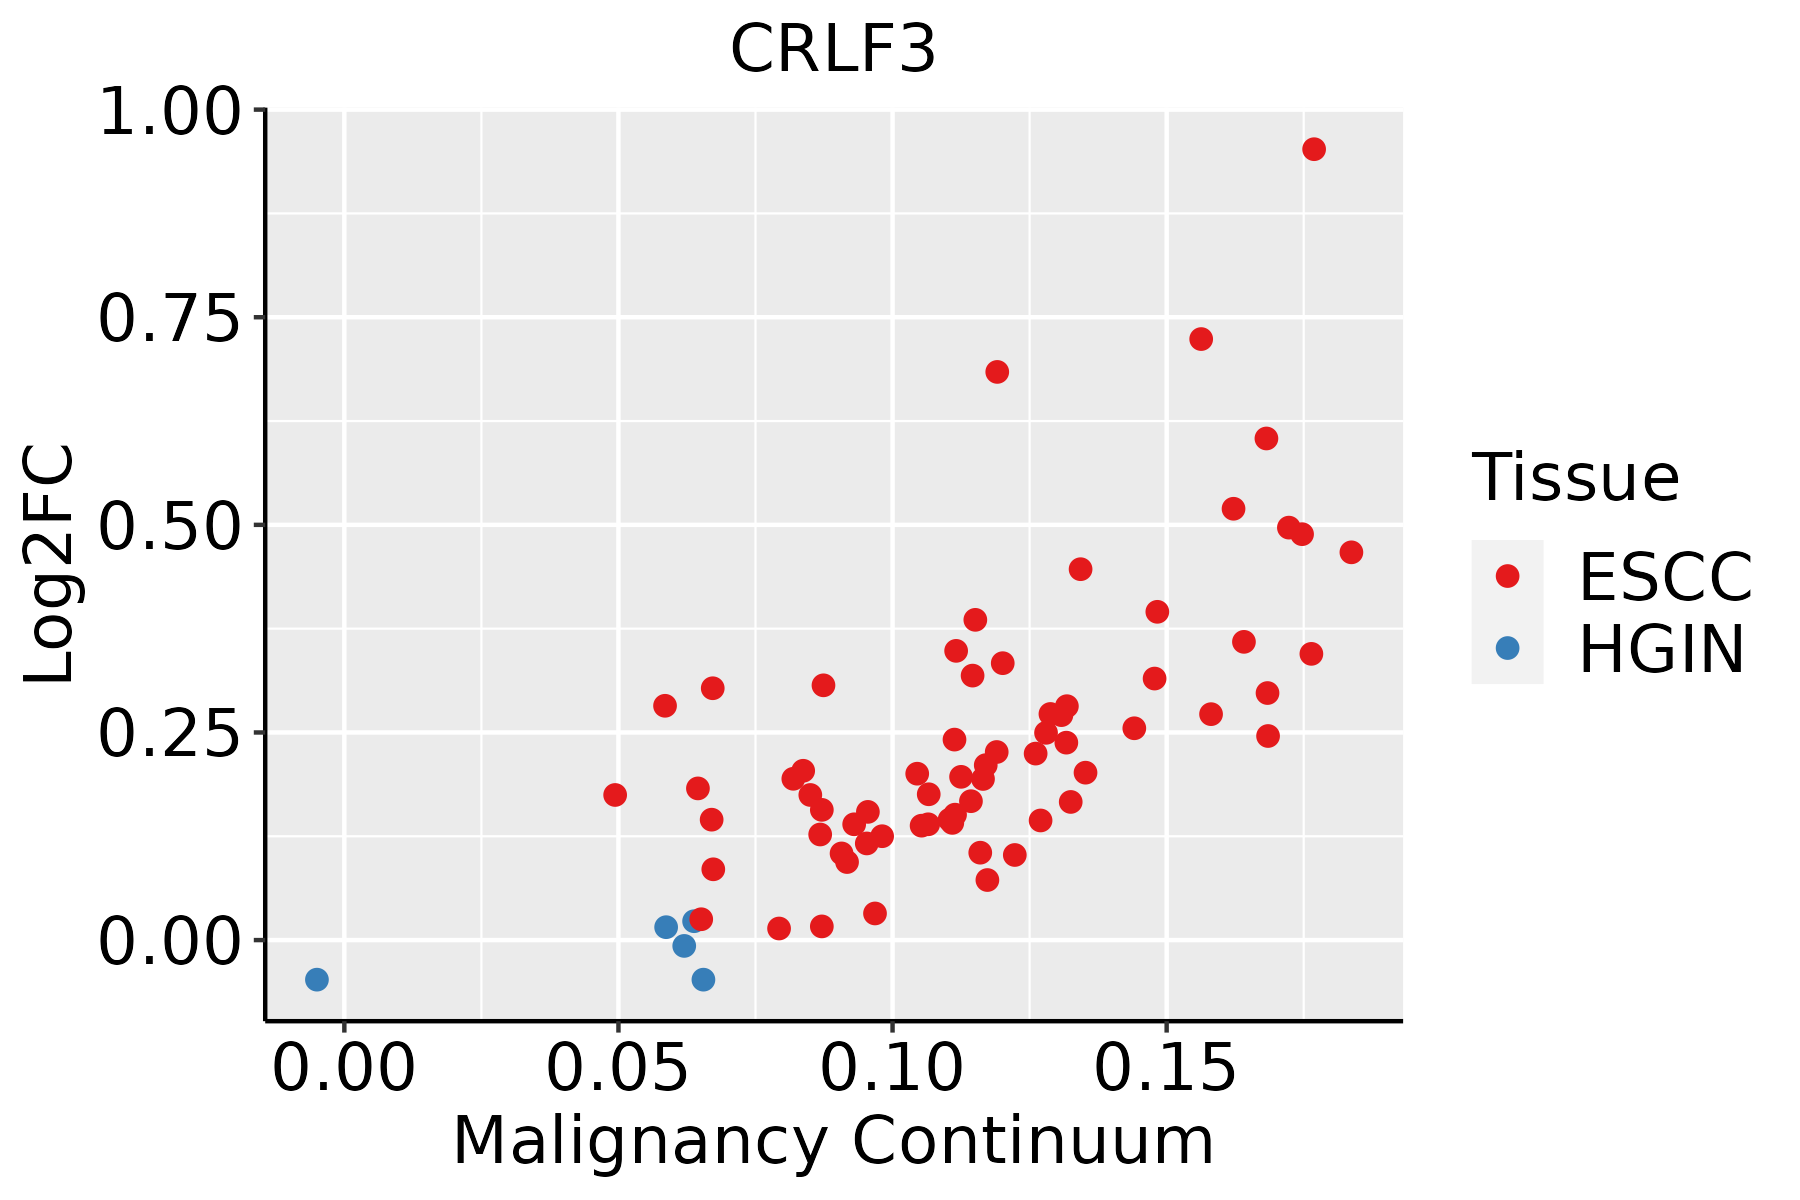 | ESCC: Esophageal squamous cell carcinoma |
| HGIN: High-grade intraepithelial neoplasias | ||
| LGIN: Low-grade intraepithelial neoplasias |
| ∗log2FC in expression of this searched gene in stem-like cells from each diseased tissue sample relative to stem-like cells in normal samples in each tissue plotted against the malignancy continuum. Samples are colored based on if they are from different disease stage. |
Top |
Malignant transformation related pathway analysis |
| Find out the enriched GO biological processes and KEGG pathways involved in transition from healthy to precancer to cancer |
| Tissue | Disease Stage | Enriched GO biological Processes |
| Colorectum | AD |  |
| Colorectum | SER |  |
| Colorectum | MSS |  |
| Colorectum | MSI-H |  |
| Colorectum | FAP |  |
| ∗Top 15 enriched GO BP terms are showed in the bar plot of each disease state in each tissue. Each row represents a significant GO biological process which is colored according to the -log10(p.adjust). |
| Page: 1 2 3 4 5 6 7 8 9 |
| GO ID | Tissue | Disease Stage | Description | Gene Ratio | Bg Ratio | pvalue | p.adjust | Count |
| GO:004477216 | Esophagus | ESCC | mitotic cell cycle phase transition | 281/8552 | 424/18723 | 4.63e-18 | 4.45e-16 | 281 |
| GO:0016049110 | Esophagus | ESCC | cell growth | 289/8552 | 482/18723 | 1.29e-10 | 3.77e-09 | 289 |
| GO:000155819 | Esophagus | ESCC | regulation of cell growth | 248/8552 | 414/18723 | 2.97e-09 | 6.45e-08 | 248 |
| GO:000008214 | Esophagus | ESCC | G1/S transition of mitotic cell cycle | 134/8552 | 214/18723 | 4.04e-07 | 5.55e-06 | 134 |
| GO:004484314 | Esophagus | ESCC | cell cycle G1/S phase transition | 148/8552 | 241/18723 | 5.68e-07 | 7.48e-06 | 148 |
| GO:00459267 | Esophagus | ESCC | negative regulation of growth | 148/8552 | 249/18723 | 7.88e-06 | 7.73e-05 | 148 |
| GO:00303085 | Esophagus | ESCC | negative regulation of cell growth | 108/8552 | 188/18723 | 7.46e-04 | 3.87e-03 | 108 |
| Page: 1 |
| Pathway ID | Tissue | Disease Stage | Description | Gene Ratio | Bg Ratio | pvalue | p.adjust | qvalue | Count |
| Page: 1 |
Top |
Cell-cell communication analysis |
| Identification of potential cell-cell interactions between two cell types and their ligand-receptor pairs for different disease states |
| Ligand | Receptor | LRpair | Pathway | Tissue | Disease Stage |
| Page: 1 |
Top |
Single-cell gene regulatory network inference analysis |
| Find out the significant the regulons (TFs) and the target genes of each regulon across cell types for different disease states |
| TF | Cell Type | Tissue | Disease Stage | Target Gene | RSS | Regulon Activity |
| ∗The dot plots of a searched regulon are shown for all cell subpopulations in each disease state of each tissue based on the regulon specific score inferred using pySCENIC and by calculating the average expression. |
| Page: 1 |
Top |
Somatic mutation of malignant transformation related genes |
| Annotation of somatic variants for genes involved in malignant transformation |
| Hugo Symbol | Variant Class | Variant Classification | dbSNP RS | HGVSc | HGVSp | HGVSp Short | SWISSPROT | BIOTYPE | SIFT | PolyPhen | Tumor Sample Barcode | Tissue | Histology | Sex | Age | Stage | Therapy Types | Drugs | Outcome |
| CRLF3 | SNV | Missense_Mutation | novel | c.1186N>A | p.Glu396Lys | p.E396K | Q8IUI8 | protein_coding | deleterious_low_confidence(0.04) | benign(0.082) | TCGA-BH-A18K-01 | Breast | breast invasive carcinoma | Female | <65 | I/II | Unknown | Unknown | PD |
| CRLF3 | SNV | Missense_Mutation | novel | c.1036N>G | p.Leu346Val | p.L346V | Q8IUI8 | protein_coding | deleterious(0.01) | possibly_damaging(0.853) | TCGA-BH-A2L8-01 | Breast | breast invasive carcinoma | Female | <65 | I/II | Chemotherapy | cytoxan | CR |
| CRLF3 | SNV | Missense_Mutation | c.590T>C | p.Val197Ala | p.V197A | Q8IUI8 | protein_coding | tolerated(0.1) | benign(0.187) | TCGA-D8-A1XK-01 | Breast | breast invasive carcinoma | Female | <65 | I/II | Chemotherapy | doxorubicine+cyclophosphamide | SD | |
| CRLF3 | insertion | Nonsense_Mutation | novel | c.1190_1191insACTTTAATATGTAAAAATAATTGTCTTCTATGCCACCCTACAGATTCT | p.Gly397_Gly398insLeuTerTyrValLysIleIleValPheTyrAlaThrLeuGlnIleLeu | p.G397_G398insL*YVKIIVFYATLQIL | Q8IUI8 | protein_coding | TCGA-A8-A07J-01 | Breast | breast invasive carcinoma | Female | <65 | I/II | Chemotherapy | 5-fluorouracil | CR | ||
| CRLF3 | insertion | In_Frame_Ins | novel | c.438_439insGGCTGGAGTGCAGCGATGCAACCTCCGACCTCAGGTGATCTGCCC | p.Val146_Pro147insGlyTrpSerAlaAlaMetGlnProProThrSerGlyAspLeuPro | p.V146_P147insGWSAAMQPPTSGDLP | Q8IUI8 | protein_coding | TCGA-A8-A07P-01 | Breast | breast invasive carcinoma | Female | >=65 | I/II | Chemotherapy | 5-fluorouracil | SD | ||
| CRLF3 | SNV | Missense_Mutation | c.1299C>G | p.Phe433Leu | p.F433L | Q8IUI8 | protein_coding | tolerated(0.21) | benign(0.015) | TCGA-C5-A1MH-01 | Cervix | cervical & endocervical cancer | Female | >=65 | III/IV | Chemotherapy | cisplatin | PD | |
| CRLF3 | SNV | Missense_Mutation | c.1234N>A | p.Glu412Lys | p.E412K | Q8IUI8 | protein_coding | deleterious(0.04) | possibly_damaging(0.523) | TCGA-AA-3510-01 | Colorectum | colon adenocarcinoma | Male | >=65 | I/II | Unknown | Unknown | SD | |
| CRLF3 | SNV | Missense_Mutation | c.343N>G | p.Ile115Val | p.I115V | Q8IUI8 | protein_coding | tolerated(0.38) | benign(0) | TCGA-AA-3815-01 | Colorectum | colon adenocarcinoma | Female | >=65 | I/II | Unknown | Unknown | SD | |
| CRLF3 | SNV | Missense_Mutation | c.628N>T | p.Asp210Tyr | p.D210Y | Q8IUI8 | protein_coding | deleterious(0) | possibly_damaging(0.605) | TCGA-AZ-4315-01 | Colorectum | colon adenocarcinoma | Male | <65 | I/II | Unknown | Unknown | SD | |
| CRLF3 | SNV | Missense_Mutation | c.628N>T | p.Asp210Tyr | p.D210Y | Q8IUI8 | protein_coding | deleterious(0) | possibly_damaging(0.605) | TCGA-AG-A002-01 | Colorectum | rectum adenocarcinoma | Male | <65 | I/II | Unknown | Unknown | SD |
| Page: 1 2 3 4 5 |
Top |
Related drugs of malignant transformation related genes |
| Identification of chemicals and drugs interact with genes involved in malignant transfromation |
| (DGIdb 4.0) |
| Entrez ID | Symbol | Category | Interaction Types | Drug Claim Name | Drug Name | PMIDs |
| Page: 1 |

Copyright 2023-Present -The University of Texas Health Science Center at Houston |