
|
|||||
|
 | |
| |
| |
| |
| |
| |
|
Gene: CRLF1 |
Gene summary for CRLF1 |
| Gene information | Species | Human | Gene symbol | CRLF1 | Gene ID | 9244 |
| Gene name | cytokine receptor like factor 1 | |
| Gene Alias | CISS | |
| Cytomap | 19p13.11 | |
| Gene Type | protein-coding | GO ID | GO:0001655 | UniProtAcc | O75462 |
Top |
Malignant transformation analysis |
| Identification of the aberrant gene expression in precancerous and cancerous lesions by comparing the gene expression of stem-like cells in diseased tissues with normal stem cells |
| Entrez ID | Symbol | Replicates | Species | Organ | Tissue | Adj P-value | Log2FC | Malignancy |
| 9244 | CRLF1 | RNA-P6T1-P6T1-4 | Human | Lung | MIAC | 4.48e-04 | 7.56e-01 | -0.0263 |
| 9244 | CRLF1 | RNA-P7T1-P7T1-1 | Human | Lung | AIS | 2.97e-04 | 7.23e-01 | -0.0961 |
| 9244 | CRLF1 | RNA-P7T1-P7T1-2 | Human | Lung | AIS | 1.41e-02 | 5.34e-01 | -0.0876 |
| 9244 | CRLF1 | RNA-P7T1-P7T1-4 | Human | Lung | AIS | 1.45e-05 | 6.56e-01 | -0.0809 |
| 9244 | CRLF1 | male-WTA | Human | Thyroid | PTC | 1.12e-33 | 6.25e-01 | 0.1037 |
| 9244 | CRLF1 | PTC01 | Human | Thyroid | PTC | 4.82e-02 | 1.84e-01 | 0.1899 |
| 9244 | CRLF1 | PTC04 | Human | Thyroid | PTC | 9.23e-23 | 1.36e+00 | 0.1927 |
| 9244 | CRLF1 | PTC05 | Human | Thyroid | PTC | 1.91e-04 | 5.63e-01 | 0.2065 |
| 9244 | CRLF1 | PTC06 | Human | Thyroid | PTC | 1.51e-24 | 1.48e+00 | 0.2057 |
| 9244 | CRLF1 | PTC07 | Human | Thyroid | PTC | 1.12e-33 | 1.77e+00 | 0.2044 |
| Page: 1 |
| Tissue | Expression Dynamics | Abbreviation |
| Lung | 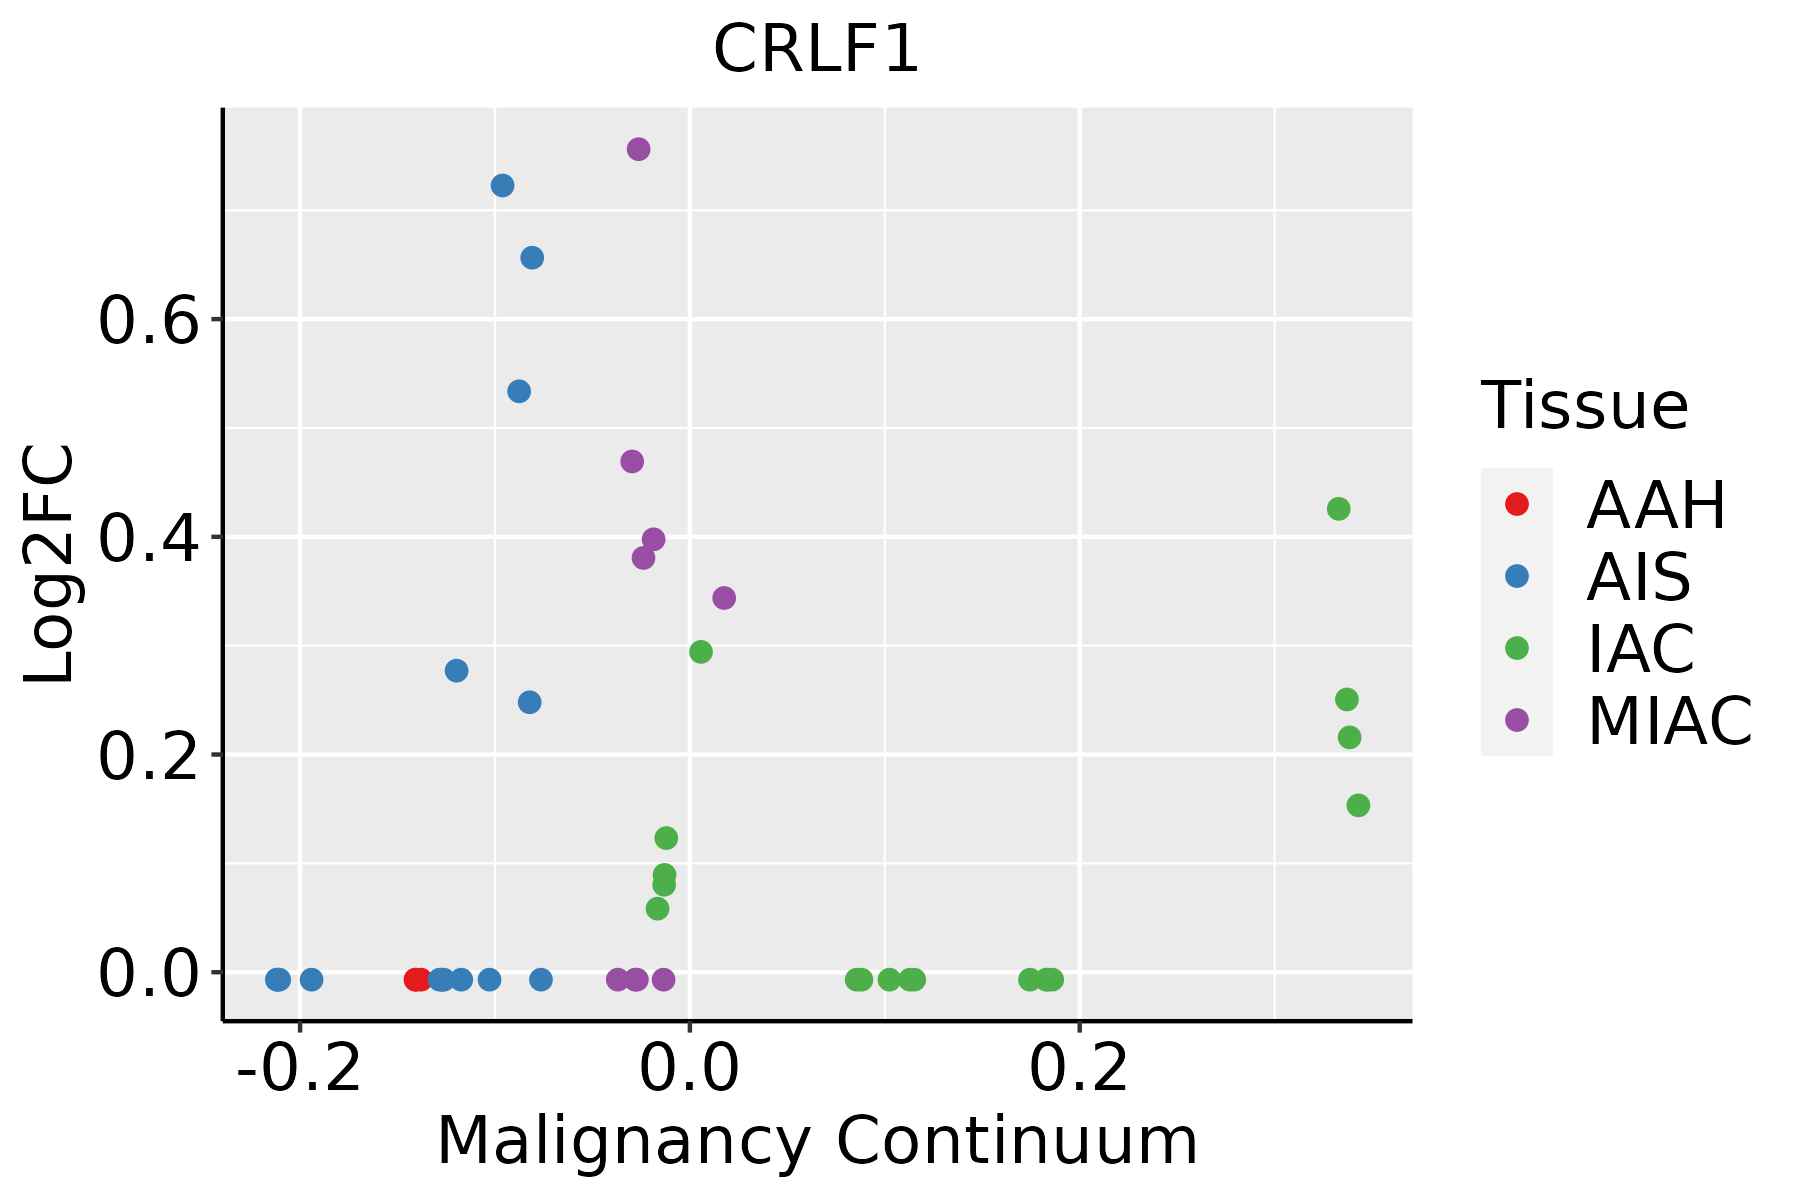 | AAH: Atypical adenomatous hyperplasia |
| AIS: Adenocarcinoma in situ | ||
| IAC: Invasive lung adenocarcinoma | ||
| MIA: Minimally invasive adenocarcinoma | ||
| Thyroid | 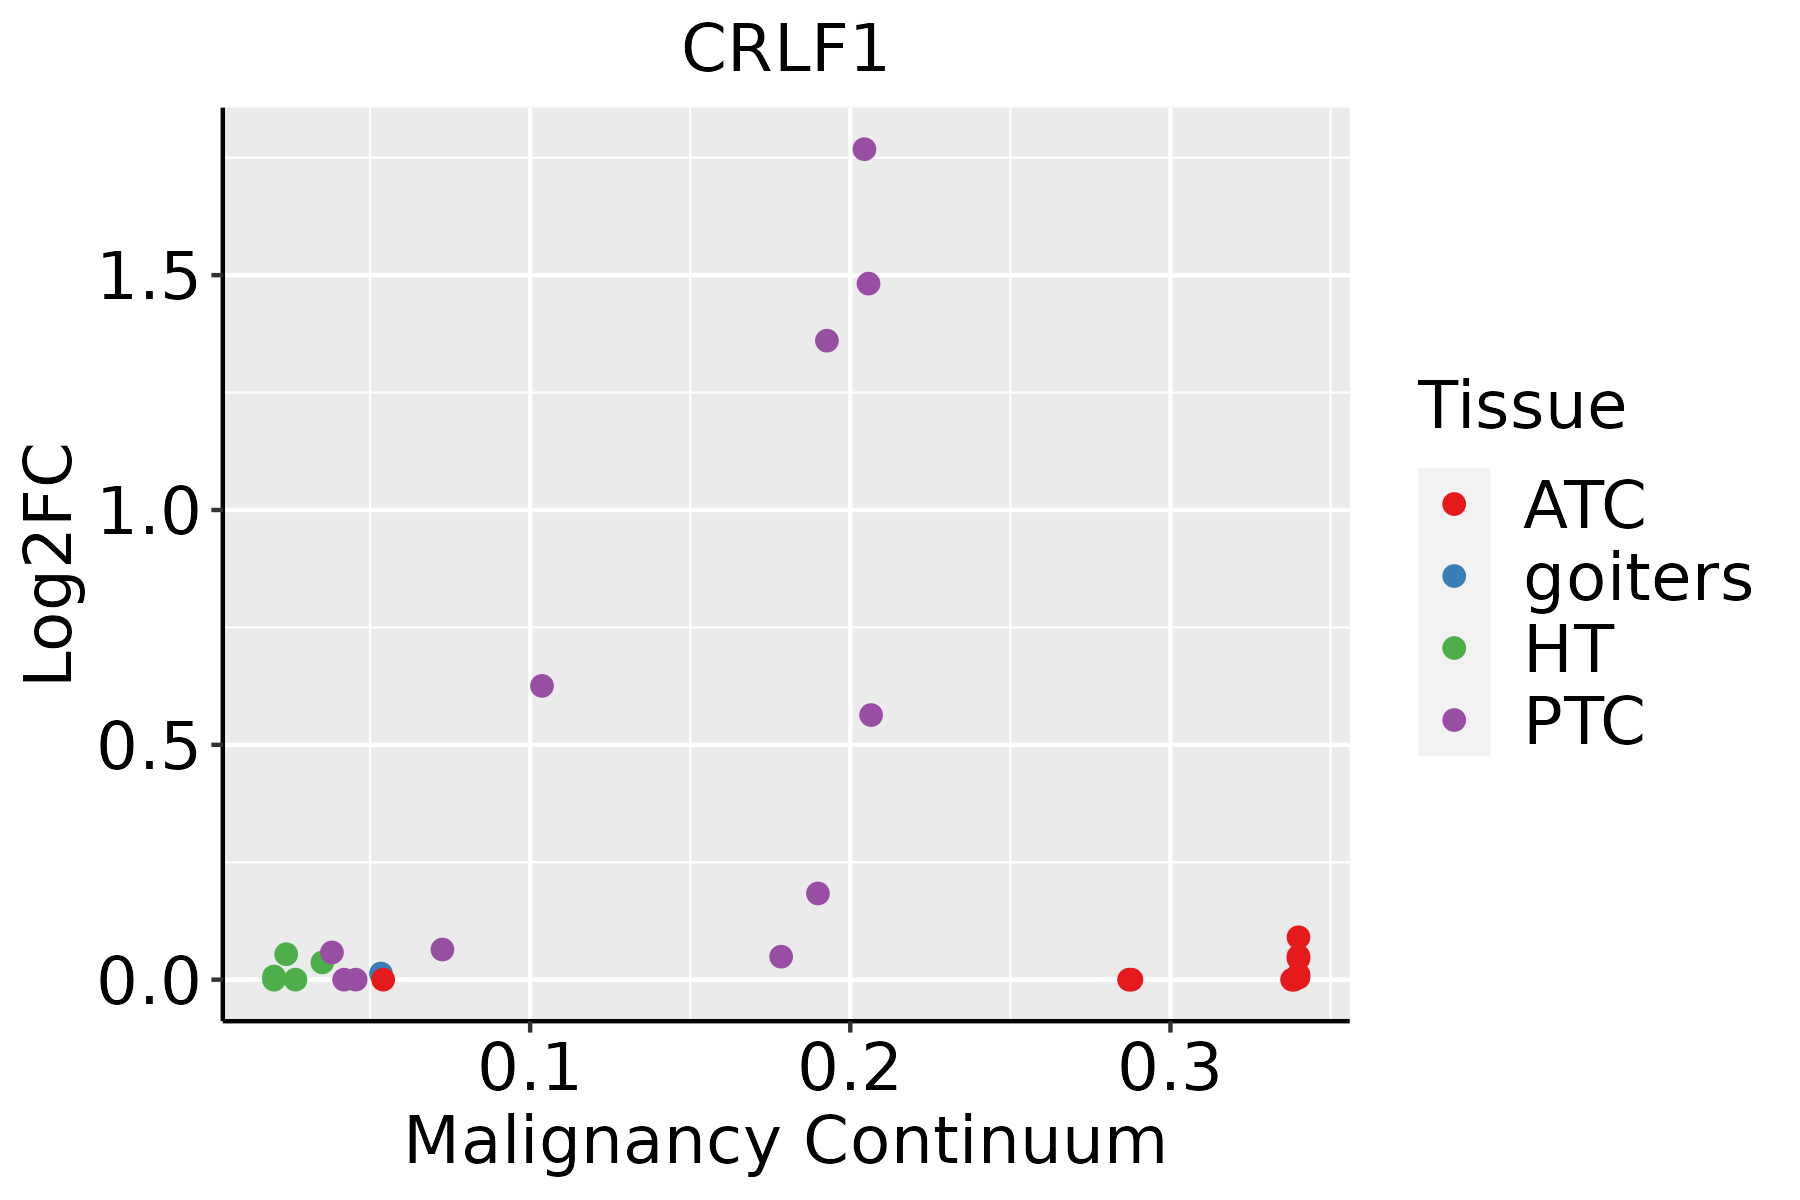 | ATC: Anaplastic thyroid cancer |
| HT: Hashimoto's thyroiditis | ||
| PTC: Papillary thyroid cancer |
| ∗log2FC in expression of this searched gene in stem-like cells from each diseased tissue sample relative to stem-like cells in normal samples in each tissue plotted against the malignancy continuum. Samples are colored based on if they are from different disease stage. |
Top |
Malignant transformation related pathway analysis |
| Find out the enriched GO biological processes and KEGG pathways involved in transition from healthy to precancer to cancer |
| Tissue | Disease Stage | Enriched GO biological Processes |
| Colorectum | AD |  |
| Colorectum | SER |  |
| Colorectum | MSS |  |
| Colorectum | MSI-H |  |
| Colorectum | FAP |  |
| ∗Top 15 enriched GO BP terms are showed in the bar plot of each disease state in each tissue. Each row represents a significant GO biological process which is colored according to the -log10(p.adjust). |
| Page: 1 2 3 4 5 6 7 8 9 |
| GO ID | Tissue | Disease Stage | Description | Gene Ratio | Bg Ratio | pvalue | p.adjust | Count |
| GO:000165511 | Lung | AIS | urogenital system development | 63/1849 | 338/18723 | 5.46e-07 | 4.08e-05 | 63 |
| GO:000182211 | Lung | AIS | kidney development | 53/1849 | 293/18723 | 1.04e-05 | 4.25e-04 | 53 |
| GO:007200111 | Lung | AIS | renal system development | 54/1849 | 302/18723 | 1.21e-05 | 4.71e-04 | 54 |
| GO:007099713 | Lung | AIS | neuron death | 58/1849 | 361/18723 | 1.39e-04 | 3.05e-03 | 58 |
| GO:007207311 | Lung | AIS | kidney epithelium development | 27/1849 | 136/18723 | 3.21e-04 | 5.83e-03 | 27 |
| GO:190121413 | Lung | AIS | regulation of neuron death | 50/1849 | 319/18723 | 6.90e-04 | 1.02e-02 | 50 |
| GO:0018212 | Lung | AIS | peptidyl-tyrosine modification | 56/1849 | 378/18723 | 1.35e-03 | 1.68e-02 | 56 |
| GO:0018108 | Lung | AIS | peptidyl-tyrosine phosphorylation | 55/1849 | 375/18723 | 1.87e-03 | 2.08e-02 | 55 |
| GO:00720013 | Lung | MIAC | renal system development | 32/967 | 302/18723 | 9.64e-05 | 4.19e-03 | 32 |
| GO:000182221 | Lung | MIAC | kidney development | 31/967 | 293/18723 | 1.27e-04 | 5.13e-03 | 31 |
| GO:000165521 | Lung | MIAC | urogenital system development | 34/967 | 338/18723 | 1.63e-04 | 6.25e-03 | 34 |
| GO:007207321 | Lung | MIAC | kidney epithelium development | 17/967 | 136/18723 | 6.48e-04 | 1.56e-02 | 17 |
| GO:007099723 | Lung | MIAC | neuron death | 31/967 | 361/18723 | 3.97e-03 | 4.79e-02 | 31 |
| GO:0070997113 | Thyroid | PTC | neuron death | 171/5968 | 361/18723 | 4.32e-10 | 1.38e-08 | 171 |
| GO:1901214113 | Thyroid | PTC | regulation of neuron death | 151/5968 | 319/18723 | 4.74e-09 | 1.24e-07 | 151 |
| GO:0051402112 | Thyroid | PTC | neuron apoptotic process | 118/5968 | 246/18723 | 8.99e-08 | 1.81e-06 | 118 |
| GO:0043523110 | Thyroid | PTC | regulation of neuron apoptotic process | 102/5968 | 212/18723 | 5.45e-07 | 8.76e-06 | 102 |
| GO:000182215 | Thyroid | PTC | kidney development | 133/5968 | 293/18723 | 7.57e-07 | 1.18e-05 | 133 |
| GO:000165517 | Thyroid | PTC | urogenital system development | 149/5968 | 338/18723 | 1.41e-06 | 2.01e-05 | 149 |
| GO:007200114 | Thyroid | PTC | renal system development | 135/5968 | 302/18723 | 1.76e-06 | 2.43e-05 | 135 |
| Page: 1 2 |
| Pathway ID | Tissue | Disease Stage | Description | Gene Ratio | Bg Ratio | pvalue | p.adjust | qvalue | Count |
| Page: 1 |
Top |
Cell-cell communication analysis |
| Identification of potential cell-cell interactions between two cell types and their ligand-receptor pairs for different disease states |
| Ligand | Receptor | LRpair | Pathway | Tissue | Disease Stage |
| Page: 1 |
Top |
Single-cell gene regulatory network inference analysis |
| Find out the significant the regulons (TFs) and the target genes of each regulon across cell types for different disease states |
| TF | Cell Type | Tissue | Disease Stage | Target Gene | RSS | Regulon Activity |
| ∗The dot plots of a searched regulon are shown for all cell subpopulations in each disease state of each tissue based on the regulon specific score inferred using pySCENIC and by calculating the average expression. |
| Page: 1 |
Top |
Somatic mutation of malignant transformation related genes |
| Annotation of somatic variants for genes involved in malignant transformation |
| Hugo Symbol | Variant Class | Variant Classification | dbSNP RS | HGVSc | HGVSp | HGVSp Short | SWISSPROT | BIOTYPE | SIFT | PolyPhen | Tumor Sample Barcode | Tissue | Histology | Sex | Age | Stage | Therapy Types | Drugs | Outcome |
| CRLF1 | SNV | Missense_Mutation | novel | c.995A>C | p.His332Pro | p.H332P | O75462 | protein_coding | deleterious(0.01) | possibly_damaging(0.543) | TCGA-AR-A1AY-01 | Breast | breast invasive carcinoma | Female | >=65 | I/II | Unspecific | Doxorubicin | SD |
| CRLF1 | SNV | Missense_Mutation | c.1121N>A | p.Leu374His | p.L374H | O75462 | protein_coding | deleterious_low_confidence(0) | possibly_damaging(0.533) | TCGA-GM-A2DN-01 | Breast | breast invasive carcinoma | Female | <65 | I/II | Chemotherapy | taxol | CR | |
| CRLF1 | SNV | Missense_Mutation | novel | c.805C>G | p.Gln269Glu | p.Q269E | O75462 | protein_coding | tolerated(0.14) | possibly_damaging(0.608) | TCGA-LL-A73Y-01 | Breast | breast invasive carcinoma | Female | >=65 | I/II | Chemotherapy | taxotere | SD |
| CRLF1 | deletion | Frame_Shift_Del | novel | c.420delN | p.Asn140LysfsTer9 | p.N140Kfs*9 | O75462 | protein_coding | TCGA-D8-A27V-01 | Breast | breast invasive carcinoma | Female | <65 | I/II | Hormone Therapy | tamoxiphen | SD | ||
| CRLF1 | SNV | Missense_Mutation | novel | c.805C>G | p.Gln269Glu | p.Q269E | O75462 | protein_coding | tolerated(0.14) | possibly_damaging(0.608) | TCGA-MY-A5BF-01 | Cervix | cervical & endocervical cancer | Female | >=65 | I/II | Chemotherapy | cisplatin | CR |
| CRLF1 | SNV | Missense_Mutation | rs745875637 | c.1061N>A | p.Arg354Gln | p.R354Q | O75462 | protein_coding | tolerated_low_confidence(0.1) | benign(0.006) | TCGA-UC-A7PF-01 | Cervix | cervical & endocervical cancer | Female | <65 | I/II | Unknown | Unknown | SD |
| CRLF1 | SNV | Missense_Mutation | c.1237N>G | p.Arg413Gly | p.R413G | O75462 | protein_coding | deleterious_low_confidence(0) | possibly_damaging(0.879) | TCGA-AA-3530-01 | Colorectum | colon adenocarcinoma | Male | >=65 | I/II | Unknown | Unknown | SD | |
| CRLF1 | SNV | Missense_Mutation | rs780528096 | c.214N>A | p.Glu72Lys | p.E72K | O75462 | protein_coding | tolerated(0.15) | benign(0.026) | TCGA-CA-6718-01 | Colorectum | colon adenocarcinoma | Male | <65 | I/II | Unknown | Unknown | PD |
| CRLF1 | insertion | Frame_Shift_Ins | novel | c.254dupC | p.Glu86Ter | p.E86* | O75462 | protein_coding | TCGA-AA-3947-01 | Colorectum | colon adenocarcinoma | Female | <65 | I/II | Unknown | Unknown | SD | ||
| CRLF1 | SNV | Missense_Mutation | novel | c.682G>A | p.Asp228Asn | p.D228N | O75462 | protein_coding | deleterious(0) | possibly_damaging(0.558) | TCGA-A5-A0G2-01 | Endometrium | uterine corpus endometrioid carcinoma | Female | <65 | III/IV | Unknown | Unknown | SD |
| Page: 1 2 3 4 |
Top |
Related drugs of malignant transformation related genes |
| Identification of chemicals and drugs interact with genes involved in malignant transfromation |
| (DGIdb 4.0) |
| Entrez ID | Symbol | Category | Interaction Types | Drug Claim Name | Drug Name | PMIDs |
| Page: 1 |

Copyright 2023-Present -The University of Texas Health Science Center at Houston |