
|
|||||
|
 | |
| |
| |
| |
| |
| |
|
Gene: CRISPLD2 |
Gene summary for CRISPLD2 |
| Gene information | Species | Human | Gene symbol | CRISPLD2 | Gene ID | 83716 |
| Gene name | cysteine rich secretory protein LCCL domain containing 2 | |
| Gene Alias | CRISP11 | |
| Cytomap | 16q24.1 | |
| Gene Type | protein-coding | GO ID | GO:0007275 | UniProtAcc | A0A140VK80 |
Top |
Malignant transformation analysis |
| Identification of the aberrant gene expression in precancerous and cancerous lesions by comparing the gene expression of stem-like cells in diseased tissues with normal stem cells |
| Entrez ID | Symbol | Replicates | Species | Organ | Tissue | Adj P-value | Log2FC | Malignancy |
| 83716 | CRISPLD2 | C04 | Human | Oral cavity | OSCC | 1.59e-03 | -5.24e-01 | 0.2633 |
| 83716 | CRISPLD2 | C21 | Human | Oral cavity | OSCC | 1.09e-05 | -5.30e-01 | 0.2678 |
| 83716 | CRISPLD2 | C43 | Human | Oral cavity | OSCC | 7.15e-15 | -6.28e-01 | 0.1704 |
| 83716 | CRISPLD2 | C46 | Human | Oral cavity | OSCC | 1.45e-10 | -5.12e-01 | 0.1673 |
| 83716 | CRISPLD2 | C57 | Human | Oral cavity | OSCC | 9.47e-09 | -6.87e-01 | 0.1679 |
| 83716 | CRISPLD2 | C08 | Human | Oral cavity | OSCC | 1.76e-15 | -6.48e-01 | 0.1919 |
| 83716 | CRISPLD2 | C09 | Human | Oral cavity | OSCC | 7.31e-07 | -5.86e-01 | 0.1431 |
| 83716 | CRISPLD2 | LN46 | Human | Oral cavity | OSCC | 1.12e-08 | -2.74e-01 | 0.1666 |
| 83716 | CRISPLD2 | NEOLP-1 | Human | Oral cavity | NEOLP | 5.93e-04 | 3.91e-01 | -0.0194 |
| 83716 | CRISPLD2 | NEOLP-2 | Human | Oral cavity | NEOLP | 4.86e-06 | 4.91e-01 | -0.0196 |
| 83716 | CRISPLD2 | NEOLP-3 | Human | Oral cavity | NEOLP | 6.07e-10 | 6.35e-01 | -0.0191 |
| 83716 | CRISPLD2 | SYSMH1 | Human | Oral cavity | OSCC | 6.05e-17 | -6.90e-01 | 0.1127 |
| 83716 | CRISPLD2 | SYSMH2 | Human | Oral cavity | OSCC | 1.01e-15 | -6.50e-01 | 0.2326 |
| 83716 | CRISPLD2 | SYSMH3 | Human | Oral cavity | OSCC | 1.85e-07 | -5.47e-01 | 0.2442 |
| 83716 | CRISPLD2 | SYSMH4 | Human | Oral cavity | OSCC | 8.17e-12 | -6.46e-01 | 0.1226 |
| 83716 | CRISPLD2 | SYSMH5 | Human | Oral cavity | OSCC | 4.93e-16 | -6.68e-01 | 0.0647 |
| 83716 | CRISPLD2 | SYSMH6 | Human | Oral cavity | OSCC | 8.63e-20 | -6.02e-01 | 0.1275 |
| 83716 | CRISPLD2 | ATC13 | Human | Thyroid | ATC | 3.78e-44 | 9.91e-01 | 0.34 |
| 83716 | CRISPLD2 | ATC2 | Human | Thyroid | ATC | 7.12e-08 | 1.31e+00 | 0.34 |
| 83716 | CRISPLD2 | ATC5 | Human | Thyroid | ATC | 9.05e-51 | 1.07e+00 | 0.34 |
| Page: 1 |
| Tissue | Expression Dynamics | Abbreviation |
| Oral Cavity |  | EOLP: Erosive Oral lichen planus |
| LP: leukoplakia | ||
| NEOLP: Non-erosive oral lichen planus | ||
| OSCC: Oral squamous cell carcinoma | ||
| Thyroid | 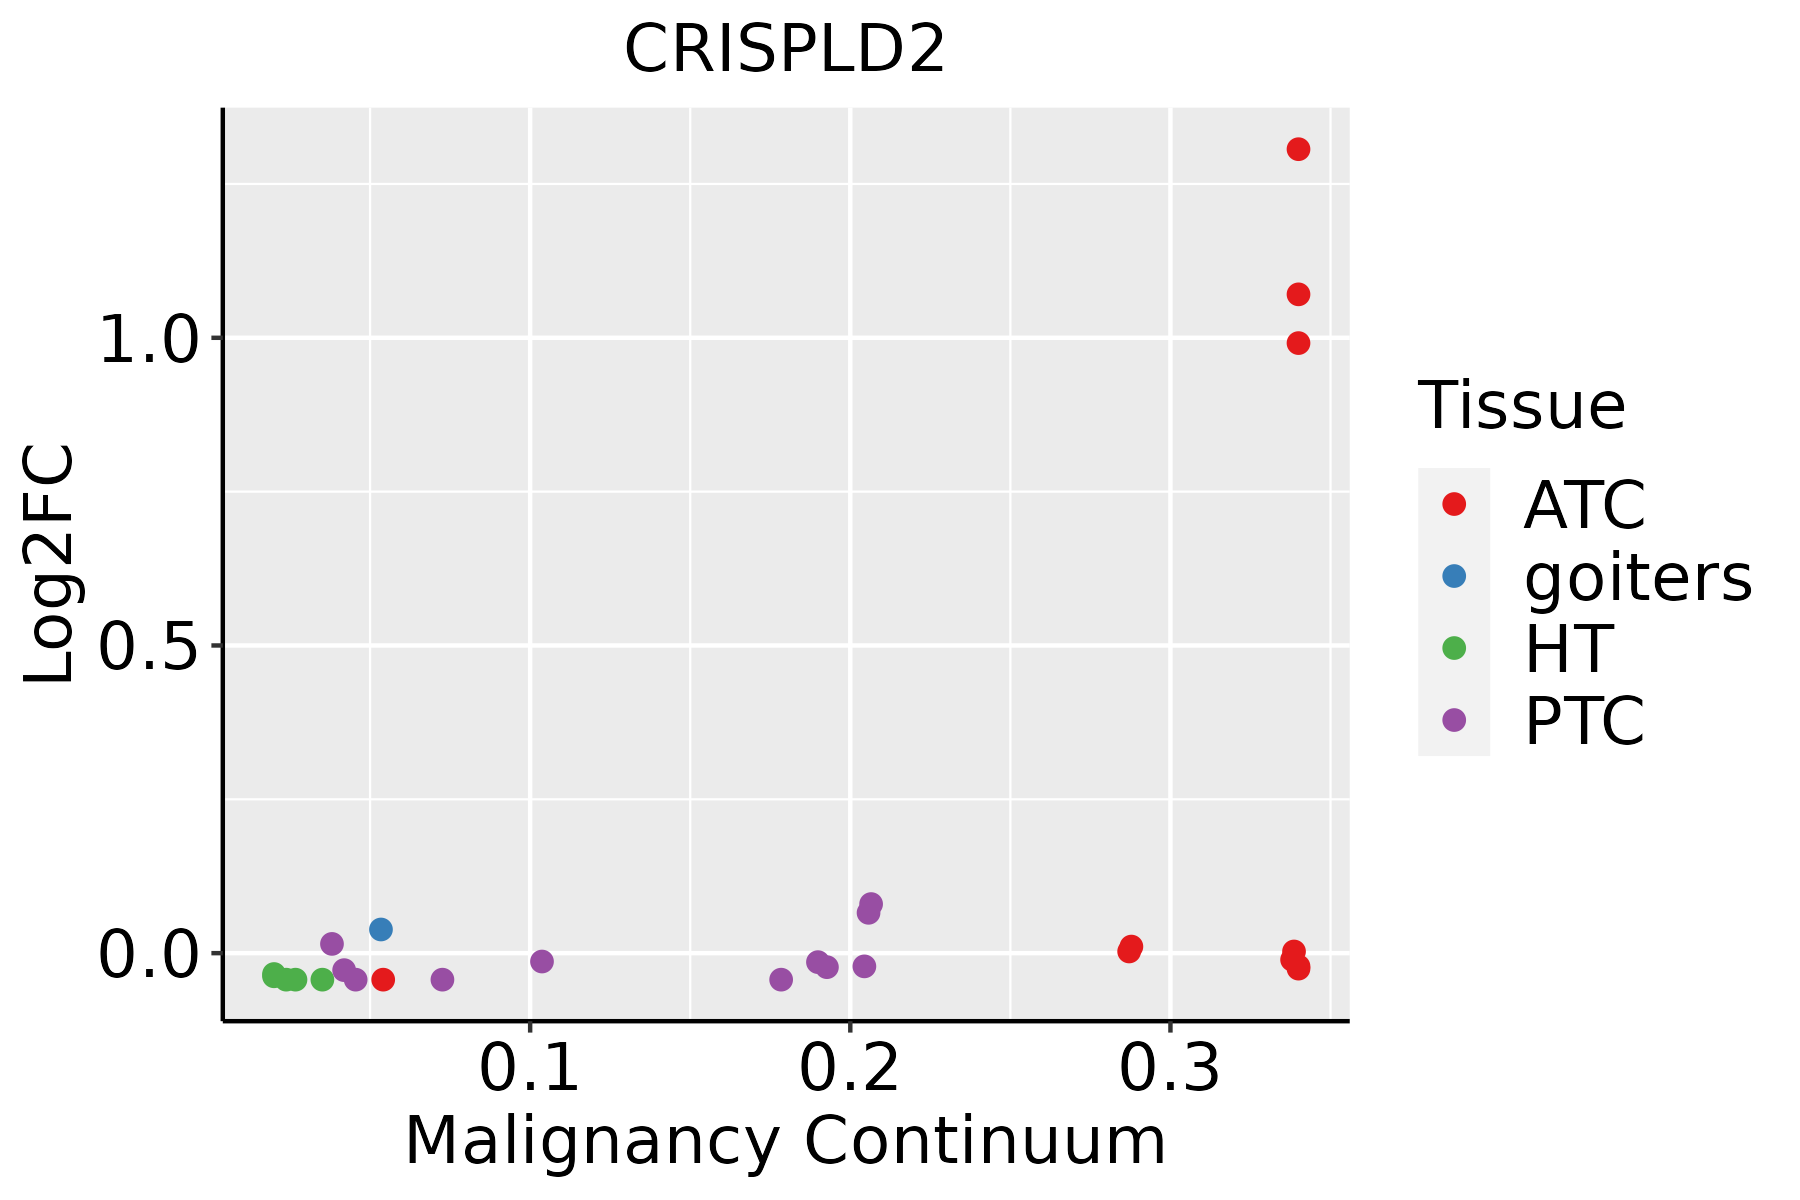 | ATC: Anaplastic thyroid cancer |
| HT: Hashimoto's thyroiditis | ||
| PTC: Papillary thyroid cancer |
| ∗log2FC in expression of this searched gene in stem-like cells from each diseased tissue sample relative to stem-like cells in normal samples in each tissue plotted against the malignancy continuum. Samples are colored based on if they are from different disease stage. |
Top |
Malignant transformation related pathway analysis |
| Find out the enriched GO biological processes and KEGG pathways involved in transition from healthy to precancer to cancer |
| Tissue | Disease Stage | Enriched GO biological Processes |
| Colorectum | AD |  |
| Colorectum | SER |  |
| Colorectum | MSS |  |
| Colorectum | MSI-H |  |
| Colorectum | FAP |  |
| ∗Top 15 enriched GO BP terms are showed in the bar plot of each disease state in each tissue. Each row represents a significant GO biological process which is colored according to the -log10(p.adjust). |
| Page: 1 2 3 4 5 6 7 8 9 |
| GO ID | Tissue | Disease Stage | Description | Gene Ratio | Bg Ratio | pvalue | p.adjust | Count |
| GO:00303238 | Oral cavity | OSCC | respiratory tube development | 95/7305 | 181/18723 | 1.53e-04 | 1.07e-03 | 95 |
| GO:00301983 | Oral cavity | OSCC | extracellular matrix organization | 146/7305 | 301/18723 | 4.67e-04 | 2.77e-03 | 146 |
| GO:00303248 | Oral cavity | OSCC | lung development | 91/7305 | 177/18723 | 5.18e-04 | 3.01e-03 | 91 |
| GO:00452293 | Oral cavity | OSCC | external encapsulating structure organization | 147/7305 | 304/18723 | 5.30e-04 | 3.08e-03 | 147 |
| GO:00430623 | Oral cavity | OSCC | extracellular structure organization | 146/7305 | 302/18723 | 5.59e-04 | 3.23e-03 | 146 |
| GO:0060324 | Oral cavity | OSCC | face development | 28/7305 | 44/18723 | 8.15e-04 | 4.35e-03 | 28 |
| GO:00605416 | Oral cavity | OSCC | respiratory system development | 100/7305 | 203/18723 | 1.83e-03 | 8.60e-03 | 100 |
| GO:00603252 | Oral cavity | OSCC | face morphogenesis | 18/7305 | 28/18723 | 5.96e-03 | 2.27e-02 | 18 |
| GO:0060323 | Oral cavity | OSCC | head morphogenesis | 19/7305 | 32/18723 | 1.56e-02 | 5.00e-02 | 19 |
| GO:00301982 | Oral cavity | NEOLP | extracellular matrix organization | 64/2005 | 301/18723 | 5.66e-08 | 2.24e-06 | 64 |
| GO:00430622 | Oral cavity | NEOLP | extracellular structure organization | 64/2005 | 302/18723 | 6.44e-08 | 2.50e-06 | 64 |
| GO:00452292 | Oral cavity | NEOLP | external encapsulating structure organization | 64/2005 | 304/18723 | 8.33e-08 | 3.17e-06 | 64 |
| GO:00603241 | Oral cavity | NEOLP | face development | 16/2005 | 44/18723 | 6.27e-06 | 1.26e-04 | 16 |
| GO:00603231 | Oral cavity | NEOLP | head morphogenesis | 12/2005 | 32/18723 | 6.38e-05 | 8.40e-04 | 12 |
| GO:00603251 | Oral cavity | NEOLP | face morphogenesis | 11/2005 | 28/18723 | 7.84e-05 | 1.00e-03 | 11 |
| GO:0010171 | Oral cavity | NEOLP | body morphogenesis | 14/2005 | 43/18723 | 9.66e-05 | 1.18e-03 | 14 |
| GO:003032315 | Oral cavity | NEOLP | respiratory tube development | 33/2005 | 181/18723 | 1.58e-03 | 1.11e-02 | 33 |
| GO:006054114 | Oral cavity | NEOLP | respiratory system development | 35/2005 | 203/18723 | 3.08e-03 | 1.88e-02 | 35 |
| GO:003032416 | Oral cavity | NEOLP | lung development | 31/2005 | 177/18723 | 4.04e-03 | 2.30e-02 | 31 |
| GO:003019812 | Thyroid | ATC | extracellular matrix organization | 152/6293 | 301/18723 | 8.63e-10 | 2.24e-08 | 152 |
| Page: 1 2 |
| Pathway ID | Tissue | Disease Stage | Description | Gene Ratio | Bg Ratio | pvalue | p.adjust | qvalue | Count |
| Page: 1 |
Top |
Cell-cell communication analysis |
| Identification of potential cell-cell interactions between two cell types and their ligand-receptor pairs for different disease states |
| Ligand | Receptor | LRpair | Pathway | Tissue | Disease Stage |
| Page: 1 |
Top |
Single-cell gene regulatory network inference analysis |
| Find out the significant the regulons (TFs) and the target genes of each regulon across cell types for different disease states |
| TF | Cell Type | Tissue | Disease Stage | Target Gene | RSS | Regulon Activity |
| ∗The dot plots of a searched regulon are shown for all cell subpopulations in each disease state of each tissue based on the regulon specific score inferred using pySCENIC and by calculating the average expression. |
| Page: 1 |
Top |
Somatic mutation of malignant transformation related genes |
| Annotation of somatic variants for genes involved in malignant transformation |
| Hugo Symbol | Variant Class | Variant Classification | dbSNP RS | HGVSc | HGVSp | HGVSp Short | SWISSPROT | BIOTYPE | SIFT | PolyPhen | Tumor Sample Barcode | Tissue | Histology | Sex | Age | Stage | Therapy Types | Drugs | Outcome |
| CRISPLD2 | SNV | Missense_Mutation | rs761262421 | c.707N>A | p.Arg236Gln | p.R236Q | Q9H0B8 | protein_coding | tolerated(0.09) | benign(0.003) | TCGA-E2-A1LB-01 | Breast | breast invasive carcinoma | Female | <65 | I/II | Chemotherapy | cytoxan | SD |
| CRISPLD2 | insertion | In_Frame_Ins | novel | c.409_410insGTATTAAGC | p.Asp137delinsGlyIleLysHis | p.D137delinsGIKH | Q9H0B8 | protein_coding | TCGA-A7-A0CE-01 | Breast | breast invasive carcinoma | Female | <65 | I/II | Chemotherapy | adriamycin | SD | ||
| CRISPLD2 | SNV | Missense_Mutation | c.812N>T | p.Arg271Ile | p.R271I | Q9H0B8 | protein_coding | tolerated(0.14) | benign(0.154) | TCGA-DG-A2KK-01 | Cervix | cervical & endocervical cancer | Female | <65 | III/IV | Chemotherapy | cisplatin | SD | |
| CRISPLD2 | SNV | Missense_Mutation | novel | c.1204N>C | p.Glu402Gln | p.E402Q | Q9H0B8 | protein_coding | tolerated(0.45) | benign(0.014) | TCGA-VS-A958-01 | Cervix | cervical & endocervical cancer | Female | <65 | I/II | Chemotherapy | cisplatin | CR |
| CRISPLD2 | SNV | Missense_Mutation | c.503N>T | p.Ala168Val | p.A168V | Q9H0B8 | protein_coding | deleterious(0) | probably_damaging(0.993) | TCGA-AA-3864-01 | Colorectum | colon adenocarcinoma | Male | >=65 | I/II | Unknown | Unknown | SD | |
| CRISPLD2 | SNV | Missense_Mutation | novel | c.737N>T | p.Thr246Met | p.T246M | Q9H0B8 | protein_coding | deleterious(0.03) | possibly_damaging(0.459) | TCGA-AA-3949-01 | Colorectum | colon adenocarcinoma | Female | >=65 | III/IV | Unknown | Unknown | SD |
| CRISPLD2 | SNV | Missense_Mutation | rs763668278 | c.1258G>A | p.Glu420Lys | p.E420K | Q9H0B8 | protein_coding | tolerated(0.21) | possibly_damaging(0.611) | TCGA-AA-3984-01 | Colorectum | colon adenocarcinoma | Female | <65 | I/II | Unknown | Unknown | SD |
| CRISPLD2 | SNV | Missense_Mutation | c.398N>T | p.Asp133Val | p.D133V | Q9H0B8 | protein_coding | deleterious(0) | probably_damaging(0.984) | TCGA-AZ-4313-01 | Colorectum | colon adenocarcinoma | Female | <65 | I/II | Unknown | Unknown | SD | |
| CRISPLD2 | SNV | Missense_Mutation | c.253N>A | p.Glu85Lys | p.E85K | Q9H0B8 | protein_coding | deleterious(0.03) | benign(0.044) | TCGA-AZ-4315-01 | Colorectum | colon adenocarcinoma | Male | <65 | I/II | Unknown | Unknown | SD | |
| CRISPLD2 | SNV | Missense_Mutation | rs199608437 | c.647G>A | p.Arg216Gln | p.R216Q | Q9H0B8 | protein_coding | tolerated(0.12) | benign(0.003) | TCGA-NH-A5IV-01 | Colorectum | colon adenocarcinoma | Female | >=65 | I/II | Unknown | Unknown | SD |
| Page: 1 2 3 4 5 |
Top |
Related drugs of malignant transformation related genes |
| Identification of chemicals and drugs interact with genes involved in malignant transfromation |
| (DGIdb 4.0) |
| Entrez ID | Symbol | Category | Interaction Types | Drug Claim Name | Drug Name | PMIDs |
| 83716 | CRISPLD2 | DRUGGABLE GENOME | dexamethasone | DEXAMETHASONE | 24926665 |
| Page: 1 |

Copyright 2023-Present -The University of Texas Health Science Center at Houston |