
|
|||||
|
 | |
| |
| |
| |
| |
| |
|
Gene: CRIPT |
Gene summary for CRIPT |
| Gene information | Species | Human | Gene symbol | CRIPT | Gene ID | 9419 |
| Gene name | CXXC repeat containing interactor of PDZ3 domain | |
| Gene Alias | HSPC139 | |
| Cytomap | 2p21 | |
| Gene Type | protein-coding | GO ID | GO:0000226 | UniProtAcc | Q9P021 |
Top |
Malignant transformation analysis |
| Identification of the aberrant gene expression in precancerous and cancerous lesions by comparing the gene expression of stem-like cells in diseased tissues with normal stem cells |
| Entrez ID | Symbol | Replicates | Species | Organ | Tissue | Adj P-value | Log2FC | Malignancy |
| 9419 | CRIPT | LZE4T | Human | Esophagus | ESCC | 1.14e-13 | 7.54e-01 | 0.0811 |
| 9419 | CRIPT | LZE5T | Human | Esophagus | ESCC | 5.28e-05 | 4.38e-01 | 0.0514 |
| 9419 | CRIPT | LZE7T | Human | Esophagus | ESCC | 2.29e-06 | 7.33e-01 | 0.0667 |
| 9419 | CRIPT | LZE8T | Human | Esophagus | ESCC | 1.19e-06 | 1.77e-01 | 0.067 |
| 9419 | CRIPT | LZE22T | Human | Esophagus | ESCC | 4.91e-04 | 5.25e-01 | 0.068 |
| 9419 | CRIPT | LZE24T | Human | Esophagus | ESCC | 3.08e-12 | 5.24e-01 | 0.0596 |
| 9419 | CRIPT | LZE6T | Human | Esophagus | ESCC | 5.38e-04 | 4.92e-01 | 0.0845 |
| 9419 | CRIPT | P1T-E | Human | Esophagus | ESCC | 2.45e-06 | 6.06e-01 | 0.0875 |
| 9419 | CRIPT | P2T-E | Human | Esophagus | ESCC | 1.89e-34 | 7.39e-01 | 0.1177 |
| 9419 | CRIPT | P4T-E | Human | Esophagus | ESCC | 1.37e-25 | 9.46e-01 | 0.1323 |
| 9419 | CRIPT | P5T-E | Human | Esophagus | ESCC | 5.85e-33 | 6.51e-01 | 0.1327 |
| 9419 | CRIPT | P8T-E | Human | Esophagus | ESCC | 5.75e-17 | 4.05e-01 | 0.0889 |
| 9419 | CRIPT | P9T-E | Human | Esophagus | ESCC | 3.19e-22 | 6.89e-01 | 0.1131 |
| 9419 | CRIPT | P10T-E | Human | Esophagus | ESCC | 2.87e-31 | 6.38e-01 | 0.116 |
| 9419 | CRIPT | P11T-E | Human | Esophagus | ESCC | 1.14e-10 | 6.47e-01 | 0.1426 |
| 9419 | CRIPT | P12T-E | Human | Esophagus | ESCC | 1.20e-37 | 6.73e-01 | 0.1122 |
| 9419 | CRIPT | P15T-E | Human | Esophagus | ESCC | 5.02e-29 | 9.17e-01 | 0.1149 |
| 9419 | CRIPT | P16T-E | Human | Esophagus | ESCC | 3.63e-33 | 6.87e-01 | 0.1153 |
| 9419 | CRIPT | P17T-E | Human | Esophagus | ESCC | 4.84e-07 | 6.64e-01 | 0.1278 |
| 9419 | CRIPT | P19T-E | Human | Esophagus | ESCC | 1.70e-02 | 8.30e-01 | 0.1662 |
| Page: 1 2 3 4 5 6 |
| Tissue | Expression Dynamics | Abbreviation |
| Esophagus | 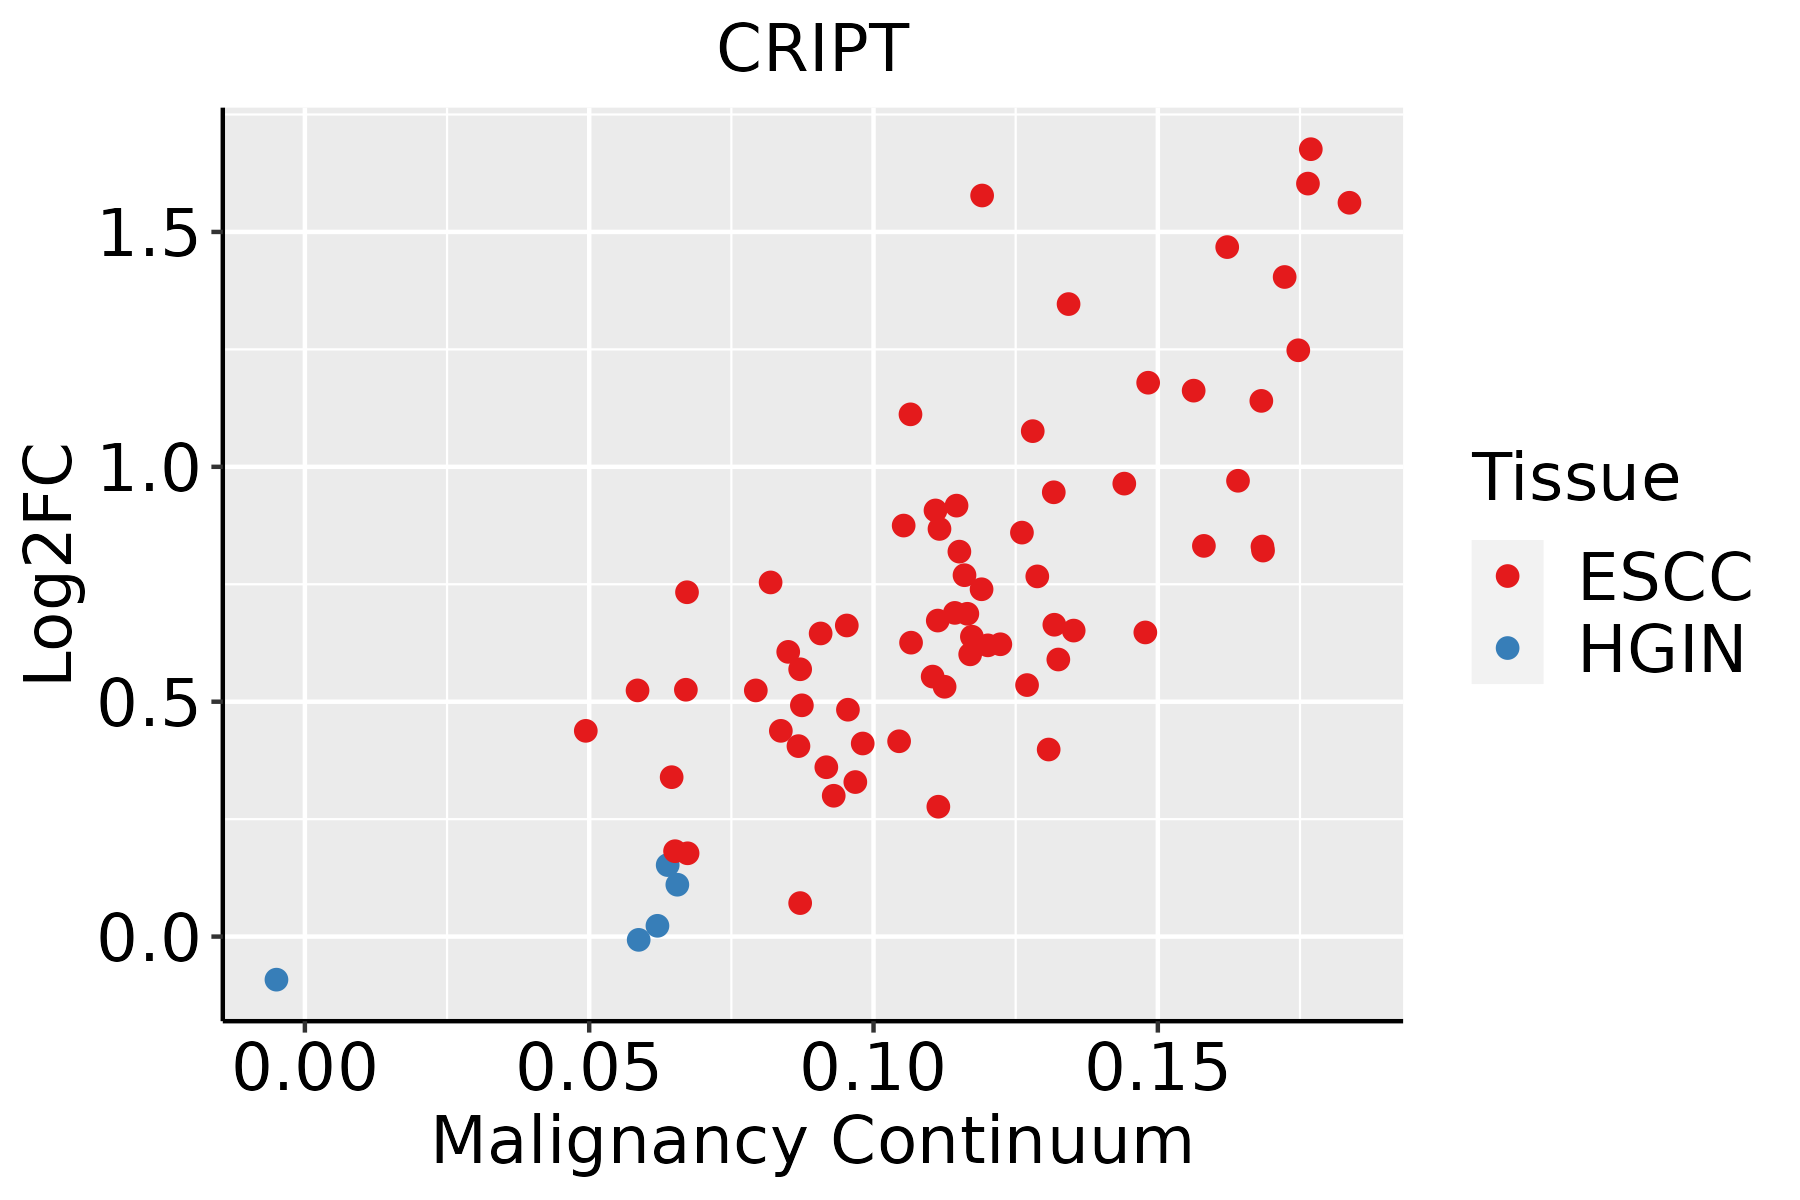 | ESCC: Esophageal squamous cell carcinoma |
| HGIN: High-grade intraepithelial neoplasias | ||
| LGIN: Low-grade intraepithelial neoplasias | ||
| Liver |  | HCC: Hepatocellular carcinoma |
| NAFLD: Non-alcoholic fatty liver disease | ||
| Oral Cavity | 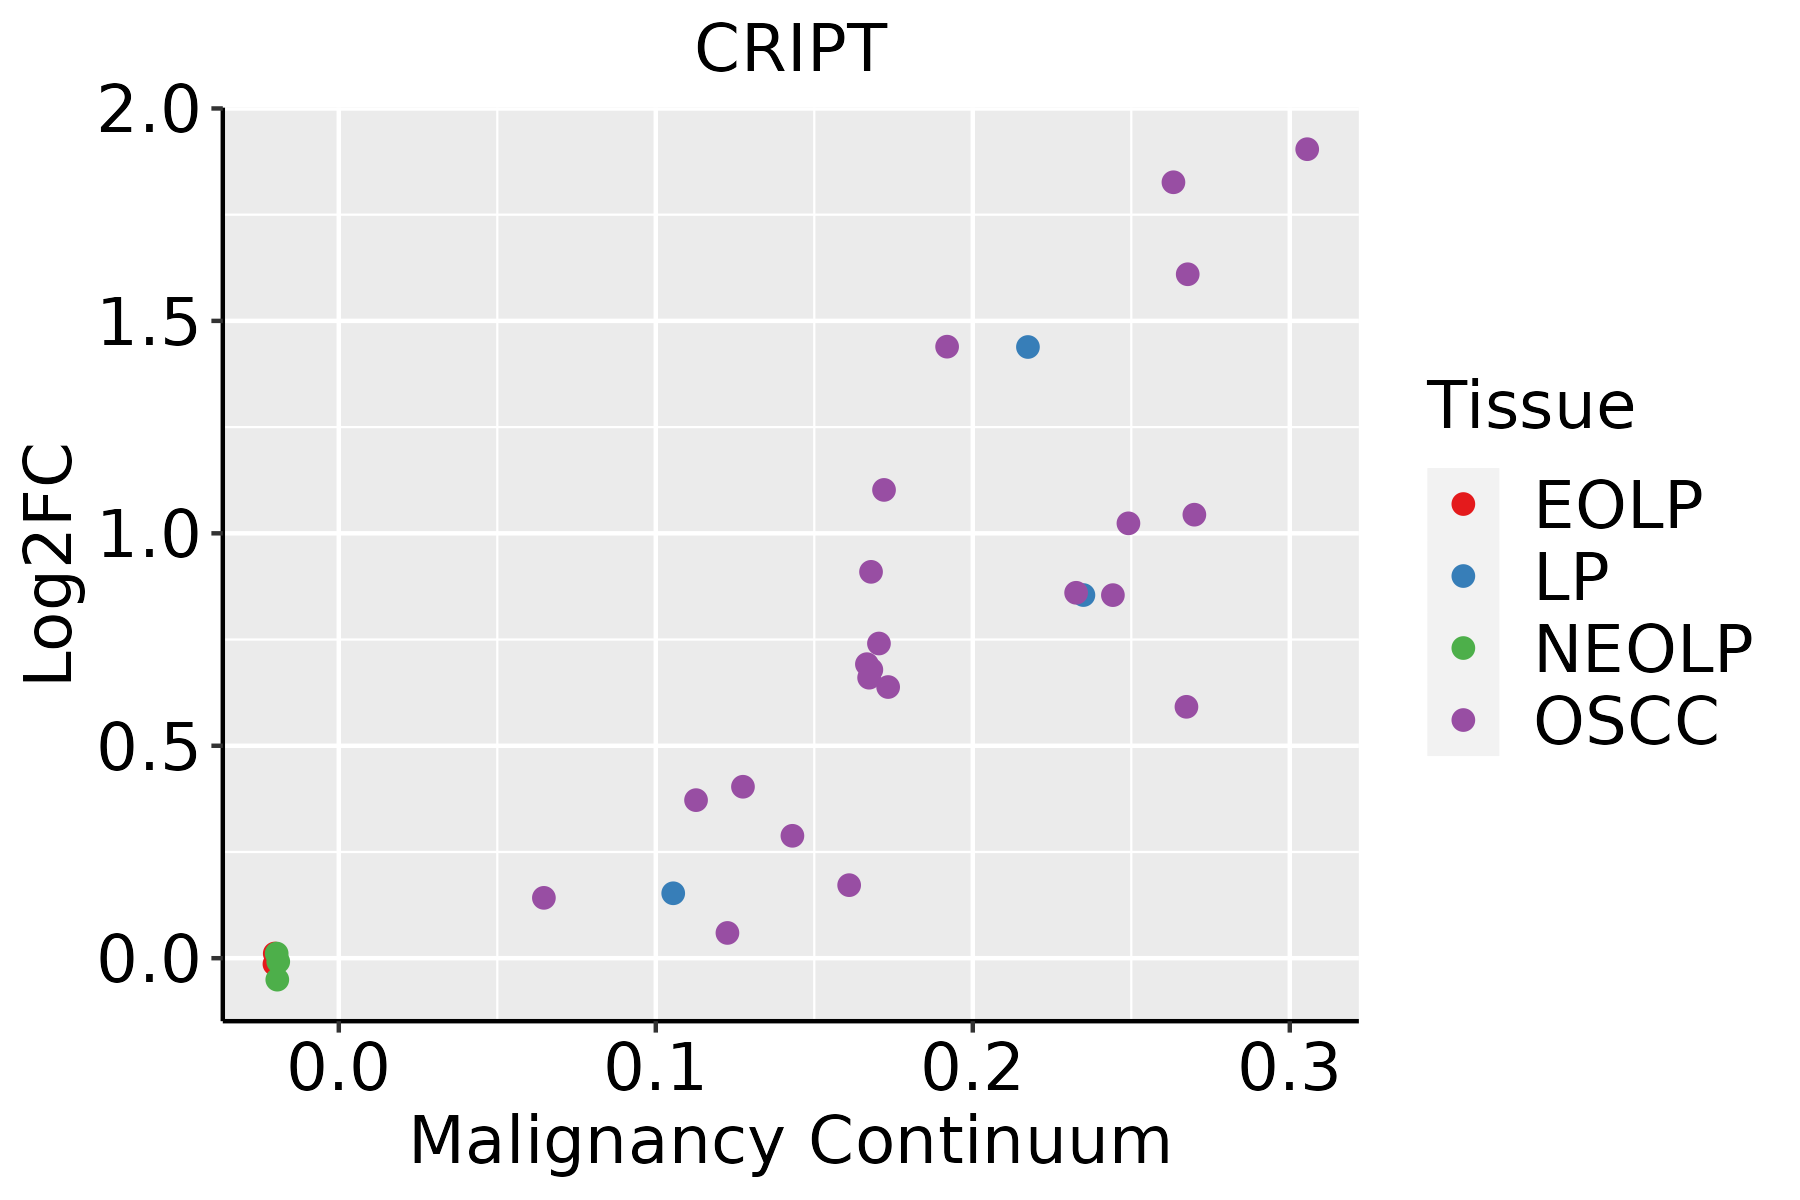 | EOLP: Erosive Oral lichen planus |
| LP: leukoplakia | ||
| NEOLP: Non-erosive oral lichen planus | ||
| OSCC: Oral squamous cell carcinoma | ||
| Skin |  | AK: Actinic keratosis |
| cSCC: Cutaneous squamous cell carcinoma | ||
| SCCIS:squamous cell carcinoma in situ |
| ∗log2FC in expression of this searched gene in stem-like cells from each diseased tissue sample relative to stem-like cells in normal samples in each tissue plotted against the malignancy continuum. Samples are colored based on if they are from different disease stage. |
Top |
Malignant transformation related pathway analysis |
| Find out the enriched GO biological processes and KEGG pathways involved in transition from healthy to precancer to cancer |
| Tissue | Disease Stage | Enriched GO biological Processes |
| Colorectum | AD |  |
| Colorectum | SER |  |
| Colorectum | MSS |  |
| Colorectum | MSI-H |  |
| Colorectum | FAP |  |
| ∗Top 15 enriched GO BP terms are showed in the bar plot of each disease state in each tissue. Each row represents a significant GO biological process which is colored according to the -log10(p.adjust). |
| Page: 1 2 3 4 5 6 7 8 9 |
| GO ID | Tissue | Disease Stage | Description | Gene Ratio | Bg Ratio | pvalue | p.adjust | Count |
| GO:190547519 | Esophagus | ESCC | regulation of protein localization to membrane | 117/8552 | 175/18723 | 1.14e-08 | 2.26e-07 | 117 |
| GO:00726985 | Esophagus | ESCC | protein localization to microtubule cytoskeleton | 43/8552 | 54/18723 | 3.28e-07 | 4.61e-06 | 43 |
| GO:00443804 | Esophagus | ESCC | protein localization to cytoskeleton | 45/8552 | 58/18723 | 6.89e-07 | 8.99e-06 | 45 |
| GO:00311227 | Esophagus | ESCC | cytoplasmic microtubule organization | 38/8552 | 56/18723 | 6.60e-04 | 3.50e-03 | 38 |
| GO:0035372 | Esophagus | ESCC | protein localization to microtubule | 15/8552 | 18/18723 | 1.20e-03 | 5.88e-03 | 15 |
| GO:19054755 | Liver | Cirrhotic | regulation of protein localization to membrane | 76/4634 | 175/18723 | 4.55e-08 | 1.45e-06 | 76 |
| GO:190547511 | Liver | HCC | regulation of protein localization to membrane | 113/7958 | 175/18723 | 2.90e-09 | 7.78e-08 | 113 |
| GO:00443802 | Liver | HCC | protein localization to cytoskeleton | 38/7958 | 58/18723 | 3.37e-04 | 2.36e-03 | 38 |
| GO:007269811 | Liver | HCC | protein localization to microtubule cytoskeleton | 35/7958 | 54/18723 | 7.73e-04 | 4.65e-03 | 35 |
| GO:00311222 | Liver | HCC | cytoplasmic microtubule organization | 35/7958 | 56/18723 | 2.00e-03 | 1.01e-02 | 35 |
| GO:190547516 | Oral cavity | OSCC | regulation of protein localization to membrane | 105/7305 | 175/18723 | 1.42e-08 | 2.85e-07 | 105 |
| GO:00311226 | Oral cavity | OSCC | cytoplasmic microtubule organization | 39/7305 | 56/18723 | 3.29e-06 | 3.93e-05 | 39 |
| GO:00443803 | Oral cavity | OSCC | protein localization to cytoskeleton | 33/7305 | 58/18723 | 4.32e-03 | 1.75e-02 | 33 |
| GO:00726984 | Oral cavity | OSCC | protein localization to microtubule cytoskeleton | 30/7305 | 54/18723 | 9.99e-03 | 3.49e-02 | 30 |
| GO:190547517 | Oral cavity | LP | regulation of protein localization to membrane | 74/4623 | 175/18723 | 2.26e-07 | 6.81e-06 | 74 |
| GO:190547524 | Skin | cSCC | regulation of protein localization to membrane | 72/4864 | 175/18723 | 8.12e-06 | 1.09e-04 | 72 |
| GO:00443805 | Skin | cSCC | protein localization to cytoskeleton | 26/4864 | 58/18723 | 1.44e-03 | 9.09e-03 | 26 |
| GO:003112214 | Skin | cSCC | cytoplasmic microtubule organization | 25/4864 | 56/18723 | 1.90e-03 | 1.14e-02 | 25 |
| GO:00726986 | Skin | cSCC | protein localization to microtubule cytoskeleton | 24/4864 | 54/18723 | 2.49e-03 | 1.42e-02 | 24 |
| Page: 1 |
| Pathway ID | Tissue | Disease Stage | Description | Gene Ratio | Bg Ratio | pvalue | p.adjust | qvalue | Count |
| Page: 1 |
Top |
Cell-cell communication analysis |
| Identification of potential cell-cell interactions between two cell types and their ligand-receptor pairs for different disease states |
| Ligand | Receptor | LRpair | Pathway | Tissue | Disease Stage |
| Page: 1 |
Top |
Single-cell gene regulatory network inference analysis |
| Find out the significant the regulons (TFs) and the target genes of each regulon across cell types for different disease states |
| TF | Cell Type | Tissue | Disease Stage | Target Gene | RSS | Regulon Activity |
| ∗The dot plots of a searched regulon are shown for all cell subpopulations in each disease state of each tissue based on the regulon specific score inferred using pySCENIC and by calculating the average expression. |
| Page: 1 |
Top |
Somatic mutation of malignant transformation related genes |
| Annotation of somatic variants for genes involved in malignant transformation |
| Hugo Symbol | Variant Class | Variant Classification | dbSNP RS | HGVSc | HGVSp | HGVSp Short | SWISSPROT | BIOTYPE | SIFT | PolyPhen | Tumor Sample Barcode | Tissue | Histology | Sex | Age | Stage | Therapy Types | Drugs | Outcome |
| CRIPT | SNV | Missense_Mutation | novel | c.130A>C | p.Lys44Gln | p.K44Q | Q9P021 | protein_coding | deleterious(0.01) | benign(0.097) | TCGA-2W-A8YY-01 | Cervix | cervical & endocervical cancer | Female | <65 | I/II | Chemotherapy | cisplatin | CR |
| CRIPT | SNV | Missense_Mutation | rs758897566 | c.251N>T | p.Ala84Val | p.A84V | Q9P021 | protein_coding | deleterious(0) | probably_damaging(0.984) | TCGA-G4-6628-01 | Colorectum | colon adenocarcinoma | Male | >=65 | I/II | Unknown | Unknown | SD |
| CRIPT | SNV | Missense_Mutation | rs750649993 | c.156N>T | p.Lys52Asn | p.K52N | Q9P021 | protein_coding | tolerated(0.23) | probably_damaging(0.987) | TCGA-F5-6814-01 | Colorectum | rectum adenocarcinoma | Male | <65 | I/II | Unknown | Unknown | SD |
| CRIPT | insertion | Frame_Shift_Ins | rs774890871 | c.125_126insA | p.Ala45SerfsTer4 | p.A45Sfs*4 | Q9P021 | protein_coding | TCGA-G4-6302-01 | Colorectum | colon adenocarcinoma | Female | >=65 | I/II | Unknown | Unknown | SD | ||
| CRIPT | SNV | Missense_Mutation | novel | c.238N>G | p.Lys80Glu | p.K80E | Q9P021 | protein_coding | deleterious(0) | probably_damaging(0.973) | TCGA-AJ-A3EL-01 | Endometrium | uterine corpus endometrioid carcinoma | Female | <65 | I/II | Unknown | Unknown | SD |
| CRIPT | SNV | Missense_Mutation | c.189N>G | p.Ser63Arg | p.S63R | Q9P021 | protein_coding | tolerated(0.26) | benign(0.144) | TCGA-AX-A0J0-01 | Endometrium | uterine corpus endometrioid carcinoma | Female | <65 | I/II | Unknown | Unknown | SD | |
| CRIPT | SNV | Missense_Mutation | novel | c.51N>A | p.Asp17Glu | p.D17E | Q9P021 | protein_coding | tolerated(0.06) | probably_damaging(0.983) | TCGA-AX-A2HJ-01 | Endometrium | uterine corpus endometrioid carcinoma | Female | <65 | I/II | Unknown | Unknown | SD |
| CRIPT | SNV | Missense_Mutation | novel | c.115G>T | p.Ala39Ser | p.A39S | Q9P021 | protein_coding | deleterious(0.01) | benign(0.024) | TCGA-EO-A22R-01 | Endometrium | uterine corpus endometrioid carcinoma | Female | <65 | I/II | Unknown | Unknown | SD |
| CRIPT | SNV | Missense_Mutation | rs367572446 | c.176G>T | p.Arg59Ile | p.R59I | Q9P021 | protein_coding | tolerated(0.06) | probably_damaging(0.985) | TCGA-EO-A3B0-01 | Endometrium | uterine corpus endometrioid carcinoma | Female | <65 | III/IV | Unknown | Unknown | SD |
| CRIPT | insertion | Frame_Shift_Ins | rs774890871 | c.125_126insA | p.Ala45SerfsTer4 | p.A45Sfs*4 | Q9P021 | protein_coding | TCGA-DD-AADM-01 | Liver | liver hepatocellular carcinoma | Male | <65 | I/II | Unknown | Unknown | SD |
| Page: 1 2 |
Top |
Related drugs of malignant transformation related genes |
| Identification of chemicals and drugs interact with genes involved in malignant transfromation |
| (DGIdb 4.0) |
| Entrez ID | Symbol | Category | Interaction Types | Drug Claim Name | Drug Name | PMIDs |
| Page: 1 |

Copyright 2023-Present -The University of Texas Health Science Center at Houston |