
|
|||||
|
 | |
| |
| |
| |
| |
| |
|
Gene: CRIP2 |
Gene summary for CRIP2 |
| Gene information | Species | Human | Gene symbol | CRIP2 | Gene ID | 1397 |
| Gene name | cysteine rich protein 2 | |
| Gene Alias | CRIP | |
| Cytomap | 14q32.33 | |
| Gene Type | protein-coding | GO ID | GO:0002376 | UniProtAcc | P52943 |
Top |
Malignant transformation analysis |
| Identification of the aberrant gene expression in precancerous and cancerous lesions by comparing the gene expression of stem-like cells in diseased tissues with normal stem cells |
| Entrez ID | Symbol | Replicates | Species | Organ | Tissue | Adj P-value | Log2FC | Malignancy |
| 1397 | CRIP2 | GSM4909289 | Human | Breast | IDC | 2.36e-03 | 5.52e-01 | 0.1064 |
| 1397 | CRIP2 | GSM4909290 | Human | Breast | IDC | 2.31e-19 | 6.68e-01 | 0.2096 |
| 1397 | CRIP2 | GSM4909291 | Human | Breast | IDC | 1.55e-35 | 9.36e-01 | 0.1753 |
| 1397 | CRIP2 | GSM4909293 | Human | Breast | IDC | 1.03e-52 | 8.01e-01 | 0.1581 |
| 1397 | CRIP2 | GSM4909294 | Human | Breast | IDC | 7.18e-11 | 3.83e-01 | 0.2022 |
| 1397 | CRIP2 | GSM4909296 | Human | Breast | IDC | 2.53e-38 | 8.25e-01 | 0.1524 |
| 1397 | CRIP2 | GSM4909297 | Human | Breast | IDC | 3.08e-09 | 1.59e-01 | 0.1517 |
| 1397 | CRIP2 | GSM4909299 | Human | Breast | IDC | 6.80e-03 | 2.55e-01 | 0.035 |
| 1397 | CRIP2 | GSM4909301 | Human | Breast | IDC | 3.05e-16 | 4.53e-01 | 0.1577 |
| 1397 | CRIP2 | GSM4909302 | Human | Breast | IDC | 2.15e-08 | 4.31e-01 | 0.1545 |
| 1397 | CRIP2 | GSM4909304 | Human | Breast | IDC | 1.02e-93 | 1.18e+00 | 0.1636 |
| 1397 | CRIP2 | GSM4909305 | Human | Breast | IDC | 4.52e-11 | 4.93e-01 | 0.0436 |
| 1397 | CRIP2 | GSM4909306 | Human | Breast | IDC | 4.32e-09 | 3.82e-01 | 0.1564 |
| 1397 | CRIP2 | GSM4909308 | Human | Breast | IDC | 6.32e-03 | -2.86e-01 | 0.158 |
| 1397 | CRIP2 | GSM4909309 | Human | Breast | IDC | 4.73e-05 | 3.72e-01 | 0.0483 |
| 1397 | CRIP2 | GSM4909311 | Human | Breast | IDC | 7.20e-29 | 2.69e-01 | 0.1534 |
| 1397 | CRIP2 | GSM4909312 | Human | Breast | IDC | 5.76e-21 | 5.22e-01 | 0.1552 |
| 1397 | CRIP2 | GSM4909313 | Human | Breast | IDC | 4.33e-12 | 4.99e-01 | 0.0391 |
| 1397 | CRIP2 | GSM4909315 | Human | Breast | IDC | 4.98e-53 | 9.65e-01 | 0.21 |
| 1397 | CRIP2 | GSM4909316 | Human | Breast | IDC | 1.08e-40 | 1.27e+00 | 0.21 |
| Page: 1 2 3 4 5 6 7 8 9 |
| Tissue | Expression Dynamics | Abbreviation |
| Breast |  | IDC: Invasive ductal carcinoma |
| DCIS: Ductal carcinoma in situ | ||
| Precancer(BRCA1-mut): Precancerous lesion from BRCA1 mutation carriers | ||
| Cervix |  | CC: Cervix cancer |
| HSIL_HPV: HPV-infected high-grade squamous intraepithelial lesions | ||
| N_HPV: HPV-infected normal cervix | ||
| Endometrium |  | AEH: Atypical endometrial hyperplasia |
| EEC: Endometrioid Cancer | ||
| Esophagus | 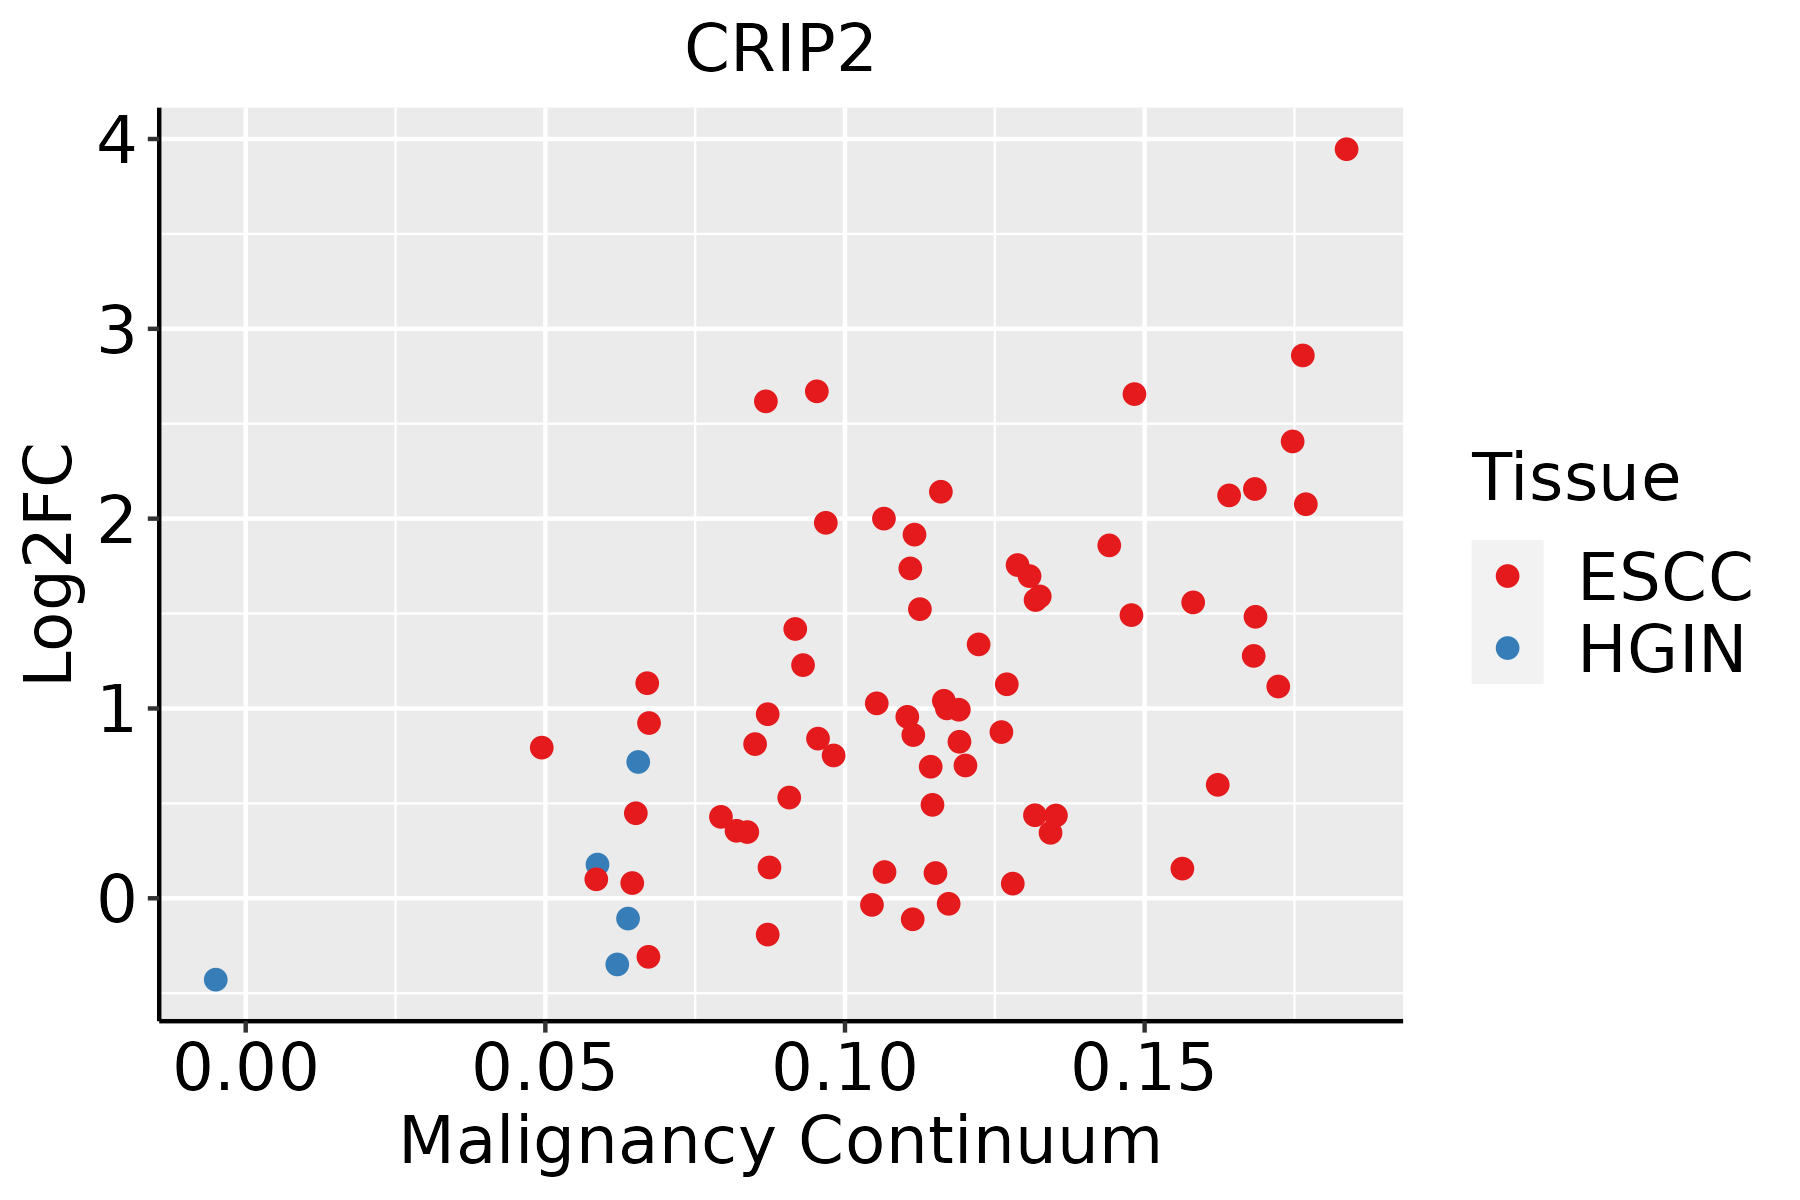 | ESCC: Esophageal squamous cell carcinoma |
| HGIN: High-grade intraepithelial neoplasias | ||
| LGIN: Low-grade intraepithelial neoplasias | ||
| GC | 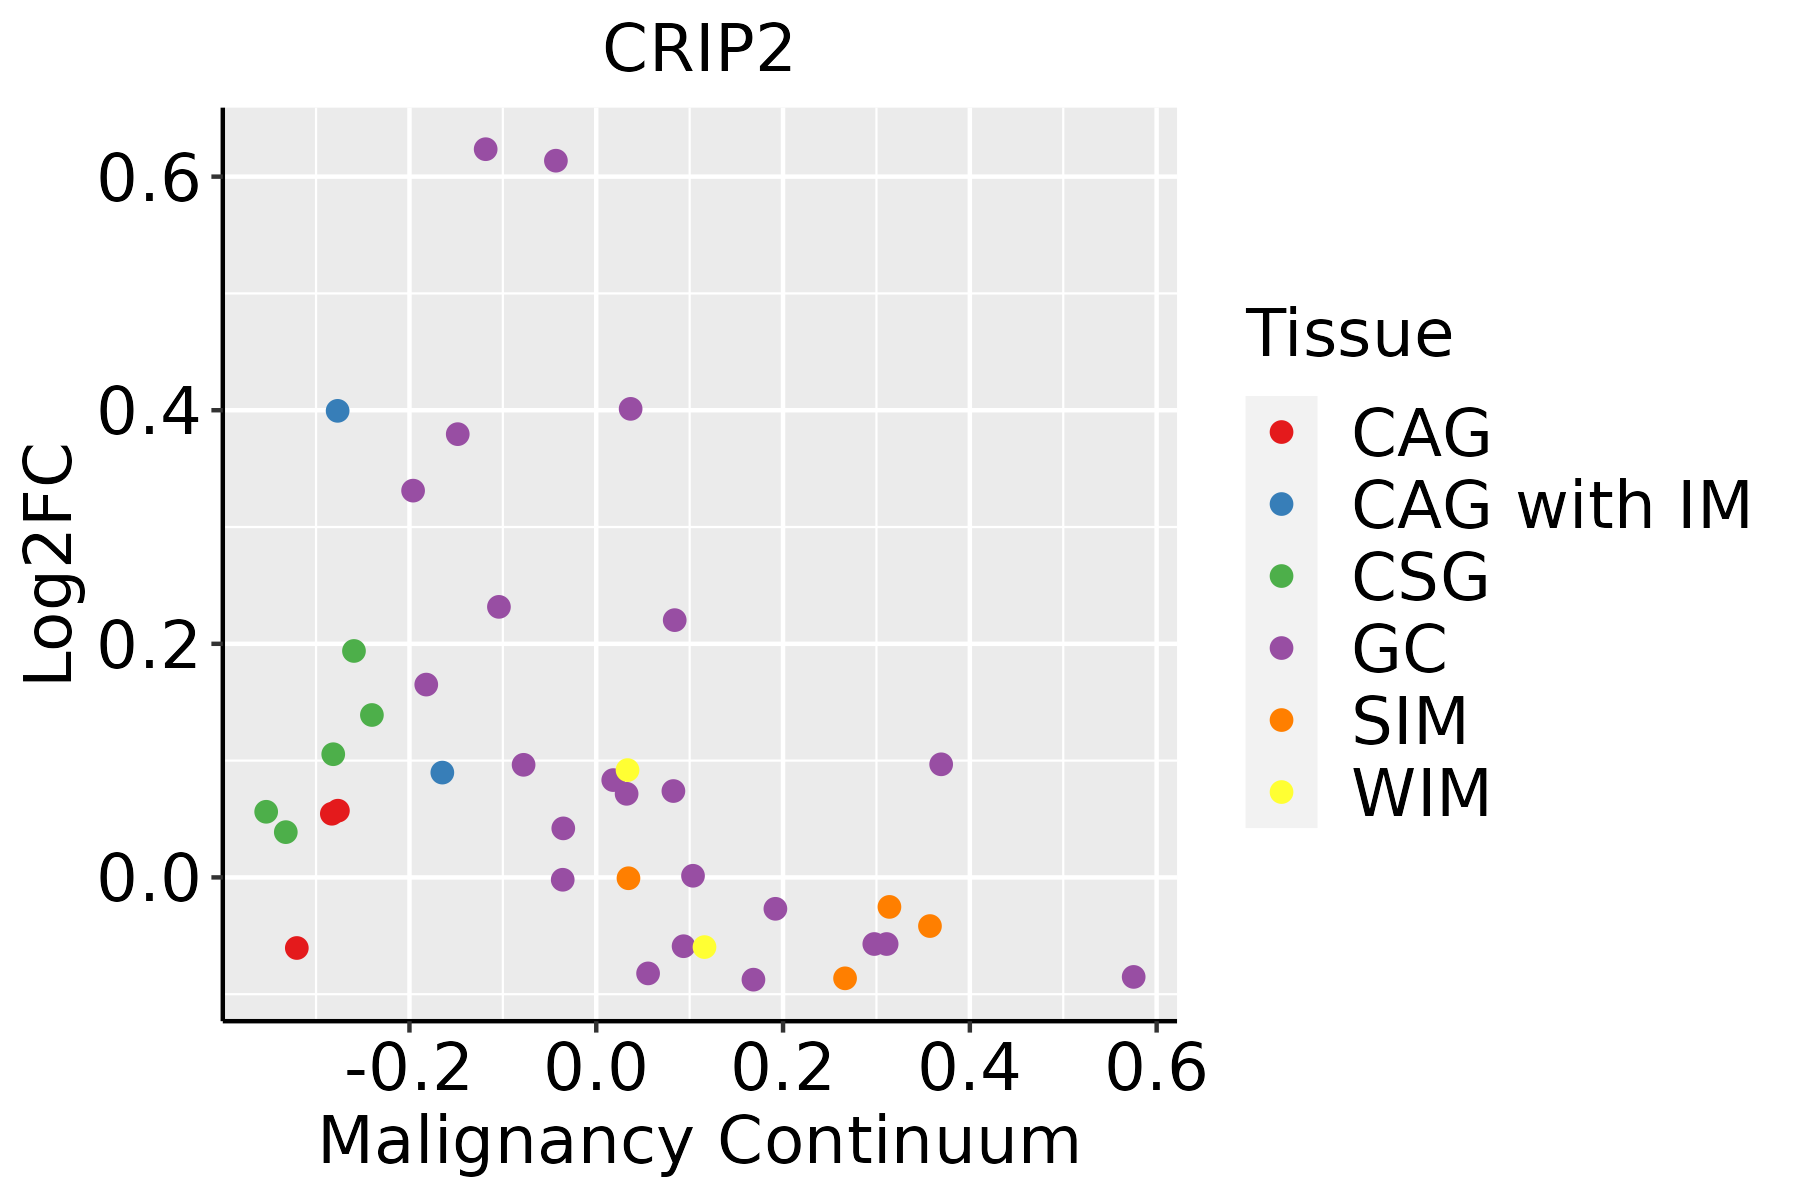 | CAG: Chronic atrophic gastritis |
| CAG with IM: Chronic atrophic gastritis with intestinal metaplasia | ||
| CSG: Chronic superficial gastritis | ||
| GC: Gastric cancer | ||
| SIM: Severe intestinal metaplasia | ||
| WIM: Wild intestinal metaplasia | ||
| Liver | 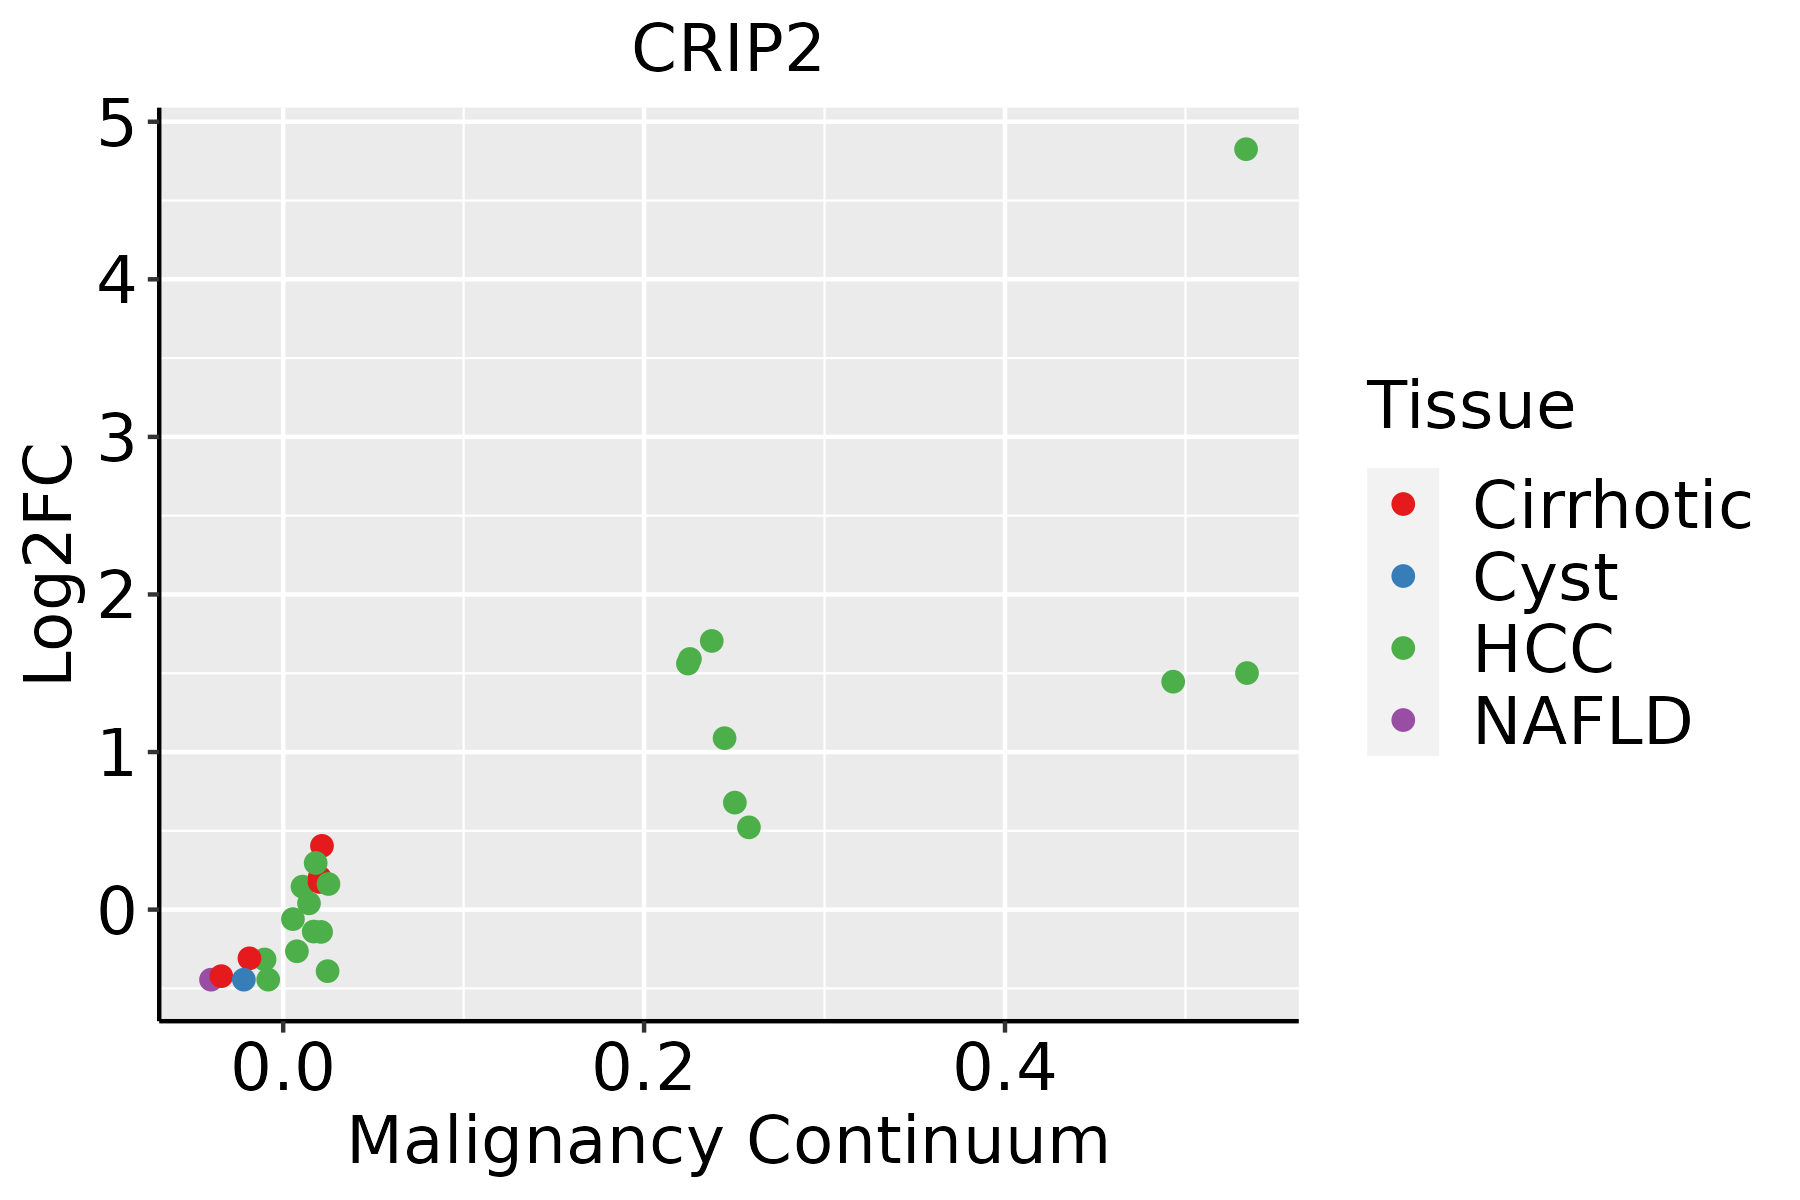 | HCC: Hepatocellular carcinoma |
| NAFLD: Non-alcoholic fatty liver disease | ||
| Lung | 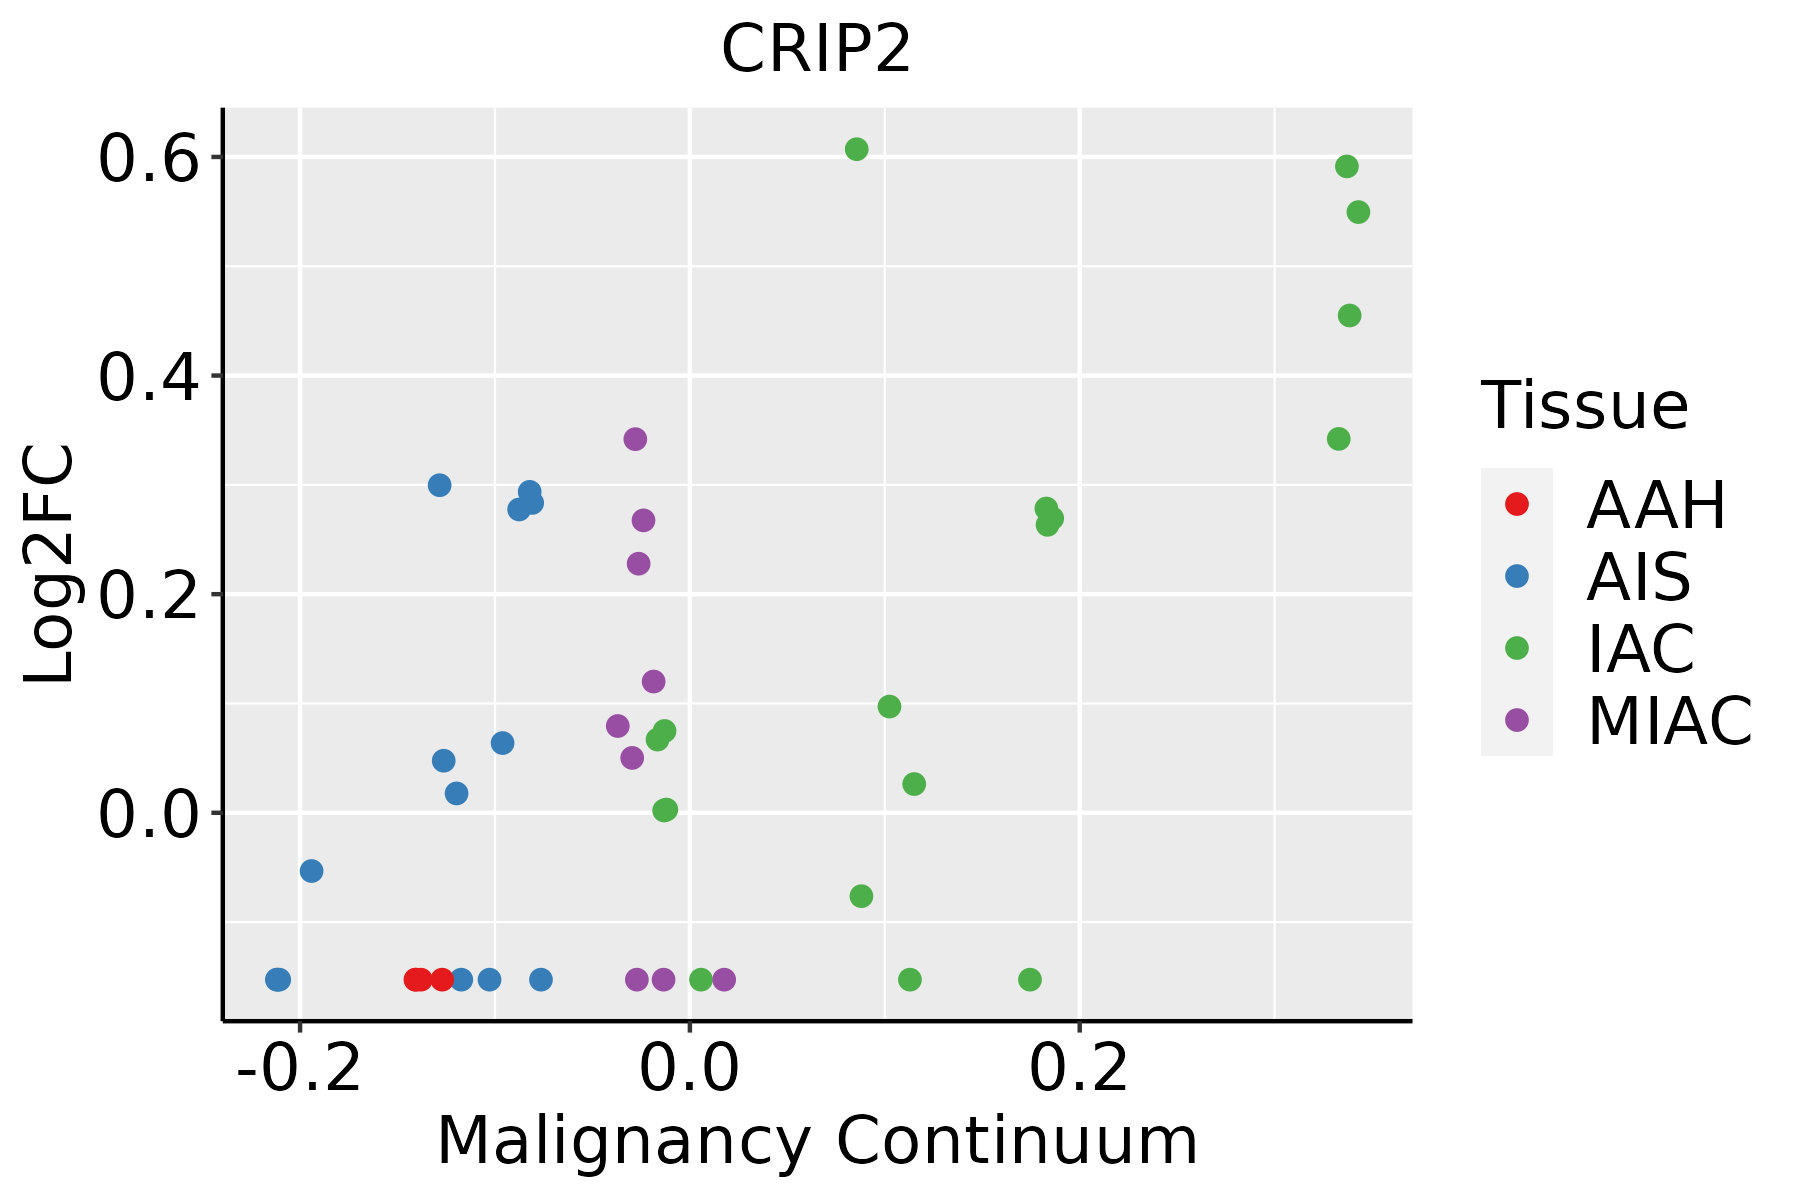 | AAH: Atypical adenomatous hyperplasia |
| AIS: Adenocarcinoma in situ | ||
| IAC: Invasive lung adenocarcinoma | ||
| MIA: Minimally invasive adenocarcinoma | ||
| Oral Cavity | 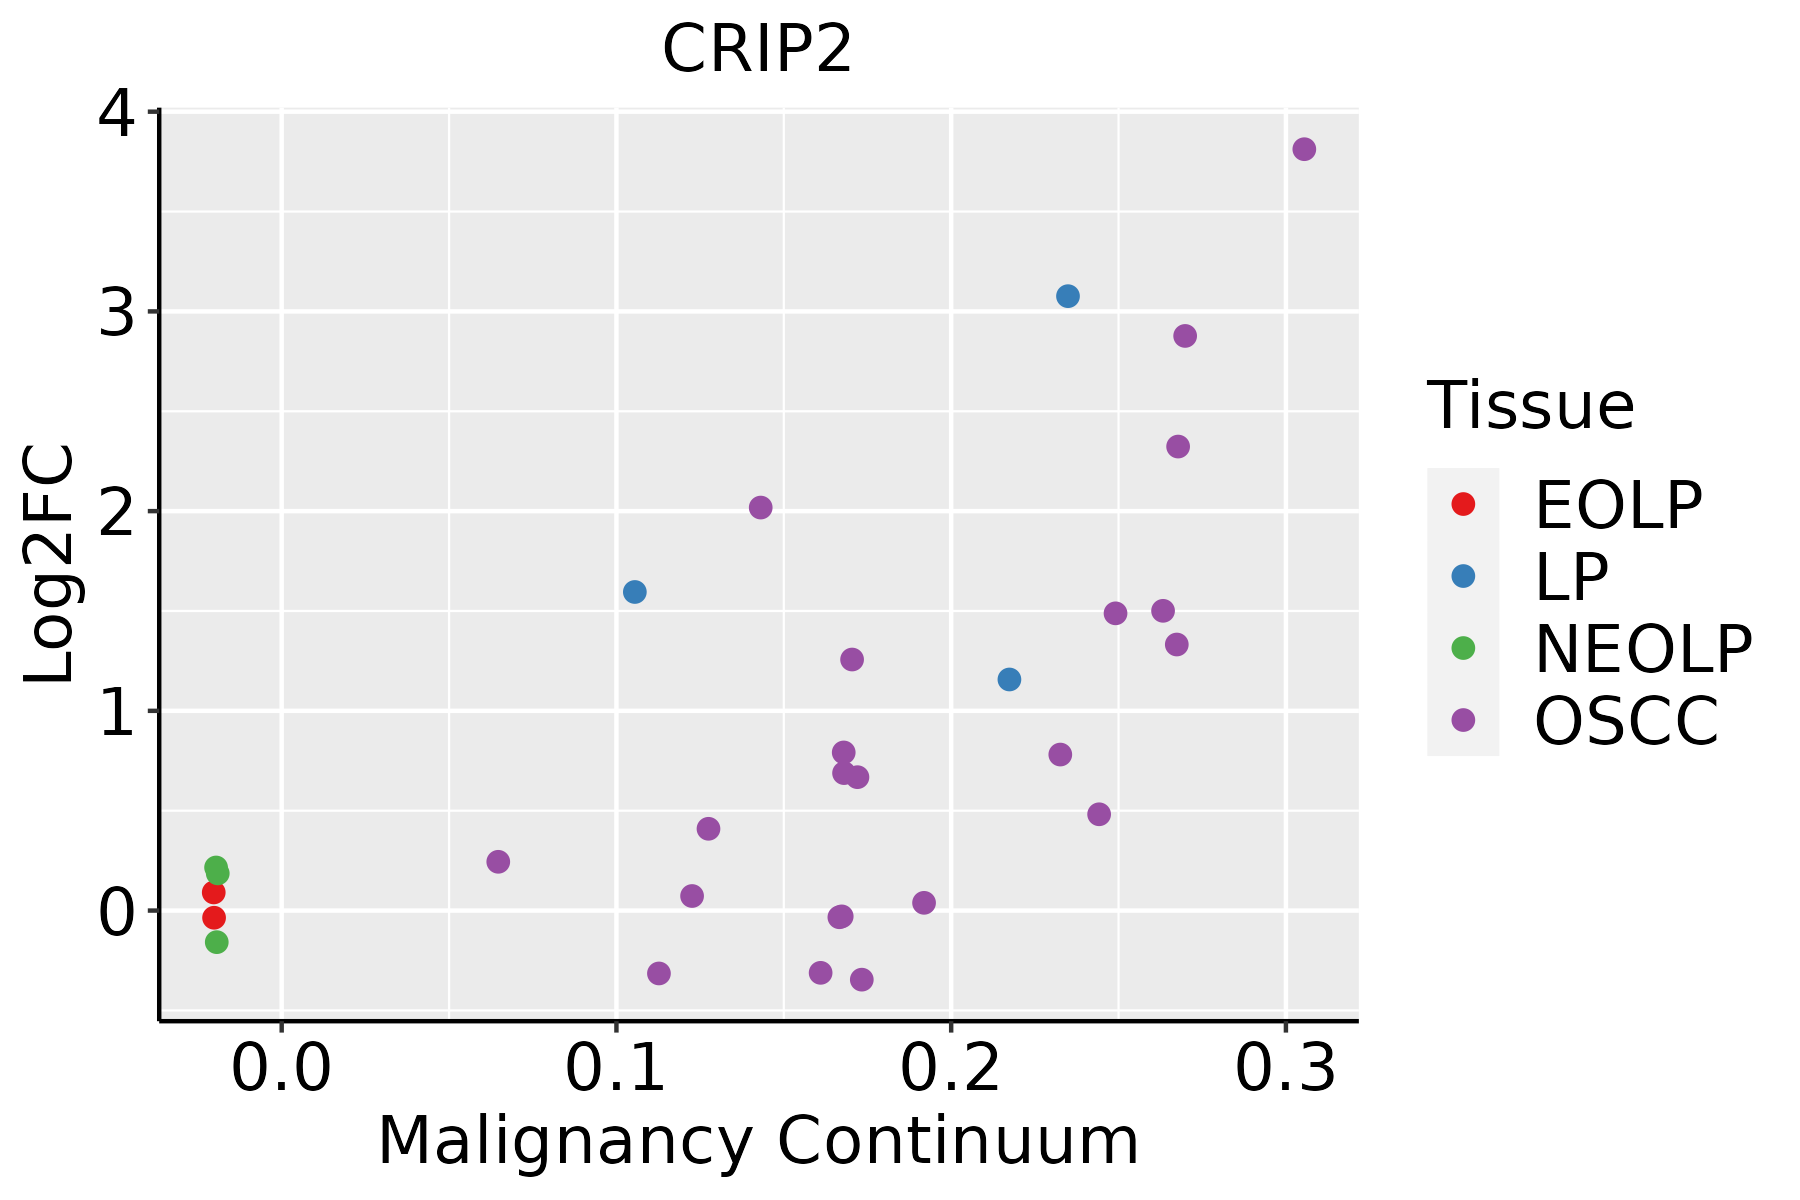 | EOLP: Erosive Oral lichen planus |
| LP: leukoplakia | ||
| NEOLP: Non-erosive oral lichen planus | ||
| OSCC: Oral squamous cell carcinoma | ||
| Prostate |  | BPH: Benign Prostatic Hyperplasia |
| Skin | 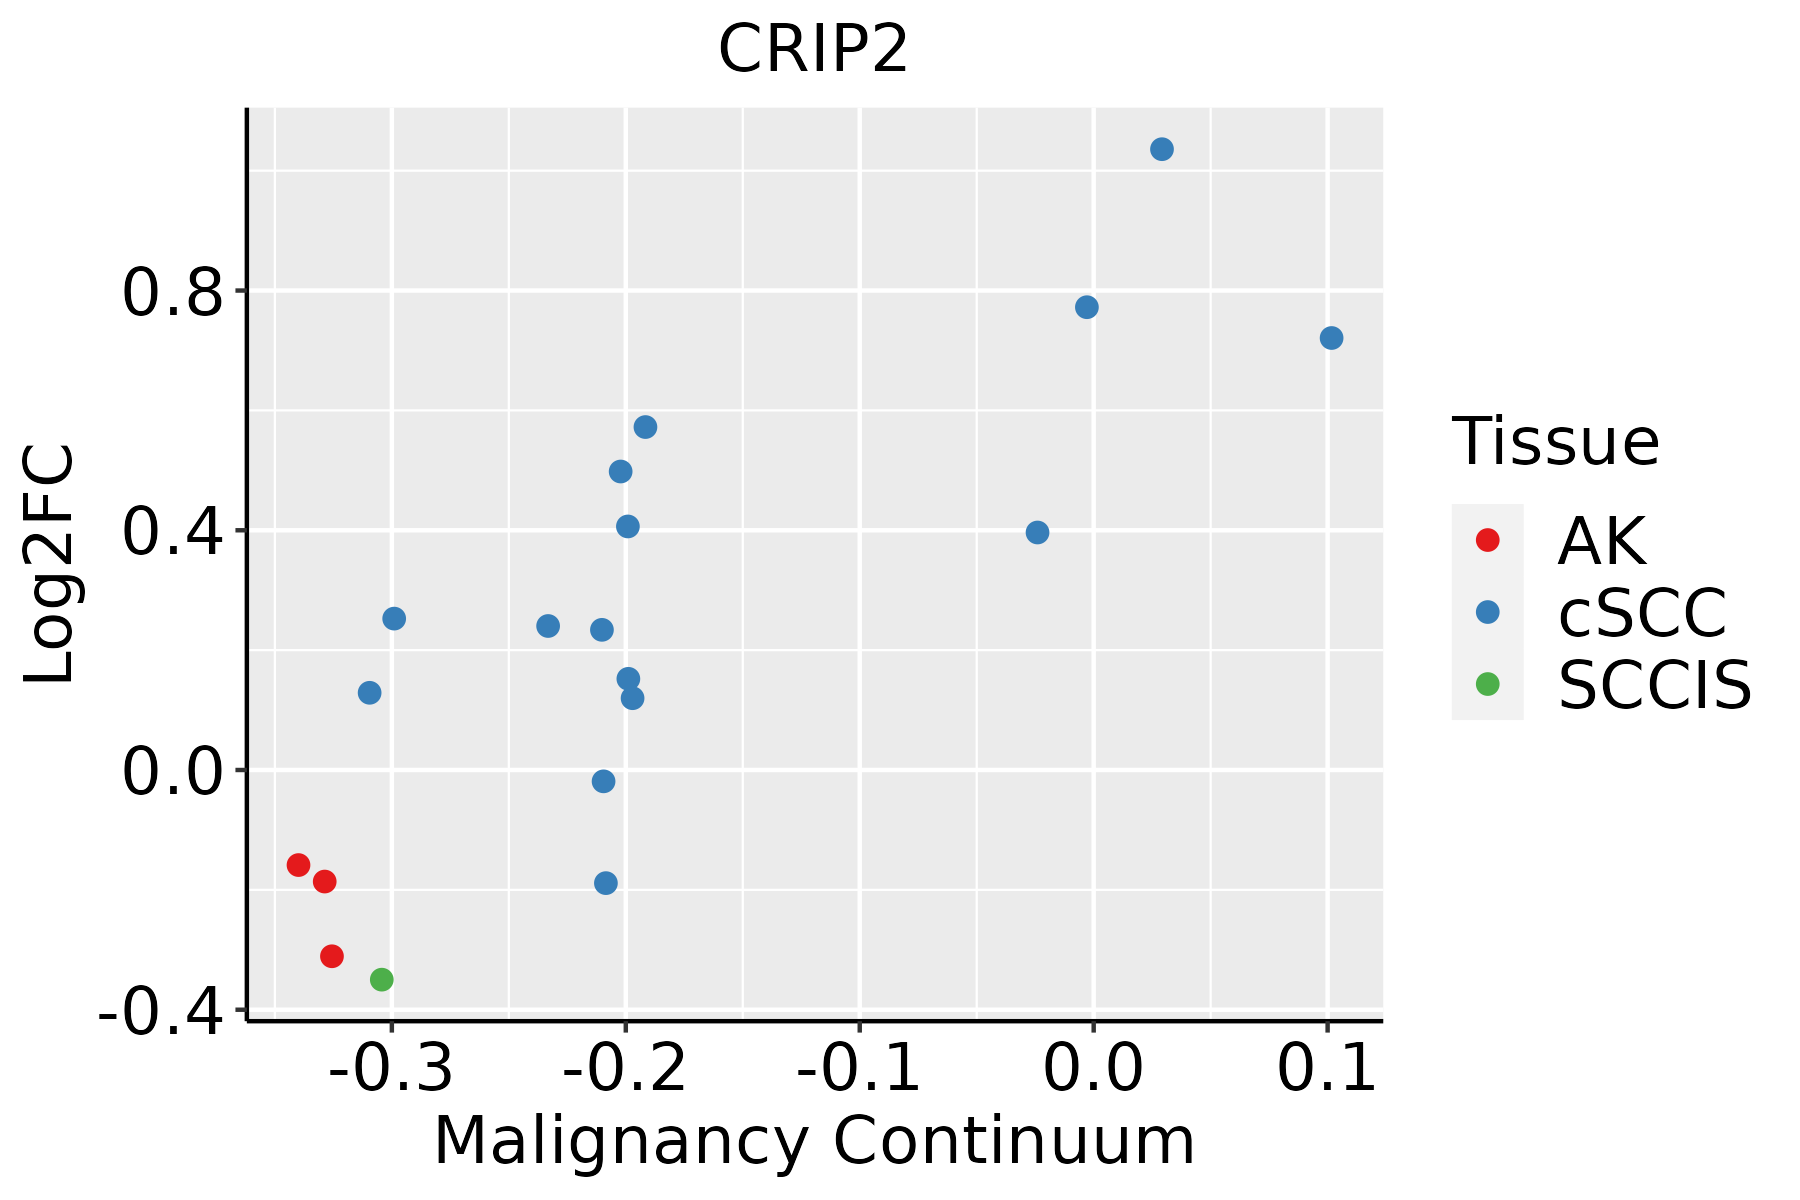 | AK: Actinic keratosis |
| cSCC: Cutaneous squamous cell carcinoma | ||
| SCCIS:squamous cell carcinoma in situ | ||
| Thyroid |  | ATC: Anaplastic thyroid cancer |
| HT: Hashimoto's thyroiditis | ||
| PTC: Papillary thyroid cancer |
| ∗log2FC in expression of this searched gene in stem-like cells from each diseased tissue sample relative to stem-like cells in normal samples in each tissue plotted against the malignancy continuum. Samples are colored based on if they are from different disease stage. |
Top |
Malignant transformation related pathway analysis |
| Find out the enriched GO biological processes and KEGG pathways involved in transition from healthy to precancer to cancer |
| Tissue | Disease Stage | Enriched GO biological Processes |
| Colorectum | AD |  |
| Colorectum | SER |  |
| Colorectum | MSS |  |
| Colorectum | MSI-H |  |
| Colorectum | FAP |  |
| ∗Top 15 enriched GO BP terms are showed in the bar plot of each disease state in each tissue. Each row represents a significant GO biological process which is colored according to the -log10(p.adjust). |
| Page: 1 2 3 4 5 6 7 8 9 |
| GO ID | Tissue | Disease Stage | Description | Gene Ratio | Bg Ratio | pvalue | p.adjust | Count |
| Page: 1 |
| Pathway ID | Tissue | Disease Stage | Description | Gene Ratio | Bg Ratio | pvalue | p.adjust | qvalue | Count |
| Page: 1 |
Top |
Cell-cell communication analysis |
| Identification of potential cell-cell interactions between two cell types and their ligand-receptor pairs for different disease states |
| Ligand | Receptor | LRpair | Pathway | Tissue | Disease Stage |
| Page: 1 |
Top |
Single-cell gene regulatory network inference analysis |
| Find out the significant the regulons (TFs) and the target genes of each regulon across cell types for different disease states |
| TF | Cell Type | Tissue | Disease Stage | Target Gene | RSS | Regulon Activity |
| ∗The dot plots of a searched regulon are shown for all cell subpopulations in each disease state of each tissue based on the regulon specific score inferred using pySCENIC and by calculating the average expression. |
| Page: 1 |
Top |
Somatic mutation of malignant transformation related genes |
| Annotation of somatic variants for genes involved in malignant transformation |
| Hugo Symbol | Variant Class | Variant Classification | dbSNP RS | HGVSc | HGVSp | HGVSp Short | SWISSPROT | BIOTYPE | SIFT | PolyPhen | Tumor Sample Barcode | Tissue | Histology | Sex | Age | Stage | Therapy Types | Drugs | Outcome |
| CRIP2 | SNV | Missense_Mutation | c.766C>G | p.Leu256Val | p.L256V | P52943 | protein_coding | deleterious(0.04) | probably_damaging(0.997) | TCGA-AR-A0TU-01 | Breast | breast invasive carcinoma | Female | <65 | I/II | Unspecific | Doxorubicin | SD | |
| CRIP2 | SNV | Missense_Mutation | novel | c.127N>A | p.Ala43Thr | p.A43T | P52943 | protein_coding | deleterious_low_confidence(0) | benign(0.006) | TCGA-2W-A8YY-01 | Cervix | cervical & endocervical cancer | Female | <65 | I/II | Chemotherapy | cisplatin | CR |
| CRIP2 | SNV | Missense_Mutation | rs374234792 | c.727N>A | p.Asp243Asn | p.D243N | P52943 | protein_coding | tolerated(0.08) | probably_damaging(0.999) | TCGA-A5-A2K7-01 | Endometrium | uterine corpus endometrioid carcinoma | Female | <65 | I/II | Chemotherapy | taxol | SD |
| CRIP2 | SNV | Missense_Mutation | novel | c.735N>T | p.Gln245His | p.Q245H | P52943 | protein_coding | deleterious(0.05) | probably_damaging(0.975) | TCGA-AX-A3G8-01 | Endometrium | uterine corpus endometrioid carcinoma | Female | >=65 | I/II | Unknown | Unknown | SD |
| CRIP2 | SNV | Missense_Mutation | novel | c.106N>T | p.Pro36Ser | p.P36S | P52943 | protein_coding | tolerated_low_confidence(0.09) | benign(0.007) | TCGA-FI-A2F4-01 | Endometrium | uterine corpus endometrioid carcinoma | Female | <65 | I/II | Unknown | Unknown | SD |
| CRIP2 | deletion | Frame_Shift_Del | rs782782227 | c.81delN | p.Arg30GlyfsTer63 | p.R30Gfs*63 | P52943 | protein_coding | TCGA-AX-A3G9-01 | Endometrium | uterine corpus endometrioid carcinoma | Female | <65 | III/IV | Chemotherapy | carboplatin | SD | ||
| CRIP2 | SNV | Missense_Mutation | novel | c.490N>T | p.Pro164Ser | p.P164S | P52943 | protein_coding | tolerated(0.07) | benign(0.012) | TCGA-DD-AAEB-01 | Liver | liver hepatocellular carcinoma | Male | <65 | I/II | Unknown | Unknown | SD |
| CRIP2 | SNV | Missense_Mutation | novel | c.793G>T | p.Gly265Cys | p.G265C | P52943 | protein_coding | deleterious(0) | probably_damaging(0.99) | TCGA-T1-A6J8-01 | Liver | liver hepatocellular carcinoma | Male | >=65 | I/II | Unknown | Unknown | SD |
| CRIP2 | SNV | Missense_Mutation | novel | c.631G>A | p.Glu211Lys | p.E211K | P52943 | protein_coding | deleterious(0) | probably_damaging(0.992) | TCGA-78-7155-01 | Lung | lung adenocarcinoma | Male | >=65 | I/II | Chemotherapy | carboplatin | PD |
| CRIP2 | SNV | Missense_Mutation | novel | c.268G>A | p.Glu90Lys | p.E90K | P52943 | protein_coding | deleterious(0) | probably_damaging(0.995) | TCGA-BR-7707-01 | Stomach | stomach adenocarcinoma | Female | >=65 | I/II | Unknown | Unknown | SD |
| Page: 1 2 |
Top |
Related drugs of malignant transformation related genes |
| Identification of chemicals and drugs interact with genes involved in malignant transfromation |
| (DGIdb 4.0) |
| Entrez ID | Symbol | Category | Interaction Types | Drug Claim Name | Drug Name | PMIDs |
| Page: 1 |

Copyright 2023-Present -The University of Texas Health Science Center at Houston |