| Tissue | Expression Dynamics | Abbreviation |
| Cervix | 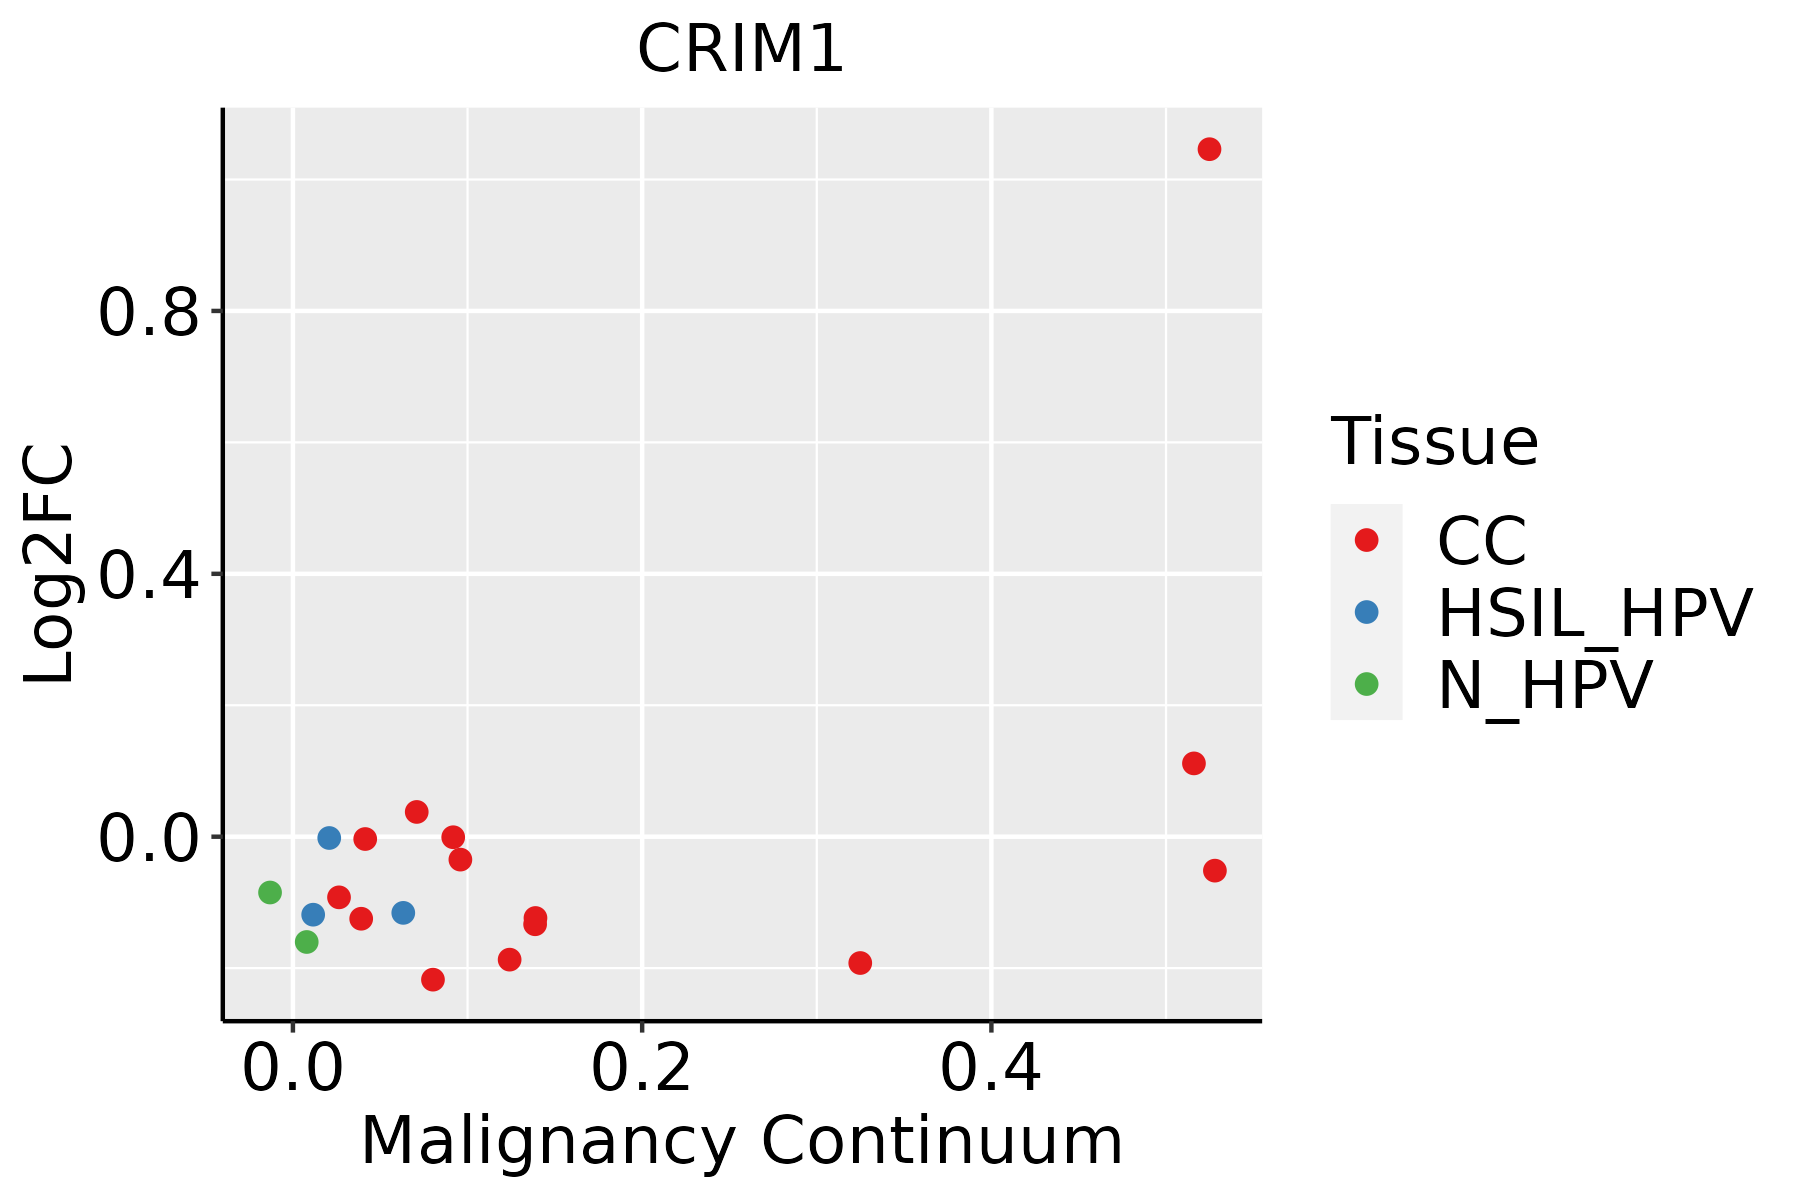 | CC: Cervix cancer |
| HSIL_HPV: HPV-infected high-grade squamous intraepithelial lesions |
| N_HPV: HPV-infected normal cervix |
| Colorectum (GSE201348) |  | FAP: Familial adenomatous polyposis |
| CRC: Colorectal cancer |
| Colorectum (HTA11) |  | AD: Adenomas |
| SER: Sessile serrated lesions |
| MSI-H: Microsatellite-high colorectal cancer |
| MSS: Microsatellite stable colorectal cancer |
| Endometrium | 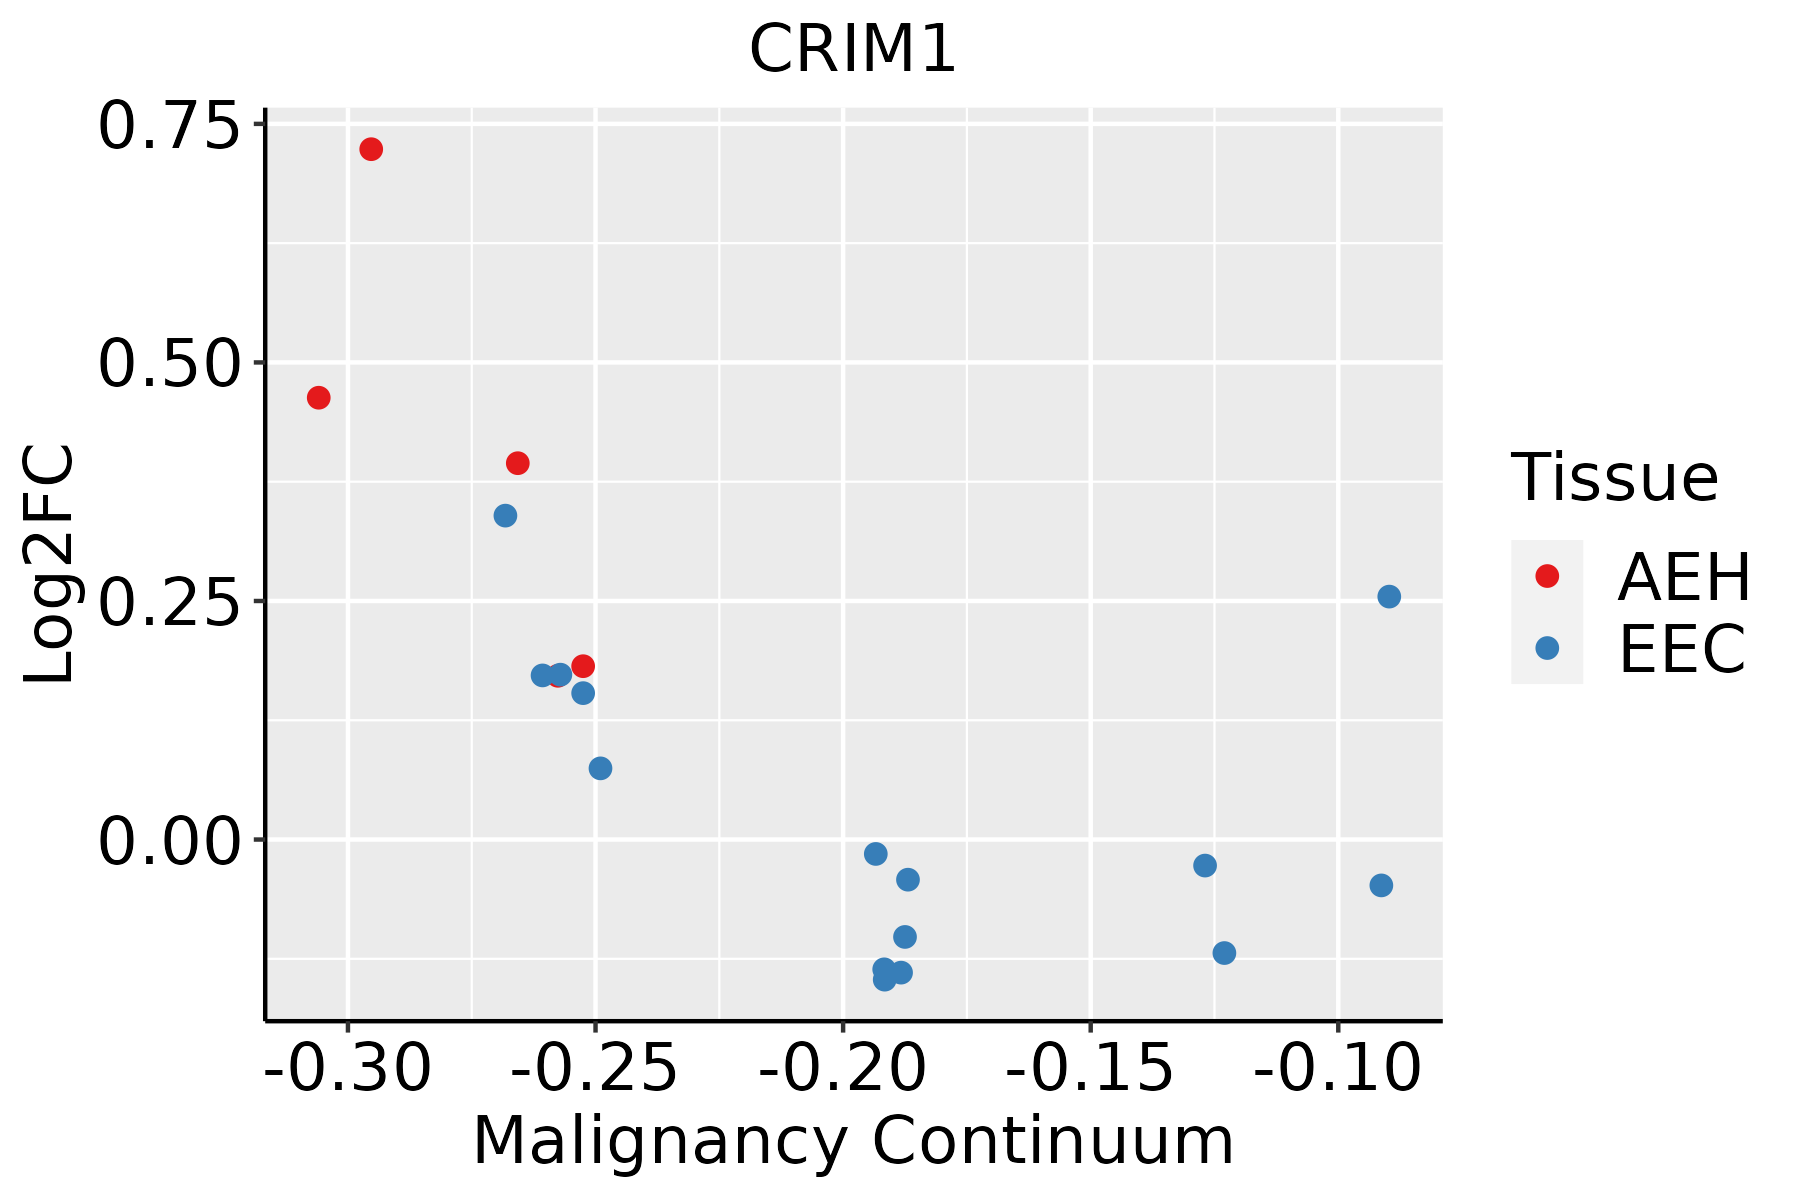 | AEH: Atypical endometrial hyperplasia |
| EEC: Endometrioid Cancer |
| Esophagus |  | ESCC: Esophageal squamous cell carcinoma |
| HGIN: High-grade intraepithelial neoplasias |
| LGIN: Low-grade intraepithelial neoplasias |
| Liver | 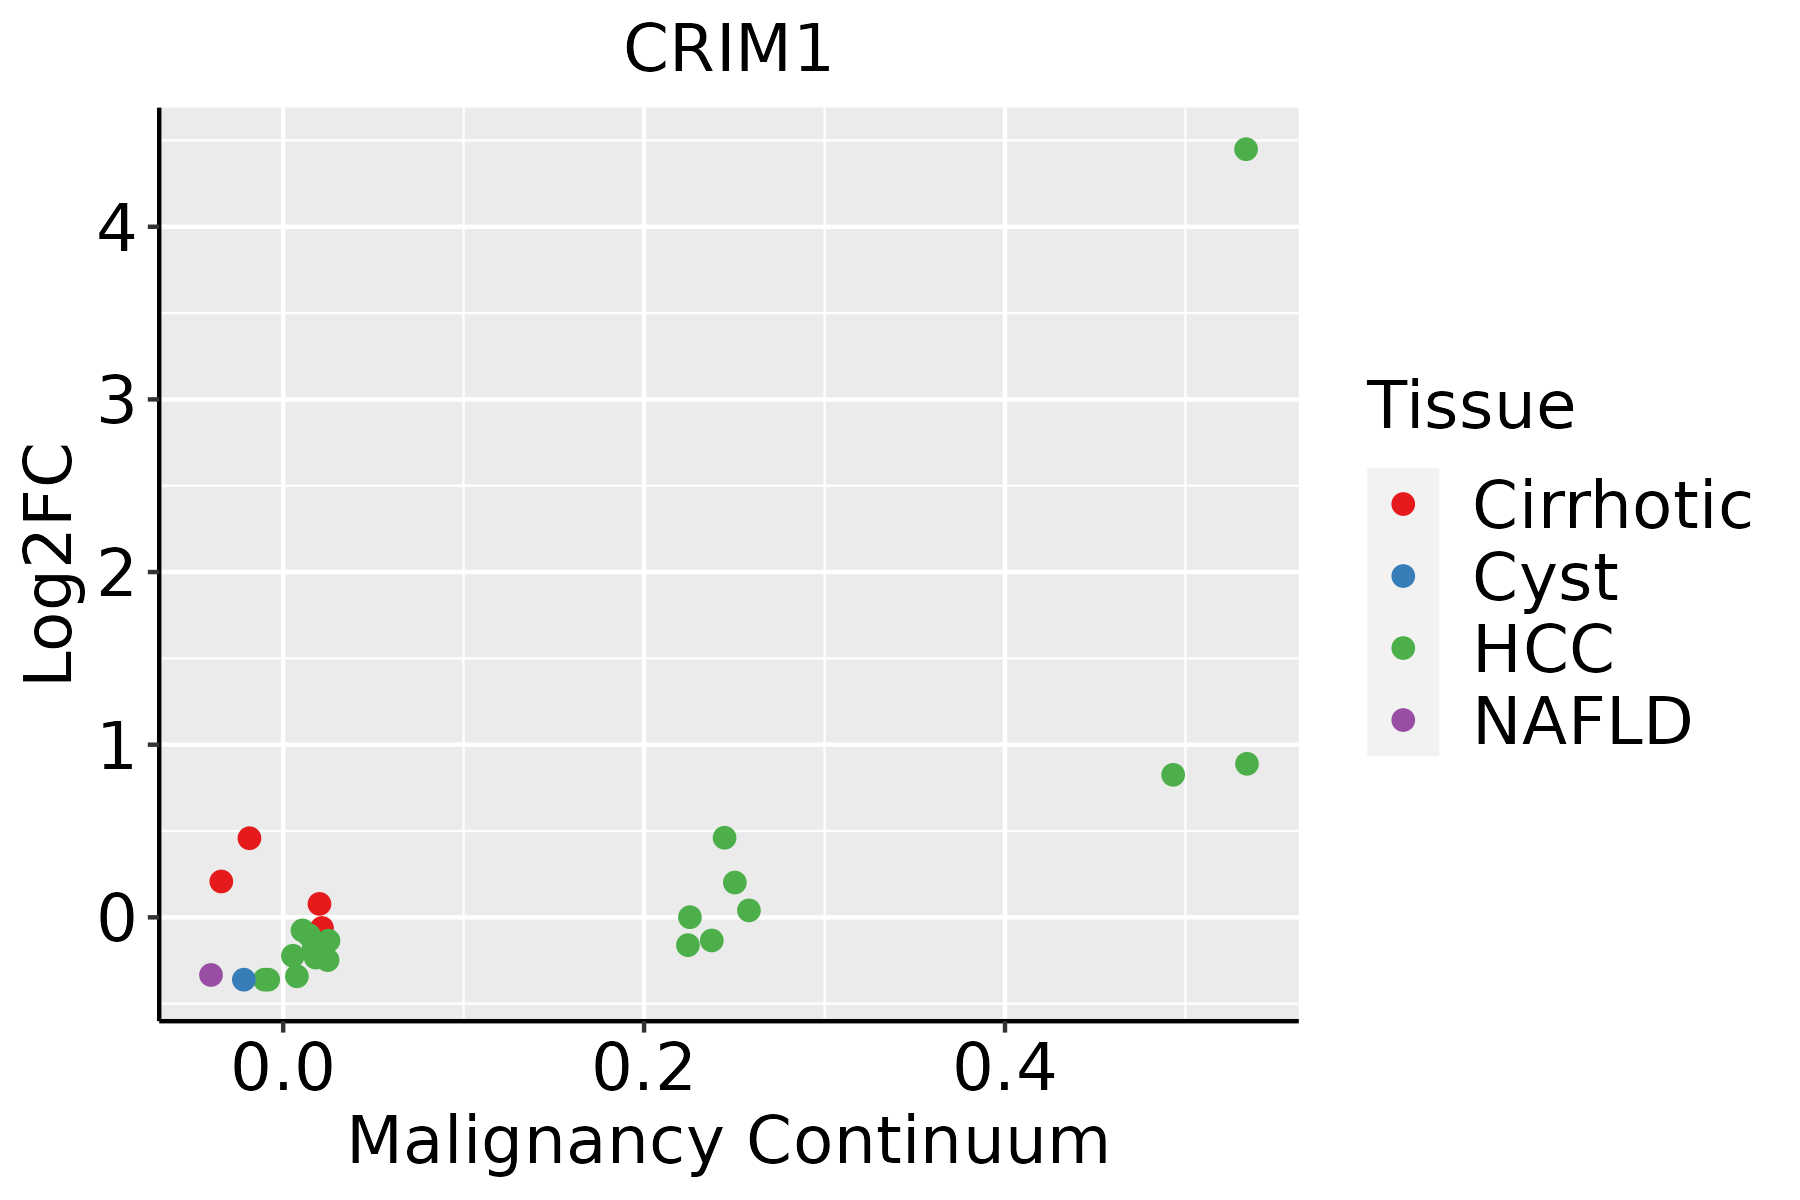 | HCC: Hepatocellular carcinoma |
| NAFLD: Non-alcoholic fatty liver disease |
| Lung | 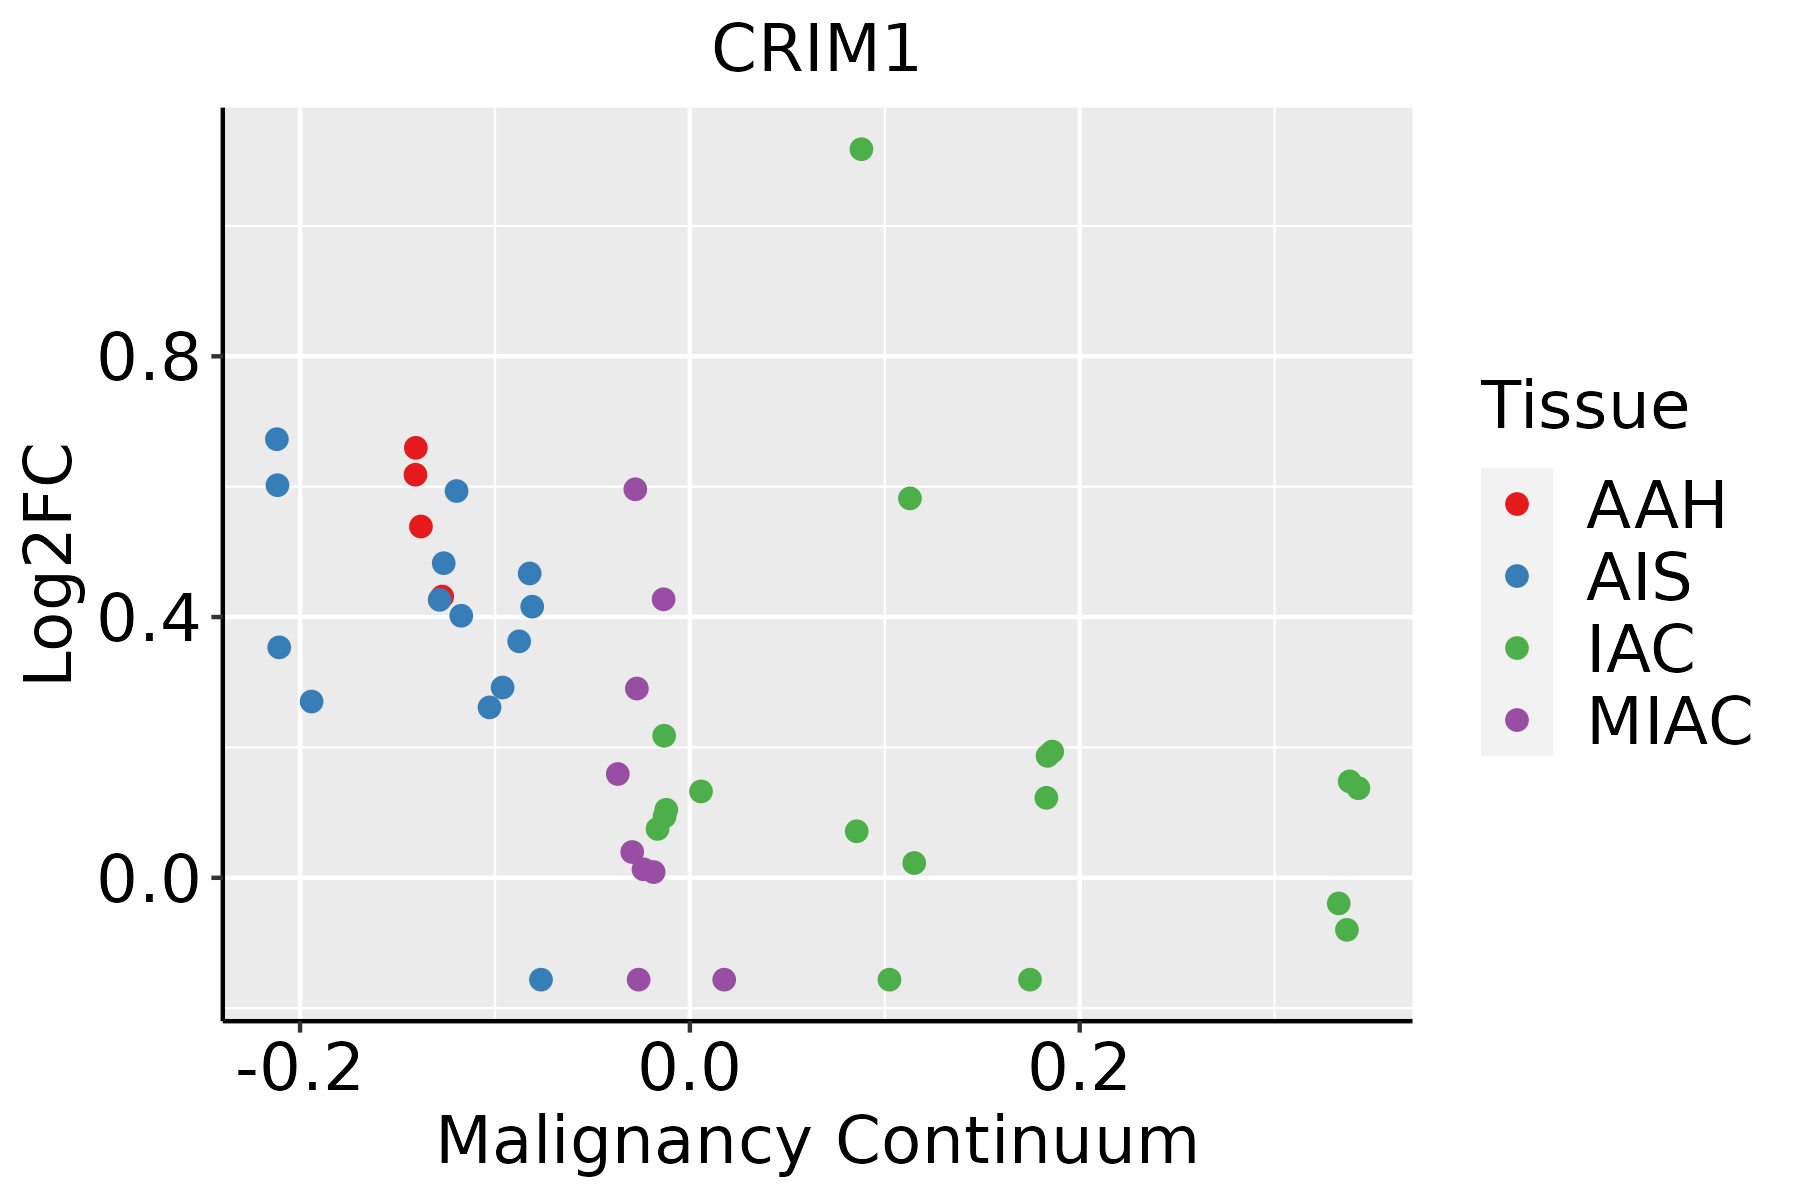 | AAH: Atypical adenomatous hyperplasia |
| AIS: Adenocarcinoma in situ |
| IAC: Invasive lung adenocarcinoma |
| MIA: Minimally invasive adenocarcinoma |
| Oral Cavity |  | EOLP: Erosive Oral lichen planus |
| LP: leukoplakia |
| NEOLP: Non-erosive oral lichen planus |
| OSCC: Oral squamous cell carcinoma |
| Prostate |  | BPH: Benign Prostatic Hyperplasia |
| Skin | 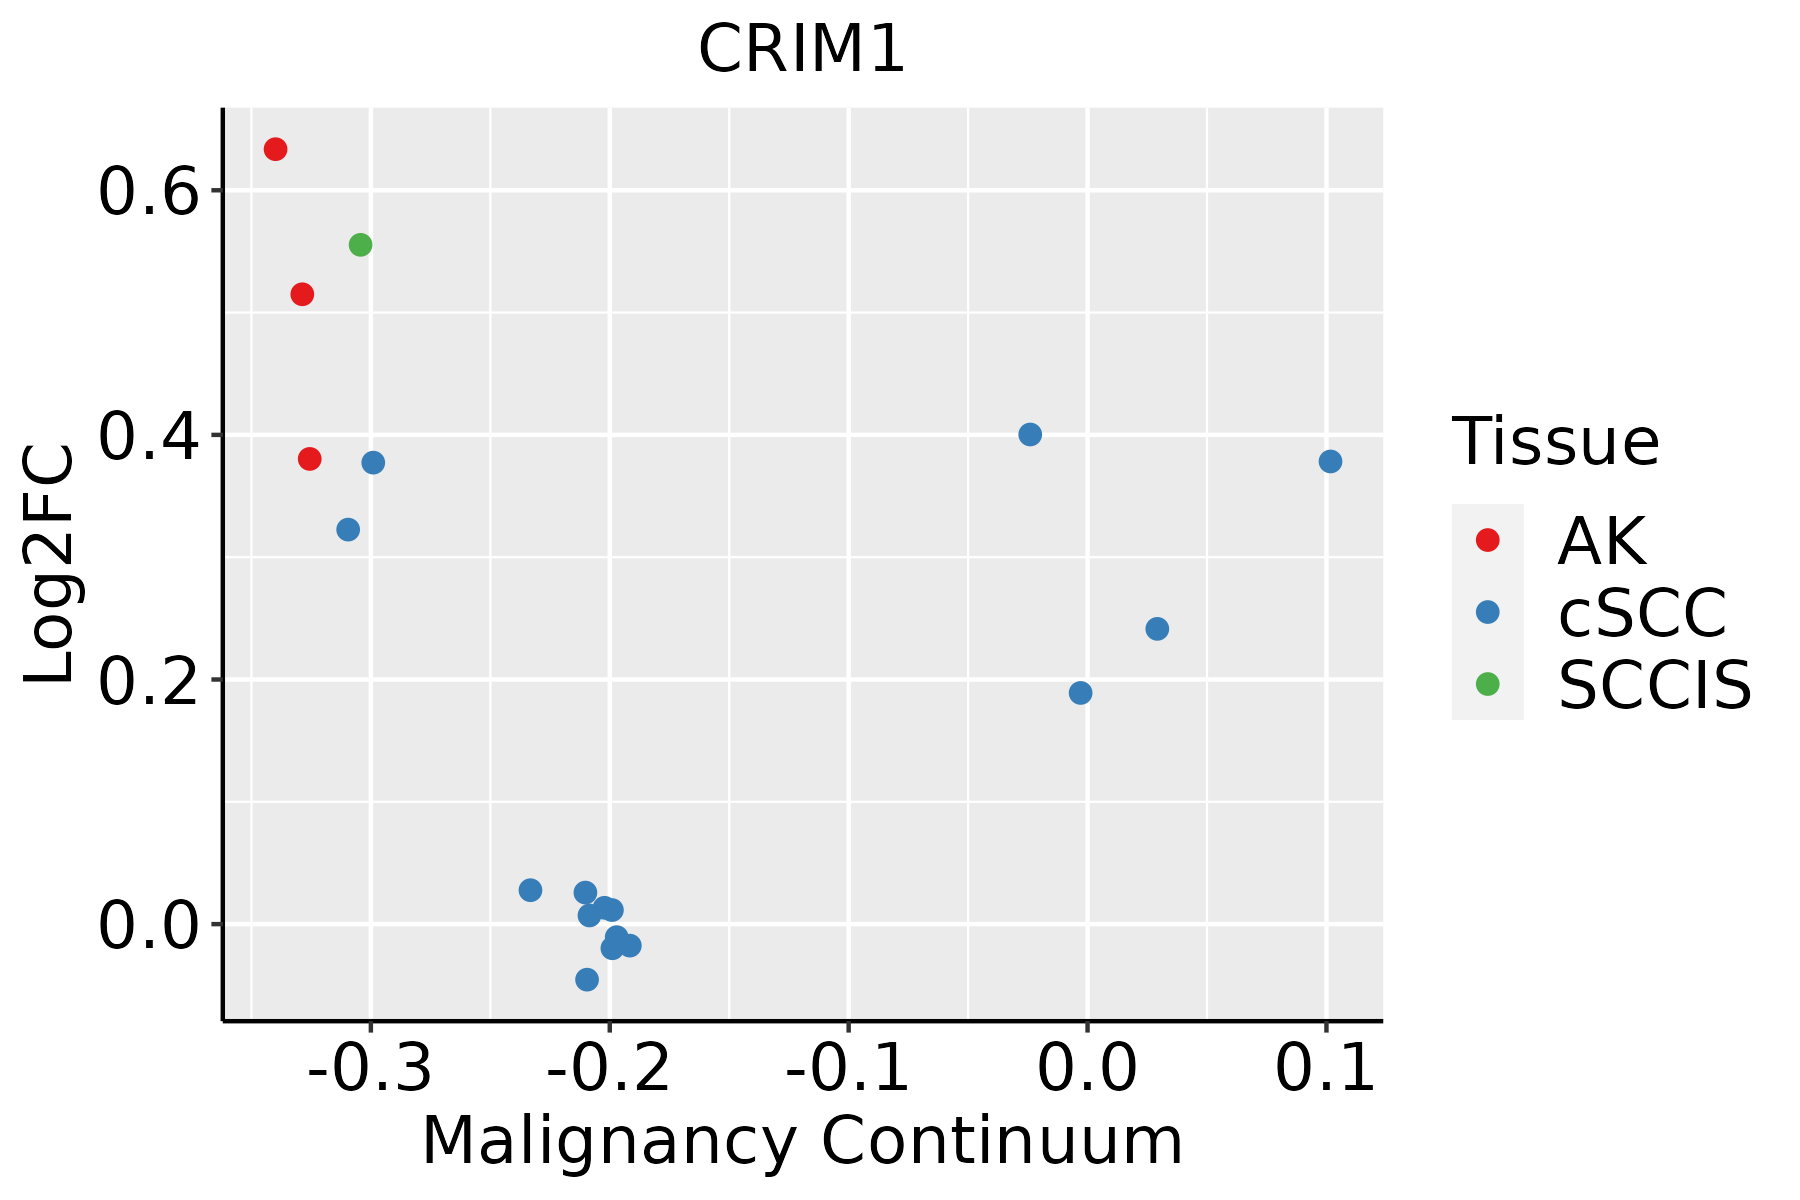 | AK: Actinic keratosis |
| cSCC: Cutaneous squamous cell carcinoma |
| SCCIS:squamous cell carcinoma in situ |
| Thyroid |  | ATC: Anaplastic thyroid cancer |
| HT: Hashimoto's thyroiditis |
| PTC: Papillary thyroid cancer |
| GO ID | Tissue | Disease Stage | Description | Gene Ratio | Bg Ratio | pvalue | p.adjust | Count |
| GO:005254710 | Cervix | CC | regulation of peptidase activity | 112/2311 | 461/18723 | 6.70e-13 | 3.08e-10 | 112 |
| GO:005254810 | Cervix | CC | regulation of endopeptidase activity | 103/2311 | 432/18723 | 1.89e-11 | 5.14e-09 | 103 |
| GO:004586110 | Cervix | CC | negative regulation of proteolysis | 80/2311 | 351/18723 | 2.88e-08 | 1.98e-06 | 80 |
| GO:00513469 | Cervix | CC | negative regulation of hydrolase activity | 81/2311 | 379/18723 | 4.27e-07 | 1.67e-05 | 81 |
| GO:00104669 | Cervix | CC | negative regulation of peptidase activity | 60/2311 | 262/18723 | 1.27e-06 | 4.34e-05 | 60 |
| GO:001095110 | Cervix | CC | negative regulation of endopeptidase activity | 56/2311 | 252/18723 | 7.43e-06 | 1.74e-04 | 56 |
| GO:00071786 | Cervix | CC | transmembrane receptor protein serine/threonine kinase signaling pathway | 67/2311 | 355/18723 | 2.39e-04 | 2.67e-03 | 67 |
| GO:00016497 | Cervix | CC | osteoblast differentiation | 47/2311 | 229/18723 | 2.88e-04 | 3.11e-03 | 47 |
| GO:0045667 | Cervix | CC | regulation of osteoblast differentiation | 29/2311 | 132/18723 | 1.32e-03 | 1.05e-02 | 29 |
| GO:00015037 | Cervix | CC | ossification | 71/2311 | 408/18723 | 1.67e-03 | 1.28e-02 | 71 |
| GO:005254824 | Cervix | N_HPV | regulation of endopeptidase activity | 36/534 | 432/18723 | 9.74e-09 | 1.72e-06 | 36 |
| GO:005254724 | Cervix | N_HPV | regulation of peptidase activity | 36/534 | 461/18723 | 5.15e-08 | 5.59e-06 | 36 |
| GO:004586124 | Cervix | N_HPV | negative regulation of proteolysis | 27/534 | 351/18723 | 3.27e-06 | 1.36e-04 | 27 |
| GO:001095123 | Cervix | N_HPV | negative regulation of endopeptidase activity | 21/534 | 252/18723 | 1.21e-05 | 4.05e-04 | 21 |
| GO:001046623 | Cervix | N_HPV | negative regulation of peptidase activity | 21/534 | 262/18723 | 2.18e-05 | 6.16e-04 | 21 |
| GO:005134624 | Cervix | N_HPV | negative regulation of hydrolase activity | 25/534 | 379/18723 | 9.66e-05 | 1.97e-03 | 25 |
| GO:000717821 | Cervix | N_HPV | transmembrane receptor protein serine/threonine kinase signaling pathway | 22/534 | 355/18723 | 5.85e-04 | 7.73e-03 | 22 |
| GO:000164913 | Cervix | N_HPV | osteoblast differentiation | 14/534 | 229/18723 | 6.22e-03 | 4.28e-02 | 14 |
| GO:000150312 | Cervix | N_HPV | ossification | 21/534 | 408/18723 | 6.98e-03 | 4.61e-02 | 21 |
| GO:0052547 | Colorectum | AD | regulation of peptidase activity | 137/3918 | 461/18723 | 4.12e-06 | 1.12e-04 | 137 |
| Hugo Symbol | Variant Class | Variant Classification | dbSNP RS | HGVSc | HGVSp | HGVSp Short | SWISSPROT | BIOTYPE | SIFT | PolyPhen | Tumor Sample Barcode | Tissue | Histology | Sex | Age | Stage | Therapy Types | Drugs | Outcome |
| CRIM1 | SNV | Missense_Mutation | | c.565G>A | p.Glu189Lys | p.E189K | Q9NZV1 | protein_coding | tolerated(0.13) | benign(0.432) | TCGA-A8-A06Q-01 | Breast | breast invasive carcinoma | Female | <65 | III/IV | Unknown | Unknown | SD |
| CRIM1 | SNV | Missense_Mutation | | c.1595G>T | p.Cys532Phe | p.C532F | Q9NZV1 | protein_coding | deleterious(0) | probably_damaging(0.999) | TCGA-AN-A0FS-01 | Breast | breast invasive carcinoma | Female | <65 | I/II | Unknown | Unknown | SD |
| CRIM1 | SNV | Missense_Mutation | | c.1904N>A | p.Arg635Gln | p.R635Q | Q9NZV1 | protein_coding | tolerated(0.16) | possibly_damaging(0.667) | TCGA-BH-A0HI-01 | Breast | breast invasive carcinoma | Female | >=65 | I/II | Hormone Therapy | arimidex | SD |
| CRIM1 | SNV | Missense_Mutation | | c.1061N>A | p.Cys354Tyr | p.C354Y | Q9NZV1 | protein_coding | deleterious(0) | probably_damaging(0.999) | TCGA-E2-A14Z-01 | Breast | breast invasive carcinoma | Female | <65 | I/II | Hormone Therapy | arimidex | PD |
| CRIM1 | SNV | Missense_Mutation | | c.1837N>A | p.Gly613Ser | p.G613S | Q9NZV1 | protein_coding | deleterious(0.01) | probably_damaging(1) | TCGA-EW-A1P6-01 | Breast | breast invasive carcinoma | Female | <65 | I/II | Chemotherapy | cyclophosphamide | SD |
| CRIM1 | SNV | Missense_Mutation | novel | c.337A>C | p.Asn113His | p.N113H | Q9NZV1 | protein_coding | tolerated(0.17) | benign(0.259) | TCGA-OL-A66I-01 | Breast | breast invasive carcinoma | Female | <65 | I/II | Chemotherapy | adriamycin | CR |
| CRIM1 | insertion | Frame_Shift_Ins | novel | c.1539_1540insAGATTTGTATTTTATAAGAATTTGTATTTATTCACTCA | p.Leu514ArgfsTer14 | p.L514Rfs*14 | Q9NZV1 | protein_coding | | | TCGA-A8-A07J-01 | Breast | breast invasive carcinoma | Female | <65 | I/II | Chemotherapy | 5-fluorouracil | CR |
| CRIM1 | insertion | Nonsense_Mutation | novel | c.1592_1593insCTCACACCTGTAACCCCAGCACTT | p.Glu531delinsAspSerHisLeuTerProGlnHisLeu | p.E531delinsDSHL*PQHL | Q9NZV1 | protein_coding | | | TCGA-AN-A0FX-01 | Breast | breast invasive carcinoma | Female | <65 | I/II | Unknown | Unknown | SD |
| CRIM1 | deletion | In_Frame_Del | novel | c.343_366delNNNNNNNNNNNNNNNNNNNNNNNN | p.Thr115_Phe122del | p.T115_F122del | Q9NZV1 | protein_coding | | | TCGA-E2-A14R-01 | Breast | breast invasive carcinoma | Female | <65 | I/II | Chemotherapy | doxorubicin | PD |
| CRIM1 | deletion | Frame_Shift_Del | novel | c.645delN | p.Gly216AlafsTer12 | p.G216Afs*12 | Q9NZV1 | protein_coding | | | TCGA-EW-A2FV-01 | Breast | breast invasive carcinoma | Female | <65 | III/IV | Chemotherapy | docetaxel | SD |


