
|
|||||
|
 | |
| |
| |
| |
| |
| |
|
Gene: CREM |
Gene summary for CREM |
| Gene information | Species | Human | Gene symbol | CREM | Gene ID | 1390 |
| Gene name | cAMP responsive element modulator | |
| Gene Alias | CREM-2 | |
| Cytomap | 10p11.21 | |
| Gene Type | protein-coding | GO ID | GO:0000003 | UniProtAcc | Q03060 |
Top |
Malignant transformation analysis |
| Identification of the aberrant gene expression in precancerous and cancerous lesions by comparing the gene expression of stem-like cells in diseased tissues with normal stem cells |
| Entrez ID | Symbol | Replicates | Species | Organ | Tissue | Adj P-value | Log2FC | Malignancy |
| 1390 | CREM | LZE2T | Human | Esophagus | ESCC | 1.56e-04 | 5.68e-01 | 0.082 |
| 1390 | CREM | LZE4T | Human | Esophagus | ESCC | 1.36e-08 | 6.86e-01 | 0.0811 |
| 1390 | CREM | LZE7T | Human | Esophagus | ESCC | 2.57e-03 | 8.20e-01 | 0.0667 |
| 1390 | CREM | LZE8T | Human | Esophagus | ESCC | 2.42e-03 | 2.92e-01 | 0.067 |
| 1390 | CREM | LZE24T | Human | Esophagus | ESCC | 3.99e-16 | 3.70e-01 | 0.0596 |
| 1390 | CREM | LZE6T | Human | Esophagus | ESCC | 9.47e-12 | 1.29e+00 | 0.0845 |
| 1390 | CREM | P1T-E | Human | Esophagus | ESCC | 6.76e-03 | 1.08e-01 | 0.0875 |
| 1390 | CREM | P2T-E | Human | Esophagus | ESCC | 4.14e-15 | 2.66e-01 | 0.1177 |
| 1390 | CREM | P4T-E | Human | Esophagus | ESCC | 9.91e-12 | 3.85e-01 | 0.1323 |
| 1390 | CREM | P5T-E | Human | Esophagus | ESCC | 4.97e-06 | 1.93e-01 | 0.1327 |
| 1390 | CREM | P8T-E | Human | Esophagus | ESCC | 1.37e-13 | 2.00e-01 | 0.0889 |
| 1390 | CREM | P9T-E | Human | Esophagus | ESCC | 5.74e-11 | 1.92e-01 | 0.1131 |
| 1390 | CREM | P10T-E | Human | Esophagus | ESCC | 2.45e-11 | 7.71e-02 | 0.116 |
| 1390 | CREM | P11T-E | Human | Esophagus | ESCC | 7.14e-16 | 7.87e-01 | 0.1426 |
| 1390 | CREM | P12T-E | Human | Esophagus | ESCC | 4.98e-11 | 2.52e-01 | 0.1122 |
| 1390 | CREM | P15T-E | Human | Esophagus | ESCC | 5.81e-10 | 6.66e-02 | 0.1149 |
| 1390 | CREM | P16T-E | Human | Esophagus | ESCC | 6.06e-17 | 1.56e-01 | 0.1153 |
| 1390 | CREM | P17T-E | Human | Esophagus | ESCC | 2.10e-03 | 5.29e-02 | 0.1278 |
| 1390 | CREM | P20T-E | Human | Esophagus | ESCC | 4.51e-08 | 1.10e-01 | 0.1124 |
| 1390 | CREM | P21T-E | Human | Esophagus | ESCC | 9.11e-28 | 4.42e-01 | 0.1617 |
| Page: 1 2 3 4 5 6 7 |
| Tissue | Expression Dynamics | Abbreviation |
| Esophagus |  | ESCC: Esophageal squamous cell carcinoma |
| HGIN: High-grade intraepithelial neoplasias | ||
| LGIN: Low-grade intraepithelial neoplasias | ||
| Liver |  | HCC: Hepatocellular carcinoma |
| NAFLD: Non-alcoholic fatty liver disease | ||
| Oral Cavity | 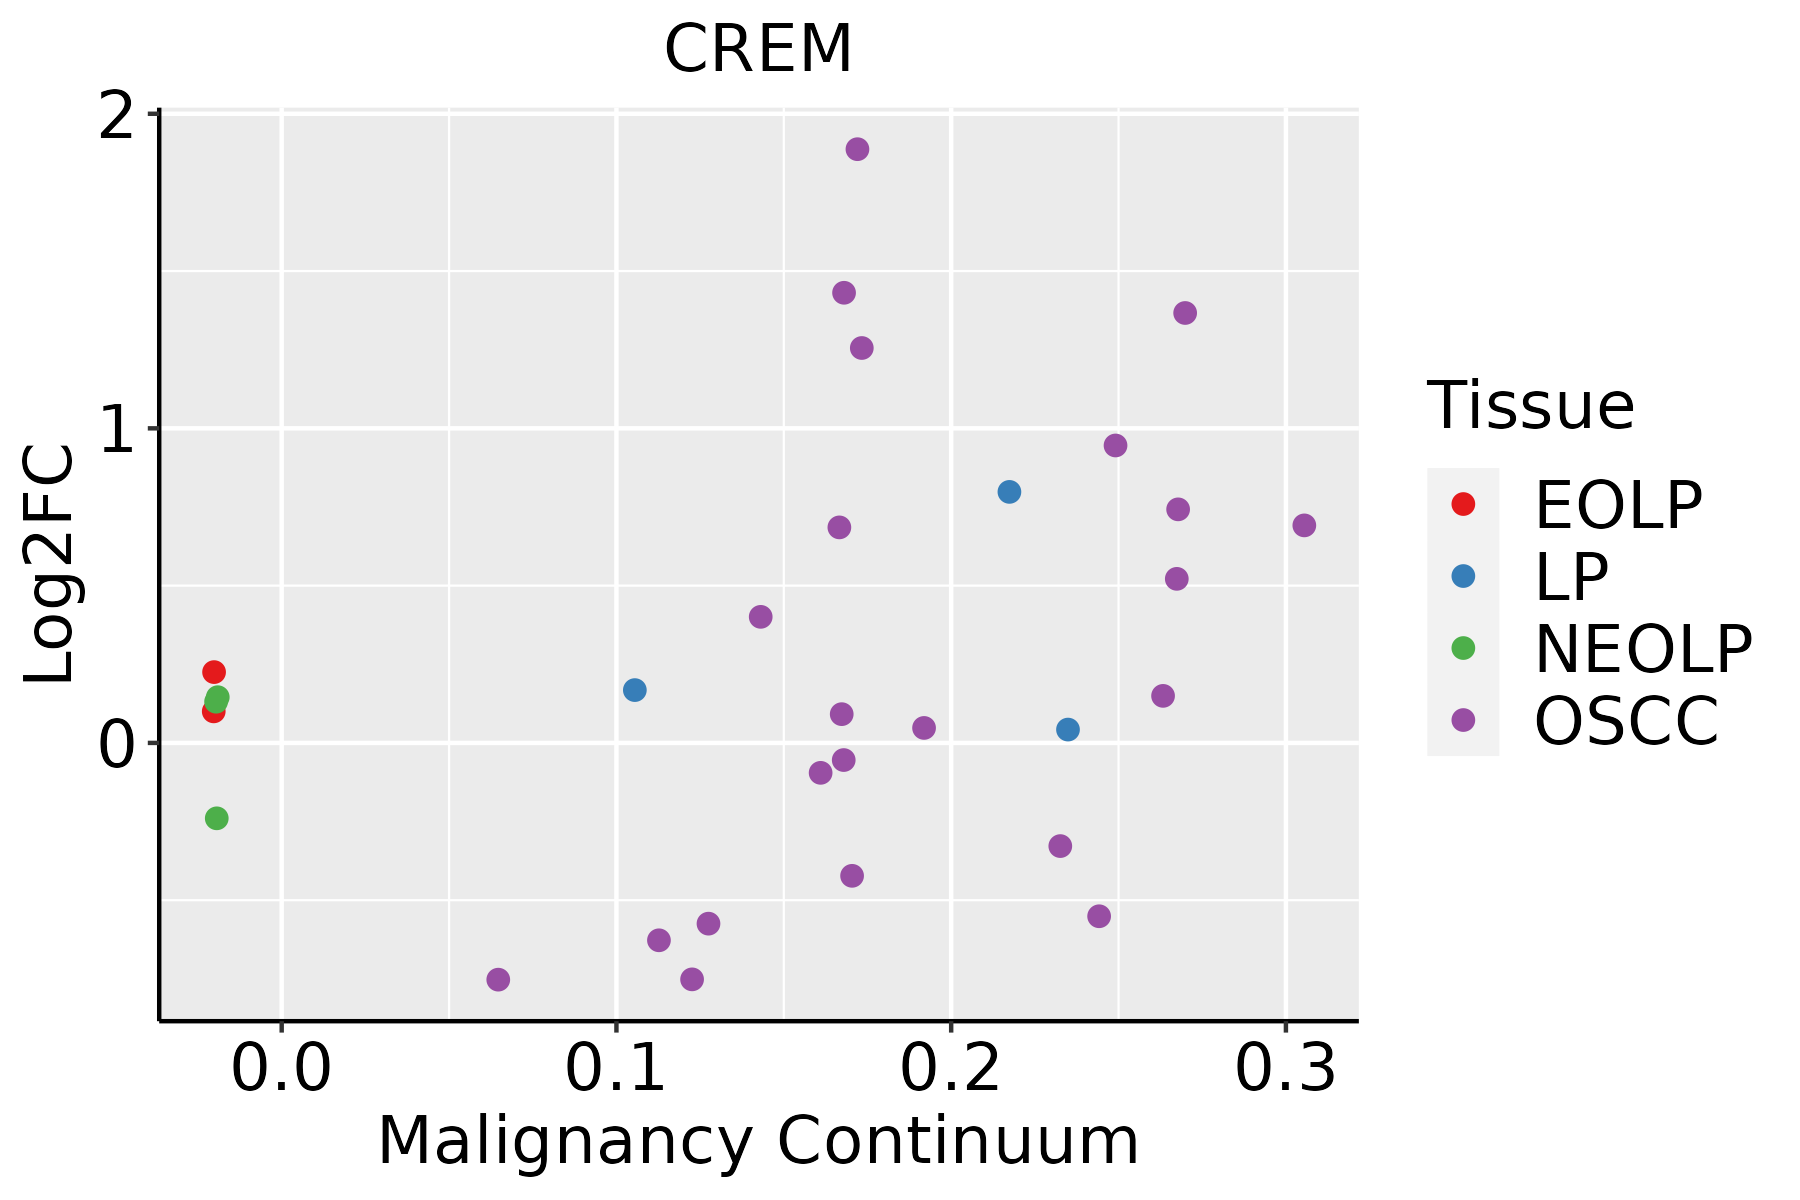 | EOLP: Erosive Oral lichen planus |
| LP: leukoplakia | ||
| NEOLP: Non-erosive oral lichen planus | ||
| OSCC: Oral squamous cell carcinoma | ||
| Prostate | 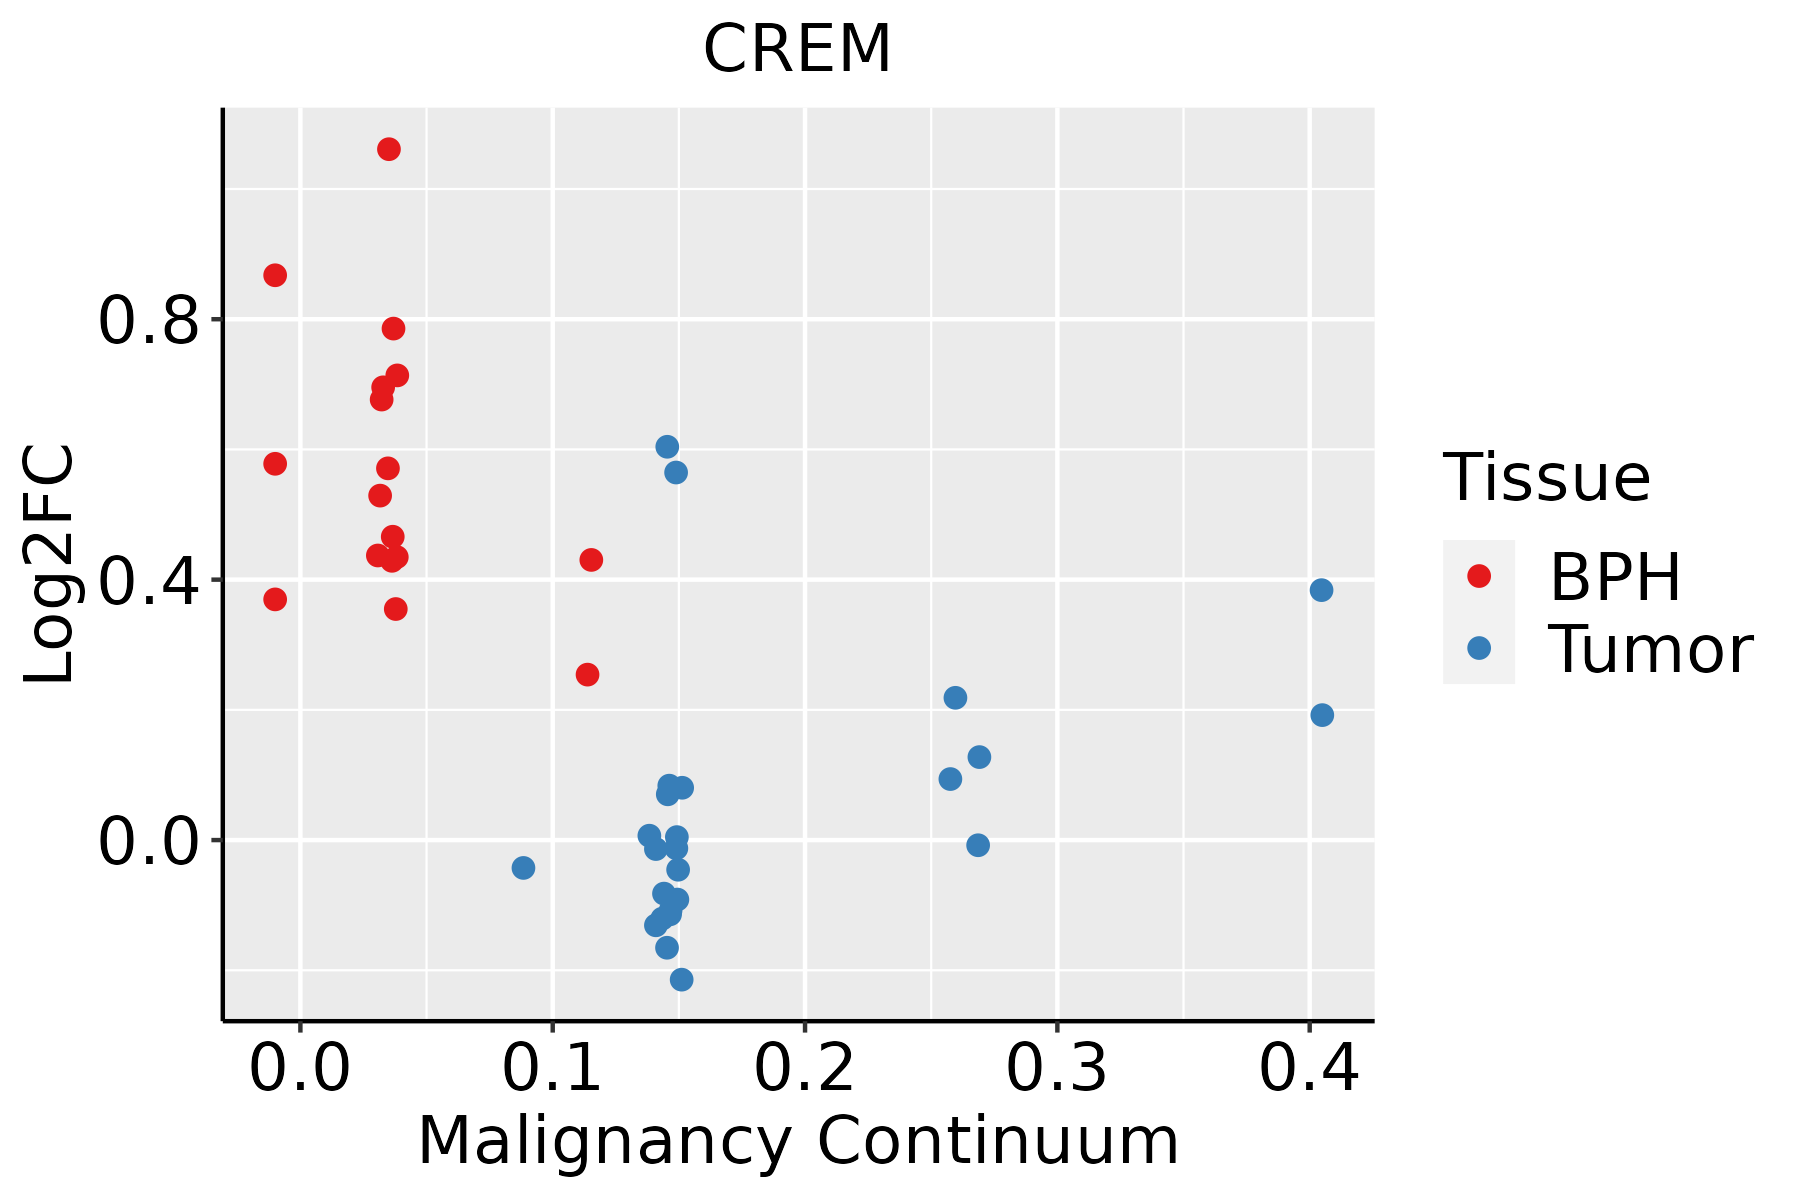 | BPH: Benign Prostatic Hyperplasia |
| Thyroid |  | ATC: Anaplastic thyroid cancer |
| HT: Hashimoto's thyroiditis | ||
| PTC: Papillary thyroid cancer |
| ∗log2FC in expression of this searched gene in stem-like cells from each diseased tissue sample relative to stem-like cells in normal samples in each tissue plotted against the malignancy continuum. Samples are colored based on if they are from different disease stage. |
Top |
Malignant transformation related pathway analysis |
| Find out the enriched GO biological processes and KEGG pathways involved in transition from healthy to precancer to cancer |
| Tissue | Disease Stage | Enriched GO biological Processes |
| Colorectum | AD |  |
| Colorectum | SER |  |
| Colorectum | MSS |  |
| Colorectum | MSI-H |  |
| Colorectum | FAP |  |
| ∗Top 15 enriched GO BP terms are showed in the bar plot of each disease state in each tissue. Each row represents a significant GO biological process which is colored according to the -log10(p.adjust). |
| Page: 1 2 3 4 5 6 7 8 9 |
| GO ID | Tissue | Disease Stage | Description | Gene Ratio | Bg Ratio | pvalue | p.adjust | Count |
| GO:004851118 | Esophagus | ESCC | rhythmic process | 164/8552 | 298/18723 | 6.80e-04 | 3.57e-03 | 164 |
| GO:00485115 | Liver | NAFLD | rhythmic process | 56/1882 | 298/18723 | 3.03e-06 | 1.23e-04 | 56 |
| GO:004851111 | Liver | Cirrhotic | rhythmic process | 103/4634 | 298/18723 | 8.47e-05 | 9.19e-04 | 103 |
| GO:004851121 | Liver | HCC | rhythmic process | 156/7958 | 298/18723 | 3.54e-04 | 2.46e-03 | 156 |
| GO:004851116 | Oral cavity | OSCC | rhythmic process | 157/7305 | 298/18723 | 1.00e-06 | 1.36e-05 | 157 |
| GO:004851117 | Oral cavity | EOLP | rhythmic process | 69/2218 | 298/18723 | 2.68e-08 | 1.11e-06 | 69 |
| GO:004851122 | Oral cavity | NEOLP | rhythmic process | 60/2005 | 298/18723 | 1.02e-06 | 2.72e-05 | 60 |
| GO:004851110 | Prostate | BPH | rhythmic process | 96/3107 | 298/18723 | 1.88e-11 | 1.31e-09 | 96 |
| GO:004851115 | Prostate | Tumor | rhythmic process | 99/3246 | 298/18723 | 1.65e-11 | 1.21e-09 | 99 |
| GO:004851120 | Thyroid | HT | rhythmic process | 41/1272 | 298/18723 | 1.26e-05 | 3.27e-04 | 41 |
| GO:0048511111 | Thyroid | PTC | rhythmic process | 131/5968 | 298/18723 | 7.06e-06 | 8.33e-05 | 131 |
| GO:004851124 | Thyroid | ATC | rhythmic process | 141/6293 | 298/18723 | 5.58e-07 | 7.93e-06 | 141 |
| Page: 1 |
| Pathway ID | Tissue | Disease Stage | Description | Gene Ratio | Bg Ratio | pvalue | p.adjust | qvalue | Count |
| Page: 1 |
Top |
Cell-cell communication analysis |
| Identification of potential cell-cell interactions between two cell types and their ligand-receptor pairs for different disease states |
| Ligand | Receptor | LRpair | Pathway | Tissue | Disease Stage |
| Page: 1 |
Top |
Single-cell gene regulatory network inference analysis |
| Find out the significant the regulons (TFs) and the target genes of each regulon across cell types for different disease states |
| TF | Cell Type | Tissue | Disease Stage | Target Gene | RSS | Regulon Activity |
| CREM | STM | Cervix | HSIL_HPV | SELENOK,CXCR4,TRBC2, etc. | 2.45e-01 |  |
| CREM | STM | Cervix | N_HPV | SELENOK,CXCR4,TRBC2, etc. | 4.36e-01 |  |
| CREM | KER | Cervix | N_HPV | SELENOK,CXCR4,TRBC2, etc. | 2.20e-01 | |
| CREM | AT2L | Lung | AIS | SRGN,CXCR4,ZNF331, etc. | 6.54e-01 |  |
| CREM | STM | Oral cavity | EOLP | SRGN,MT1A,CD3D, etc. | 8.11e-01 |  |
| CREM | ACINAR | Pancreas | PDAC | SRGN,SARAF,SELENOK, etc. | 2.31e-01 |  |
| CREM | CD4TN | Pancreas | PDAC | CXCR4,LINC00513,LINC-PINT, etc. | 2.04e-01 | |
| CREM | CD8TEX | Pancreas | PDAC | CXCR4,LINC00513,LINC-PINT, etc. | 1.09e-01 | |
| CREM | ICAF | Stomach | Healthy | SELK,MEDAG,LINC00152, etc. | 7.46e-01 |  |
| CREM | PTC | Thyroid | ADJ | IGHG2,CD79A,CCR7, etc. | 3.19e-01 |  |
| ∗The dot plots of a searched regulon are shown for all cell subpopulations in each disease state of each tissue based on the regulon specific score inferred using pySCENIC and by calculating the average expression. |
| Page: 1 2 |
Top |
Somatic mutation of malignant transformation related genes |
| Annotation of somatic variants for genes involved in malignant transformation |
| Hugo Symbol | Variant Class | Variant Classification | dbSNP RS | HGVSc | HGVSp | HGVSp Short | SWISSPROT | BIOTYPE | SIFT | PolyPhen | Tumor Sample Barcode | Tissue | Histology | Sex | Age | Stage | Therapy Types | Drugs | Outcome |
| CREM | SNV | Missense_Mutation | c.835N>G | p.Gln279Glu | p.Q279E | Q03060 | protein_coding | deleterious(0) | probably_damaging(0.989) | TCGA-BH-A0BZ-01 | Breast | breast invasive carcinoma | Female | <65 | III/IV | Chemotherapy | doxorubicin | CR | |
| CREM | SNV | Missense_Mutation | novel | c.608N>T | p.Gly203Val | p.G203V | Q03060 | protein_coding | deleterious(0) | probably_damaging(1) | TCGA-OL-A5RW-01 | Breast | breast invasive carcinoma | Female | <65 | I/II | Chemotherapy | adriamycin | CR |
| CREM | SNV | Missense_Mutation | c.786N>T | p.Lys262Asn | p.K262N | Q03060 | protein_coding | deleterious(0) | probably_damaging(0.999) | TCGA-AA-3510-01 | Colorectum | colon adenocarcinoma | Male | >=65 | I/II | Unknown | Unknown | SD | |
| CREM | SNV | Missense_Mutation | c.647N>T | p.Ala216Val | p.A216V | Q03060 | protein_coding | tolerated(0.07) | benign(0.304) | TCGA-AA-3864-01 | Colorectum | colon adenocarcinoma | Male | >=65 | I/II | Unknown | Unknown | SD | |
| CREM | SNV | Missense_Mutation | novel | c.118G>A | p.Ala40Thr | p.A40T | Q03060 | protein_coding | deleterious_low_confidence(0.04) | possibly_damaging(0.769) | TCGA-AA-3947-01 | Colorectum | colon adenocarcinoma | Female | <65 | I/II | Unknown | Unknown | SD |
| CREM | SNV | Missense_Mutation | novel | c.59N>G | p.Glu20Gly | p.E20G | Q03060 | protein_coding | deleterious_low_confidence(0.04) | benign(0.341) | TCGA-AA-3984-01 | Colorectum | colon adenocarcinoma | Female | <65 | I/II | Unknown | Unknown | SD |
| CREM | SNV | Missense_Mutation | novel | c.413C>T | p.Ala138Val | p.A138V | Q03060 | protein_coding | tolerated(0.07) | benign(0.346) | TCGA-DM-A1D8-01 | Colorectum | colon adenocarcinoma | Female | <65 | III/IV | Unknown | Unknown | SD |
| CREM | SNV | Missense_Mutation | c.848N>A | p.Leu283His | p.L283H | Q03060 | protein_coding | deleterious(0) | probably_damaging(1) | TCGA-EI-6513-01 | Colorectum | rectum adenocarcinoma | Male | <65 | III/IV | Unknown | Unknown | SD | |
| CREM | SNV | Missense_Mutation | novel | c.186N>T | p.Glu62Asp | p.E62D | Q03060 | protein_coding | tolerated(0.15) | benign(0.358) | TCGA-A5-A0G2-01 | Endometrium | uterine corpus endometrioid carcinoma | Female | <65 | III/IV | Unknown | Unknown | SD |
| CREM | SNV | Missense_Mutation | novel | c.147T>A | p.Asn49Lys | p.N49K | Q03060 | protein_coding | tolerated(0.2) | benign(0.096) | TCGA-AJ-A23O-01 | Endometrium | uterine corpus endometrioid carcinoma | Female | >=65 | I/II | Unknown | Unknown | SD |
| Page: 1 2 3 |
Top |
Related drugs of malignant transformation related genes |
| Identification of chemicals and drugs interact with genes involved in malignant transfromation |
| (DGIdb 4.0) |
| Entrez ID | Symbol | Category | Interaction Types | Drug Claim Name | Drug Name | PMIDs |
| Page: 1 |

Copyright 2023-Present -The University of Texas Health Science Center at Houston |