
|
|||||
|
 | |
| |
| |
| |
| |
| |
|
Gene: CRELD2 |
Gene summary for CRELD2 |
| Gene information | Species | Human | Gene symbol | CRELD2 | Gene ID | 79174 |
| Gene name | cysteine rich with EGF like domains 2 | |
| Gene Alias | CRELD2 | |
| Cytomap | 22q13.33 | |
| Gene Type | protein-coding | GO ID | GO:0005575 | UniProtAcc | Q6UXH1 |
Top |
Malignant transformation analysis |
| Identification of the aberrant gene expression in precancerous and cancerous lesions by comparing the gene expression of stem-like cells in diseased tissues with normal stem cells |
| Entrez ID | Symbol | Replicates | Species | Organ | Tissue | Adj P-value | Log2FC | Malignancy |
| 79174 | CRELD2 | HTA11_3410_2000001011 | Human | Colorectum | AD | 6.11e-05 | 1.44e-01 | 0.0155 |
| 79174 | CRELD2 | HTA11_2487_2000001011 | Human | Colorectum | SER | 1.68e-08 | 3.12e-01 | -0.1808 |
| 79174 | CRELD2 | HTA11_78_2000001011 | Human | Colorectum | AD | 2.26e-02 | 1.56e-01 | -0.1088 |
| 79174 | CRELD2 | HTA11_347_2000001011 | Human | Colorectum | AD | 1.18e-09 | 2.15e-01 | -0.1954 |
| 79174 | CRELD2 | HTA11_411_2000001011 | Human | Colorectum | SER | 7.97e-07 | 5.49e-01 | -0.2602 |
| 79174 | CRELD2 | HTA11_2112_2000001011 | Human | Colorectum | SER | 8.80e-06 | 4.32e-01 | -0.2196 |
| 79174 | CRELD2 | HTA11_3361_2000001011 | Human | Colorectum | AD | 3.41e-05 | 2.99e-01 | -0.1207 |
| 79174 | CRELD2 | HTA11_83_2000001011 | Human | Colorectum | SER | 8.56e-08 | 2.89e-01 | -0.1526 |
| 79174 | CRELD2 | HTA11_696_2000001011 | Human | Colorectum | AD | 3.13e-21 | 5.52e-01 | -0.1464 |
| 79174 | CRELD2 | HTA11_866_2000001011 | Human | Colorectum | AD | 2.46e-04 | 2.04e-01 | -0.1001 |
| 79174 | CRELD2 | HTA11_1391_2000001011 | Human | Colorectum | AD | 1.58e-23 | 6.28e-01 | -0.059 |
| 79174 | CRELD2 | HTA11_2992_2000001011 | Human | Colorectum | SER | 4.74e-10 | 4.86e-01 | -0.1706 |
| 79174 | CRELD2 | HTA11_5212_2000001011 | Human | Colorectum | AD | 4.98e-03 | 2.17e-01 | -0.2061 |
| 79174 | CRELD2 | HTA11_546_2000001011 | Human | Colorectum | AD | 8.39e-04 | 2.55e-01 | -0.0842 |
| 79174 | CRELD2 | HTA11_866_3004761011 | Human | Colorectum | AD | 3.48e-04 | 1.57e-01 | 0.096 |
| 79174 | CRELD2 | HTA11_8622_2000001021 | Human | Colorectum | SER | 1.05e-03 | 2.87e-01 | 0.0528 |
| 79174 | CRELD2 | HTA11_6801_2000001011 | Human | Colorectum | SER | 1.35e-03 | 3.38e-01 | 0.0171 |
| 79174 | CRELD2 | HTA11_10711_2000001011 | Human | Colorectum | AD | 1.31e-02 | 1.63e-01 | 0.0338 |
| 79174 | CRELD2 | HTA11_7696_3000711011 | Human | Colorectum | AD | 1.52e-02 | 1.75e-01 | 0.0674 |
| 79174 | CRELD2 | HTA11_99999970781_79442 | Human | Colorectum | MSS | 8.53e-10 | 2.85e-01 | 0.294 |
| Page: 1 2 3 4 5 6 7 8 |
| Tissue | Expression Dynamics | Abbreviation |
| Colorectum (GSE201348) |  | FAP: Familial adenomatous polyposis |
| CRC: Colorectal cancer | ||
| Colorectum (HTA11) |  | AD: Adenomas |
| SER: Sessile serrated lesions | ||
| MSI-H: Microsatellite-high colorectal cancer | ||
| MSS: Microsatellite stable colorectal cancer | ||
| Esophagus | 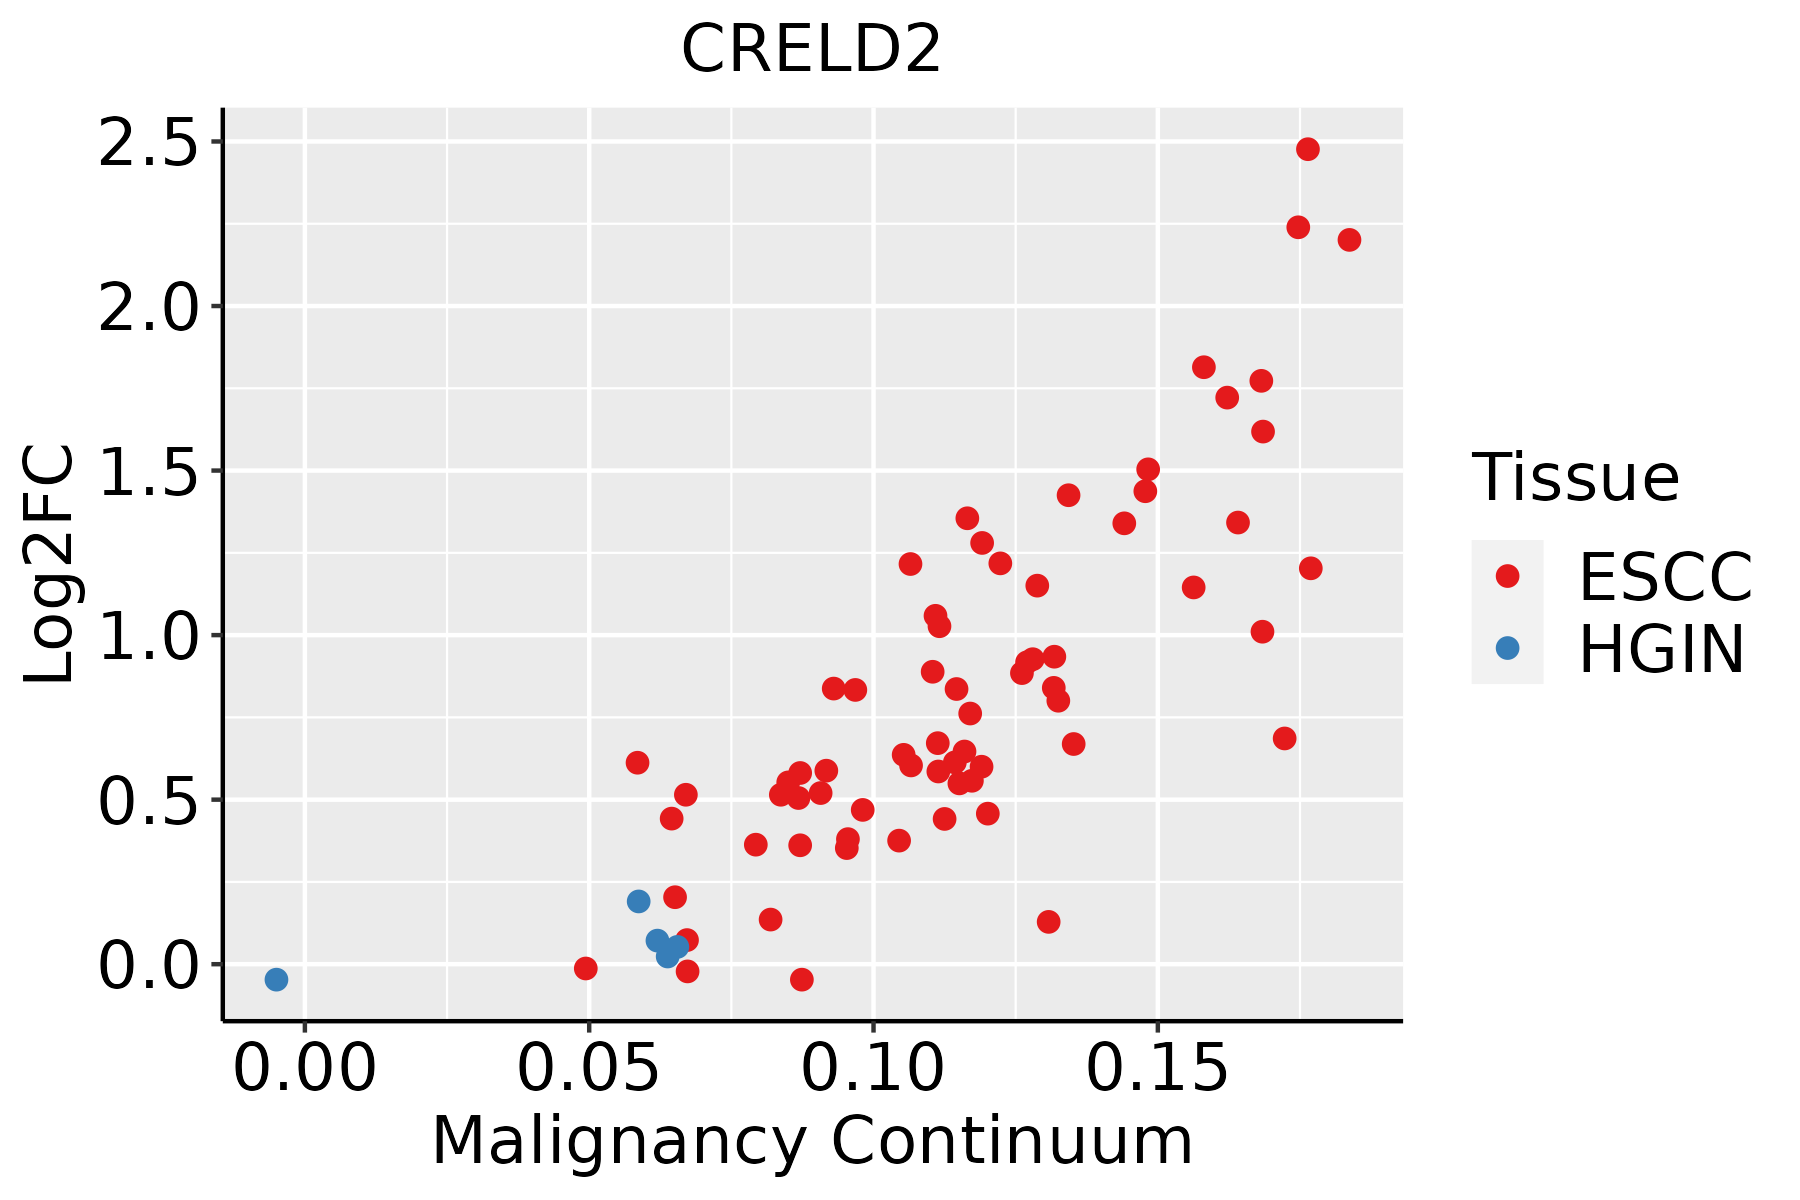 | ESCC: Esophageal squamous cell carcinoma |
| HGIN: High-grade intraepithelial neoplasias | ||
| LGIN: Low-grade intraepithelial neoplasias | ||
| Liver | 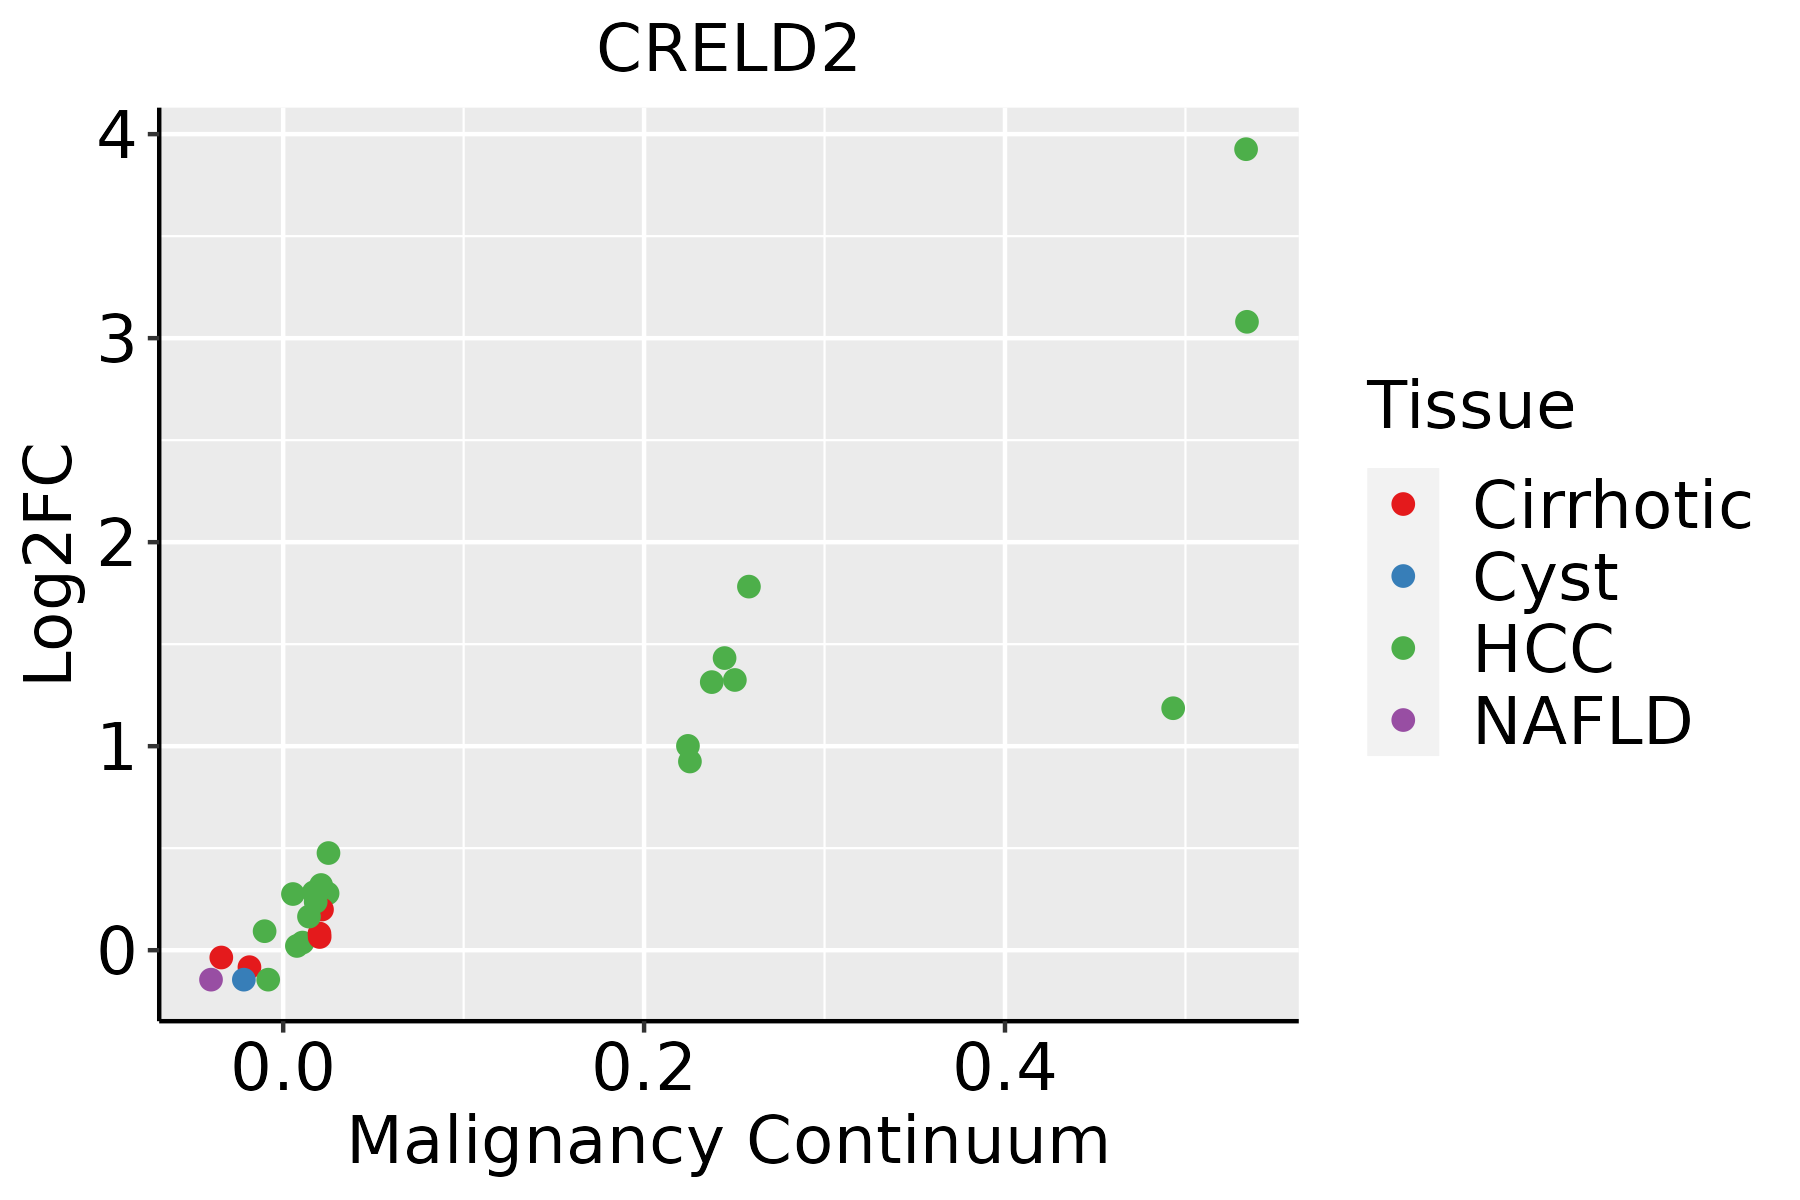 | HCC: Hepatocellular carcinoma |
| NAFLD: Non-alcoholic fatty liver disease | ||
| Oral Cavity |  | EOLP: Erosive Oral lichen planus |
| LP: leukoplakia | ||
| NEOLP: Non-erosive oral lichen planus | ||
| OSCC: Oral squamous cell carcinoma | ||
| Prostate | 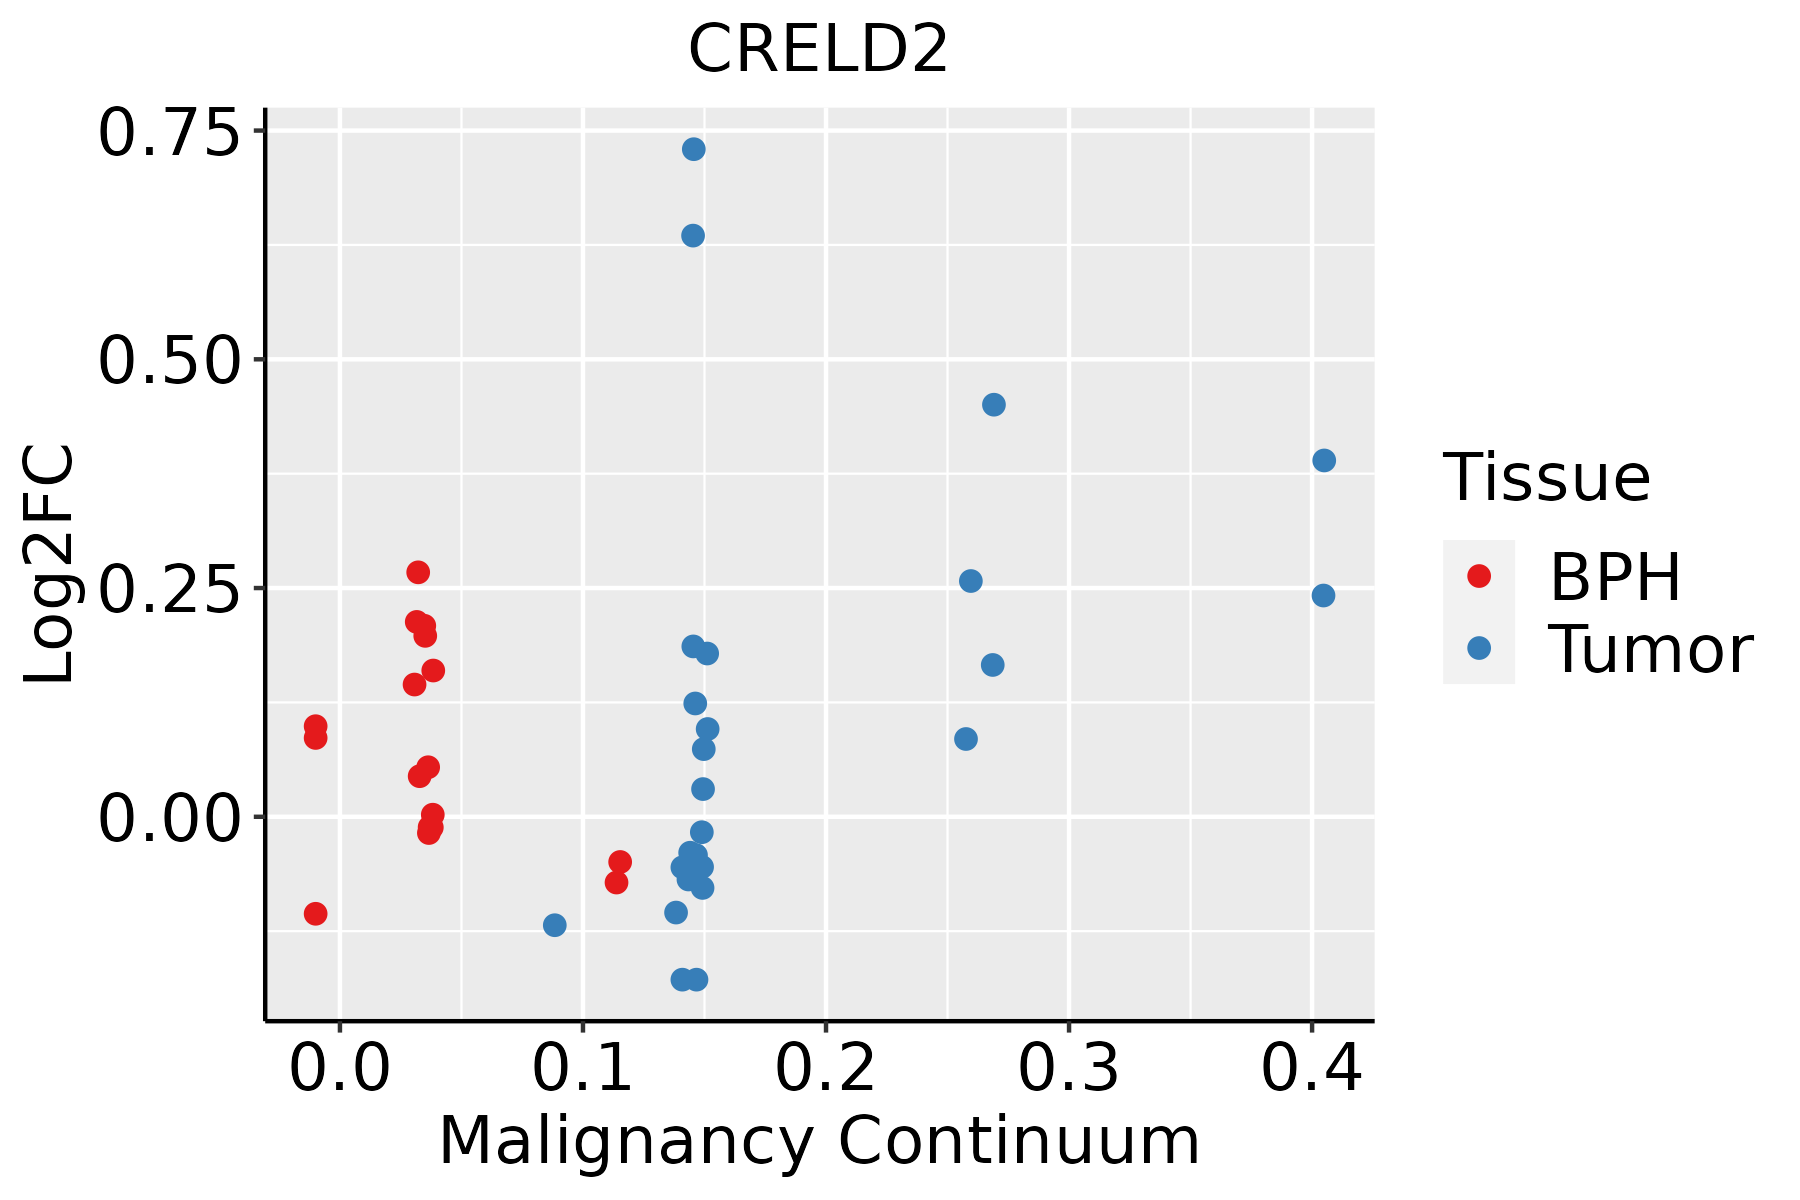 | BPH: Benign Prostatic Hyperplasia |
| Skin | 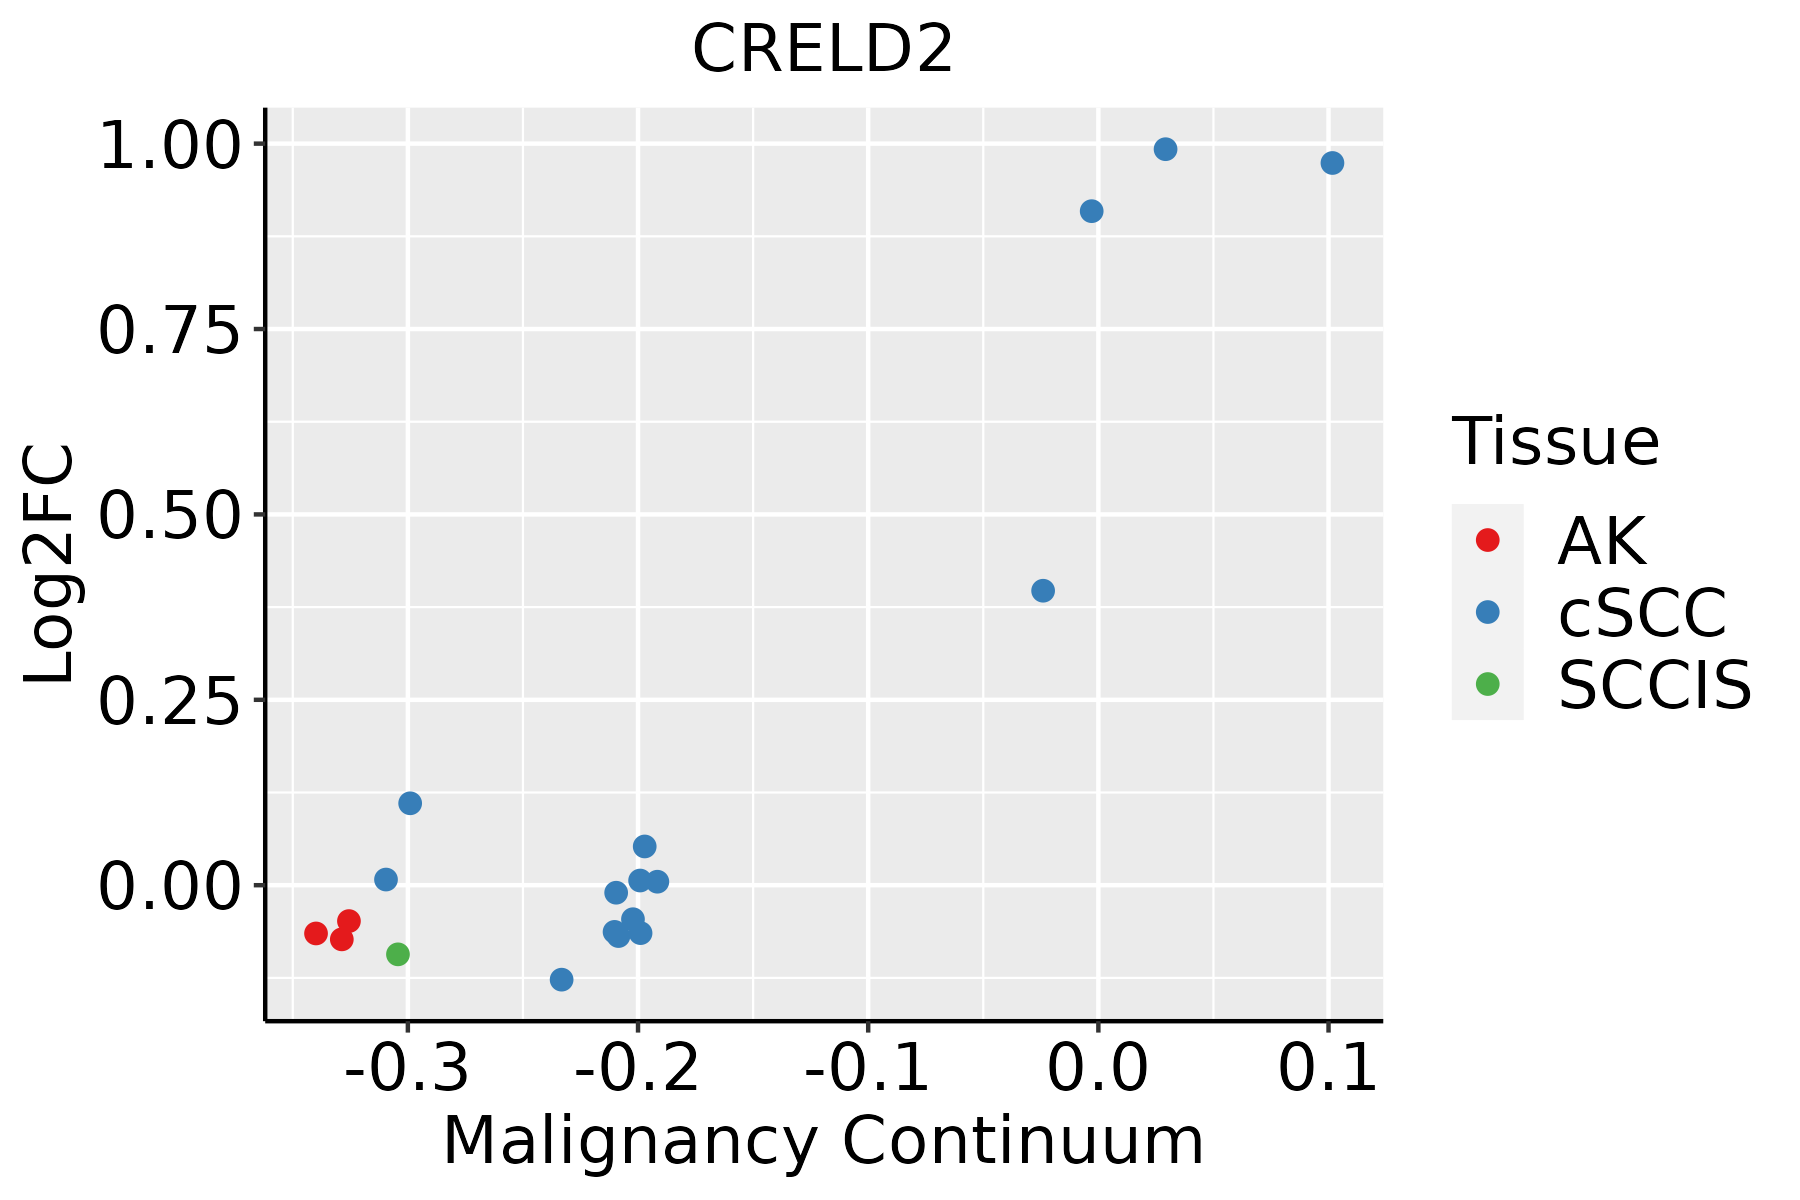 | AK: Actinic keratosis |
| cSCC: Cutaneous squamous cell carcinoma | ||
| SCCIS:squamous cell carcinoma in situ | ||
| Thyroid | 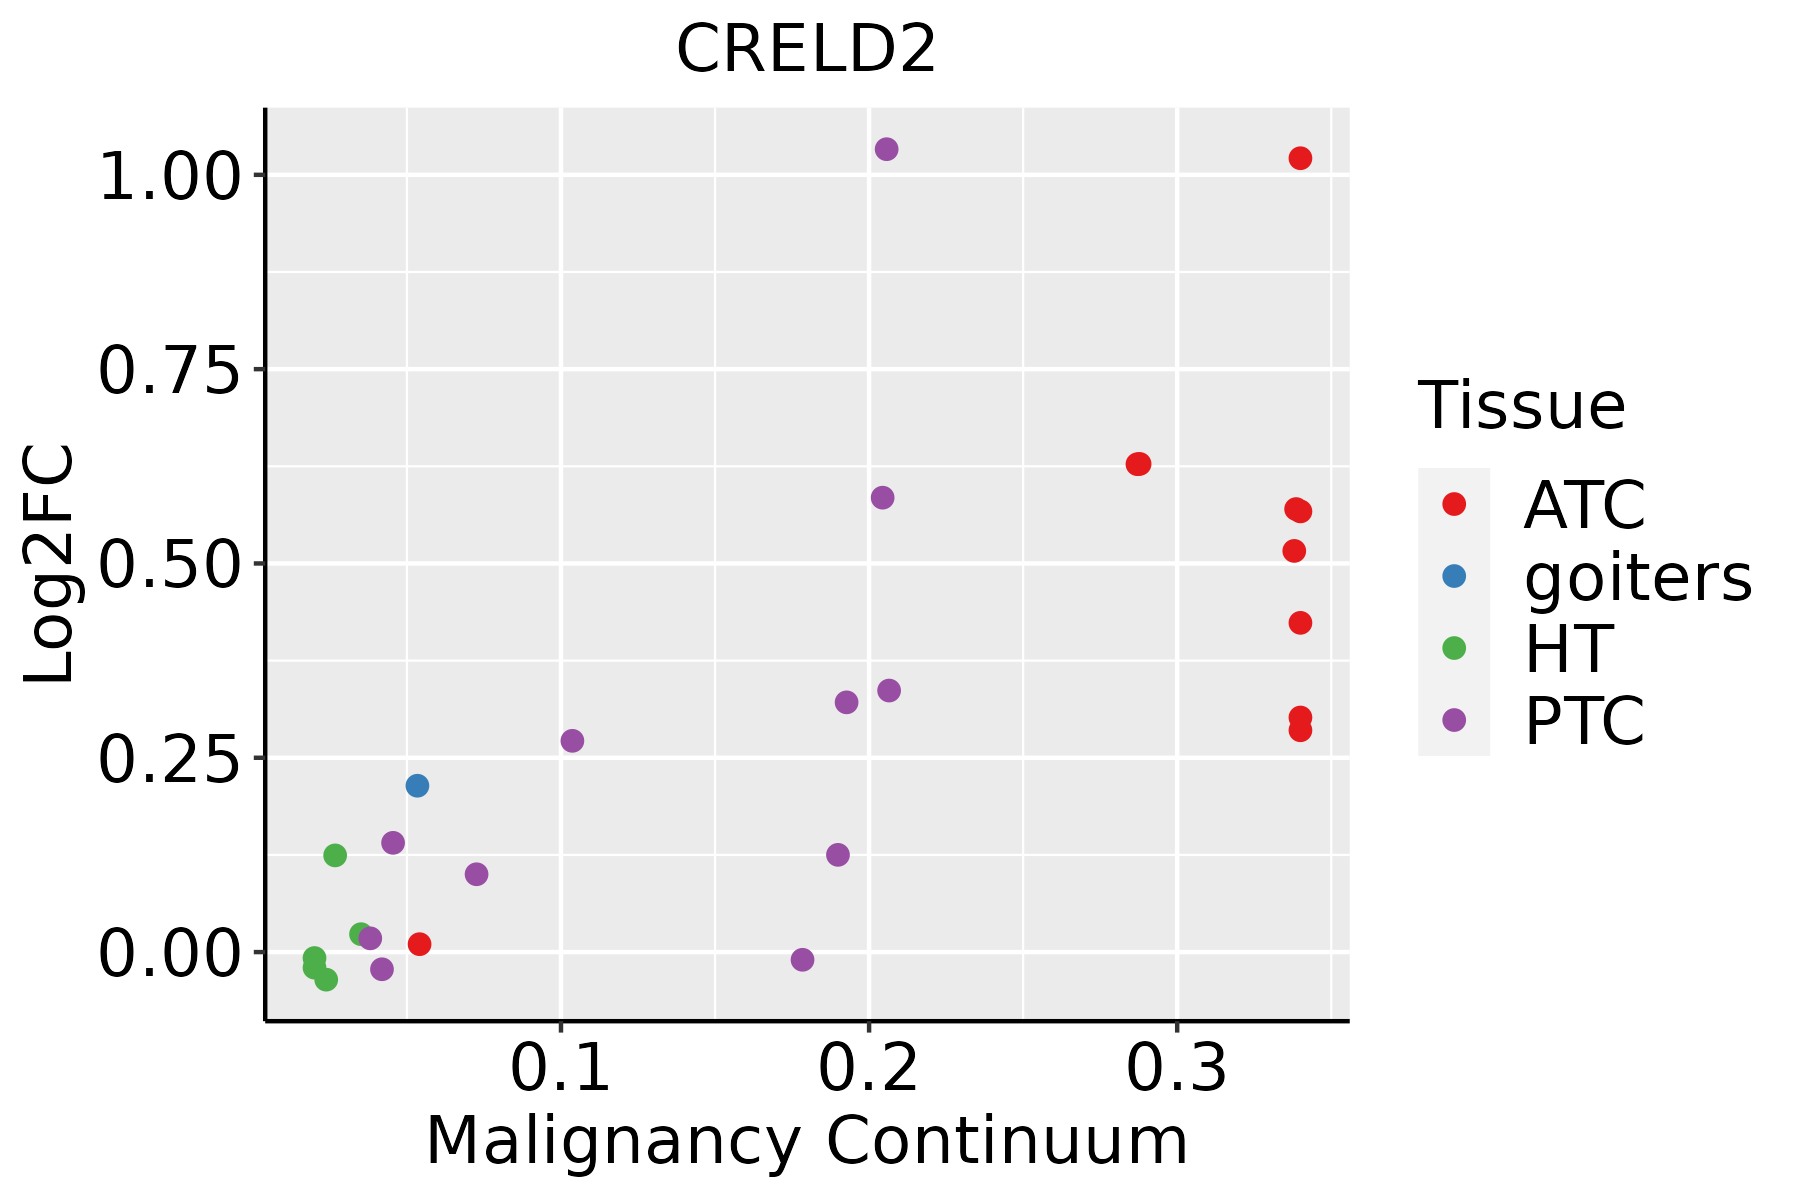 | ATC: Anaplastic thyroid cancer |
| HT: Hashimoto's thyroiditis | ||
| PTC: Papillary thyroid cancer |
| ∗log2FC in expression of this searched gene in stem-like cells from each diseased tissue sample relative to stem-like cells in normal samples in each tissue plotted against the malignancy continuum. Samples are colored based on if they are from different disease stage. |
Top |
Malignant transformation related pathway analysis |
| Find out the enriched GO biological processes and KEGG pathways involved in transition from healthy to precancer to cancer |
| Tissue | Disease Stage | Enriched GO biological Processes |
| Colorectum | AD |  |
| Colorectum | SER |  |
| Colorectum | MSS |  |
| Colorectum | MSI-H |  |
| Colorectum | FAP |  |
| ∗Top 15 enriched GO BP terms are showed in the bar plot of each disease state in each tissue. Each row represents a significant GO biological process which is colored according to the -log10(p.adjust). |
| Page: 1 2 3 4 5 6 7 8 9 |
| GO ID | Tissue | Disease Stage | Description | Gene Ratio | Bg Ratio | pvalue | p.adjust | Count |
| Page: 1 |
| Pathway ID | Tissue | Disease Stage | Description | Gene Ratio | Bg Ratio | pvalue | p.adjust | qvalue | Count |
| Page: 1 |
Top |
Cell-cell communication analysis |
| Identification of potential cell-cell interactions between two cell types and their ligand-receptor pairs for different disease states |
| Ligand | Receptor | LRpair | Pathway | Tissue | Disease Stage |
| Page: 1 |
Top |
Single-cell gene regulatory network inference analysis |
| Find out the significant the regulons (TFs) and the target genes of each regulon across cell types for different disease states |
| TF | Cell Type | Tissue | Disease Stage | Target Gene | RSS | Regulon Activity |
| ∗The dot plots of a searched regulon are shown for all cell subpopulations in each disease state of each tissue based on the regulon specific score inferred using pySCENIC and by calculating the average expression. |
| Page: 1 |
Top |
Somatic mutation of malignant transformation related genes |
| Annotation of somatic variants for genes involved in malignant transformation |
| Hugo Symbol | Variant Class | Variant Classification | dbSNP RS | HGVSc | HGVSp | HGVSp Short | SWISSPROT | BIOTYPE | SIFT | PolyPhen | Tumor Sample Barcode | Tissue | Histology | Sex | Age | Stage | Therapy Types | Drugs | Outcome |
| CRELD2 | SNV | Missense_Mutation | rs764933512 | c.1111N>A | p.Gly371Ser | p.G371S | Q6UXH1 | protein_coding | deleterious(0.02) | probably_damaging(0.998) | TCGA-C8-A12P-01 | Breast | breast invasive carcinoma | Female | <65 | I/II | Unknown | Unknown | SD |
| CRELD2 | SNV | Missense_Mutation | rs114824010 | c.655N>A | p.Val219Met | p.V219M | Q6UXH1 | protein_coding | tolerated_low_confidence(0.08) | benign(0) | TCGA-E2-A1LG-01 | Breast | breast invasive carcinoma | Female | <65 | I/II | Chemotherapy | doxorubicin | SD |
| CRELD2 | SNV | Missense_Mutation | c.713N>A | p.Arg238Lys | p.R238K | Q6UXH1 | protein_coding | tolerated_low_confidence(1) | benign(0.033) | TCGA-GM-A2D9-01 | Breast | breast invasive carcinoma | Female | >=65 | I/II | Hormone Therapy | arimidex | SD | |
| CRELD2 | deletion | Frame_Shift_Del | novel | c.631delC | p.Leu211CysfsTer31 | p.L211Cfs*31 | Q6UXH1 | protein_coding | TCGA-EW-A2FV-01 | Breast | breast invasive carcinoma | Female | <65 | III/IV | Chemotherapy | docetaxel | SD | ||
| CRELD2 | SNV | Missense_Mutation | novel | c.173N>T | p.Thr58Met | p.T58M | Q6UXH1 | protein_coding | deleterious(0) | probably_damaging(0.998) | TCGA-A6-3809-01 | Colorectum | colon adenocarcinoma | Female | >=65 | I/II | Unknown | Unknown | SD |
| CRELD2 | SNV | Missense_Mutation | c.1049N>T | p.Cys350Phe | p.C350F | Q6UXH1 | protein_coding | deleterious(0) | probably_damaging(1) | TCGA-AA-3811-01 | Colorectum | colon adenocarcinoma | Female | >=65 | III/IV | Unknown | Unknown | PD | |
| CRELD2 | SNV | Missense_Mutation | novel | c.539N>C | p.Cys180Ser | p.C180S | Q6UXH1 | protein_coding | deleterious(0) | probably_damaging(0.999) | TCGA-A5-A0G1-01 | Endometrium | uterine corpus endometrioid carcinoma | Female | >=65 | I/II | Unknown | Unknown | SD |
| CRELD2 | SNV | Missense_Mutation | novel | c.650G>A | p.Arg217His | p.R217H | Q6UXH1 | protein_coding | tolerated_low_confidence(0.59) | benign(0) | TCGA-AJ-A3BH-01 | Endometrium | uterine corpus endometrioid carcinoma | Female | Unknown | I/II | Unknown | Unknown | SD |
| CRELD2 | SNV | Missense_Mutation | rs145595543 | c.524C>T | p.Pro175Leu | p.P175L | Q6UXH1 | protein_coding | deleterious(0.04) | benign(0.124) | TCGA-AP-A0LM-01 | Endometrium | uterine corpus endometrioid carcinoma | Female | <65 | III/IV | Chemotherapy | cisplatin | SD |
| CRELD2 | SNV | Missense_Mutation | rs373662275 | c.748G>A | p.Glu250Lys | p.E250K | Q6UXH1 | protein_coding | tolerated(0.23) | benign(0.356) | TCGA-AP-A0LM-01 | Endometrium | uterine corpus endometrioid carcinoma | Female | <65 | III/IV | Chemotherapy | cisplatin | SD |
| Page: 1 2 3 |
Top |
Related drugs of malignant transformation related genes |
| Identification of chemicals and drugs interact with genes involved in malignant transfromation |
| (DGIdb 4.0) |
| Entrez ID | Symbol | Category | Interaction Types | Drug Claim Name | Drug Name | PMIDs |
| Page: 1 |

Copyright 2023-Present -The University of Texas Health Science Center at Houston |