
|
|||||
|
 | |
| |
| |
| |
| |
| |
|
Gene: CRELD1 |
Gene summary for CRELD1 |
| Gene information | Species | Human | Gene symbol | CRELD1 | Gene ID | 78987 |
| Gene name | cysteine rich with EGF like domains 1 | |
| Gene Alias | AVSD2 | |
| Cytomap | 3p25.3 | |
| Gene Type | protein-coding | GO ID | GO:0003197 | UniProtAcc | Q96HD1 |
Top |
Malignant transformation analysis |
| Identification of the aberrant gene expression in precancerous and cancerous lesions by comparing the gene expression of stem-like cells in diseased tissues with normal stem cells |
| Entrez ID | Symbol | Replicates | Species | Organ | Tissue | Adj P-value | Log2FC | Malignancy |
| 78987 | CRELD1 | LZE7T | Human | Esophagus | ESCC | 4.78e-02 | 1.18e-01 | 0.0667 |
| 78987 | CRELD1 | LZE20T | Human | Esophagus | ESCC | 3.39e-06 | 9.78e-02 | 0.0662 |
| 78987 | CRELD1 | LZE24T | Human | Esophagus | ESCC | 6.16e-15 | 4.35e-01 | 0.0596 |
| 78987 | CRELD1 | LZE6T | Human | Esophagus | ESCC | 1.66e-02 | 7.80e-02 | 0.0845 |
| 78987 | CRELD1 | P1T-E | Human | Esophagus | ESCC | 6.52e-08 | 2.36e-01 | 0.0875 |
| 78987 | CRELD1 | P2T-E | Human | Esophagus | ESCC | 2.10e-23 | 3.36e-01 | 0.1177 |
| 78987 | CRELD1 | P4T-E | Human | Esophagus | ESCC | 5.10e-17 | 2.44e-01 | 0.1323 |
| 78987 | CRELD1 | P5T-E | Human | Esophagus | ESCC | 1.76e-26 | 4.94e-01 | 0.1327 |
| 78987 | CRELD1 | P8T-E | Human | Esophagus | ESCC | 5.44e-15 | 1.83e-01 | 0.0889 |
| 78987 | CRELD1 | P9T-E | Human | Esophagus | ESCC | 1.71e-08 | 1.69e-01 | 0.1131 |
| 78987 | CRELD1 | P10T-E | Human | Esophagus | ESCC | 1.32e-34 | 5.85e-01 | 0.116 |
| 78987 | CRELD1 | P11T-E | Human | Esophagus | ESCC | 1.13e-13 | 5.41e-01 | 0.1426 |
| 78987 | CRELD1 | P12T-E | Human | Esophagus | ESCC | 6.50e-35 | 5.48e-01 | 0.1122 |
| 78987 | CRELD1 | P15T-E | Human | Esophagus | ESCC | 4.02e-06 | 9.73e-02 | 0.1149 |
| 78987 | CRELD1 | P16T-E | Human | Esophagus | ESCC | 1.05e-37 | 6.79e-01 | 0.1153 |
| 78987 | CRELD1 | P17T-E | Human | Esophagus | ESCC | 8.73e-06 | 3.51e-01 | 0.1278 |
| 78987 | CRELD1 | P20T-E | Human | Esophagus | ESCC | 2.11e-18 | 2.86e-01 | 0.1124 |
| 78987 | CRELD1 | P21T-E | Human | Esophagus | ESCC | 6.40e-19 | 4.21e-01 | 0.1617 |
| 78987 | CRELD1 | P22T-E | Human | Esophagus | ESCC | 6.61e-22 | 3.53e-01 | 0.1236 |
| 78987 | CRELD1 | P23T-E | Human | Esophagus | ESCC | 1.05e-09 | 2.98e-01 | 0.108 |
| Page: 1 2 3 4 5 |
| Tissue | Expression Dynamics | Abbreviation |
| Esophagus |  | ESCC: Esophageal squamous cell carcinoma |
| HGIN: High-grade intraepithelial neoplasias | ||
| LGIN: Low-grade intraepithelial neoplasias | ||
| Liver | 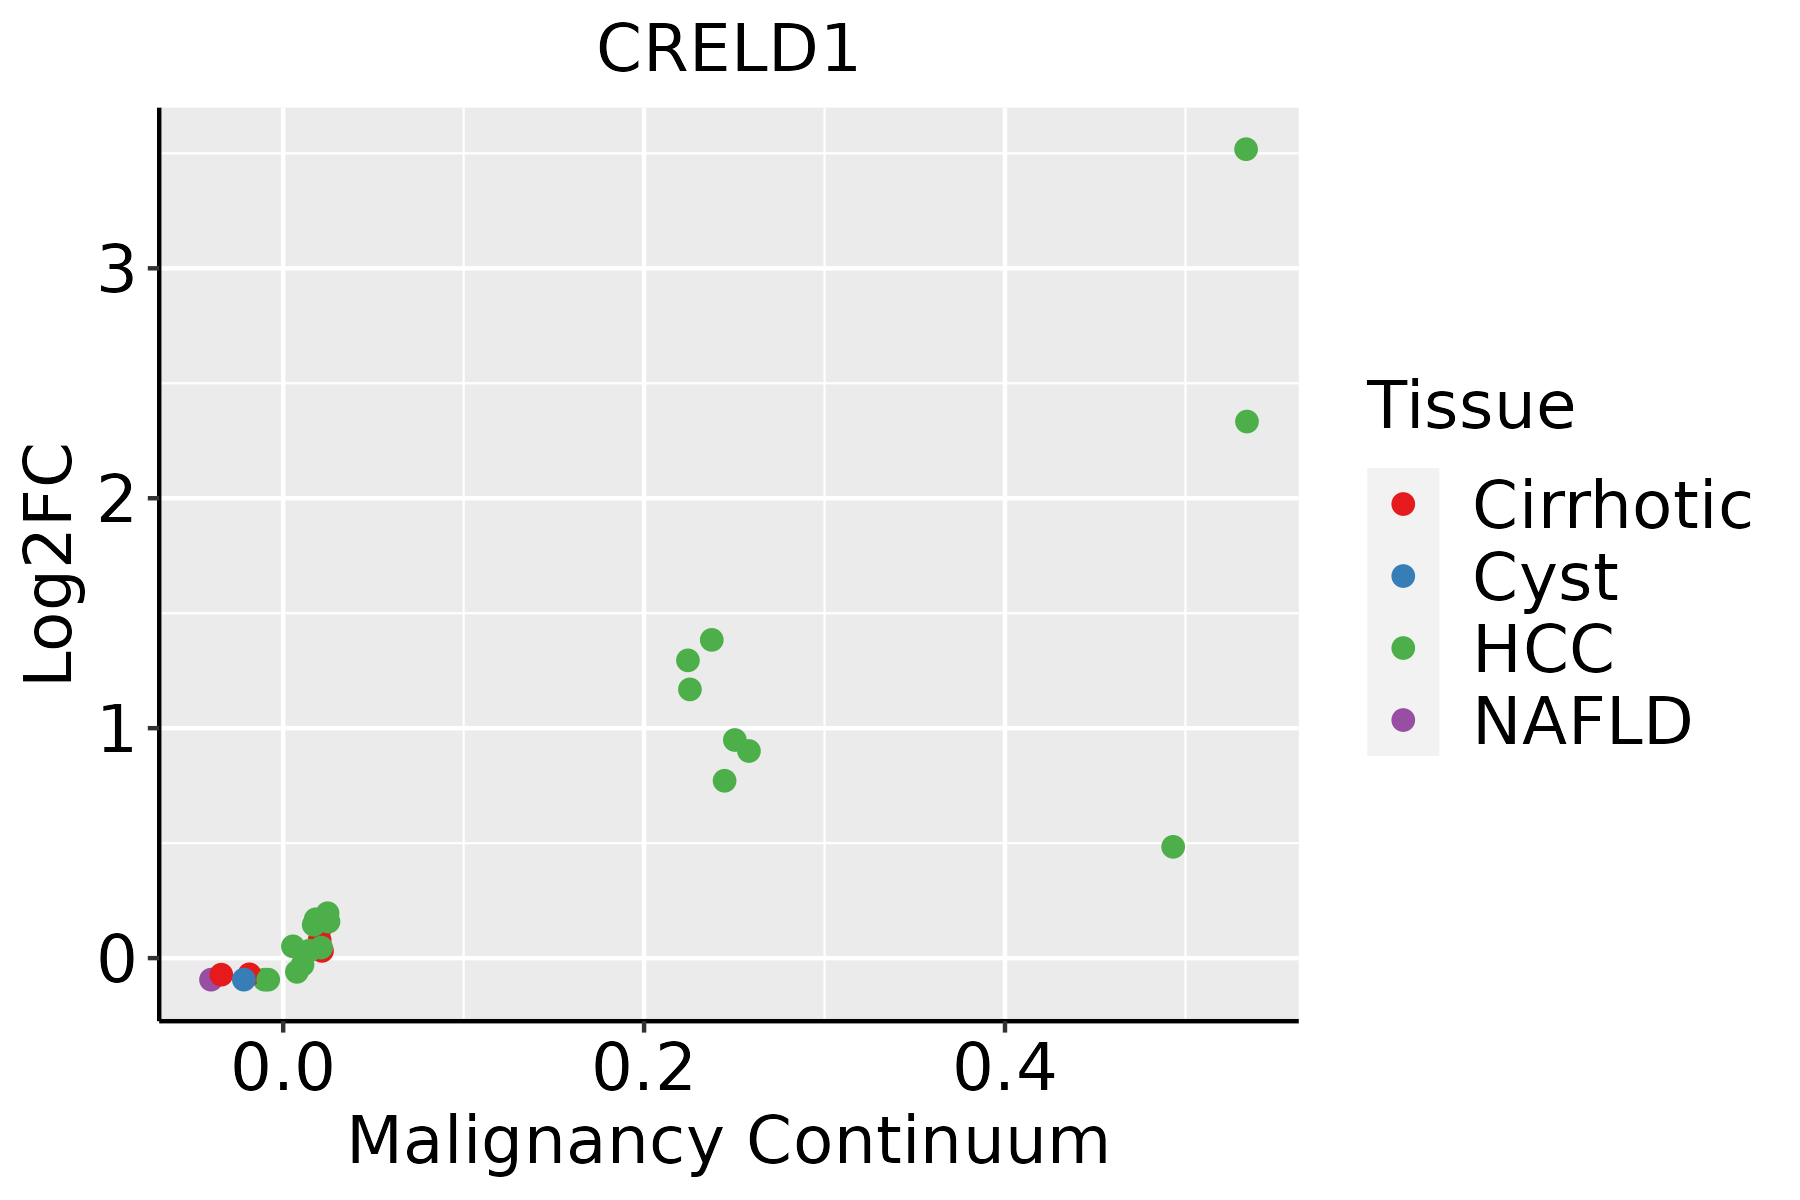 | HCC: Hepatocellular carcinoma |
| NAFLD: Non-alcoholic fatty liver disease | ||
| Oral Cavity |  | EOLP: Erosive Oral lichen planus |
| LP: leukoplakia | ||
| NEOLP: Non-erosive oral lichen planus | ||
| OSCC: Oral squamous cell carcinoma | ||
| Thyroid |  | ATC: Anaplastic thyroid cancer |
| HT: Hashimoto's thyroiditis | ||
| PTC: Papillary thyroid cancer |
| ∗log2FC in expression of this searched gene in stem-like cells from each diseased tissue sample relative to stem-like cells in normal samples in each tissue plotted against the malignancy continuum. Samples are colored based on if they are from different disease stage. |
Top |
Malignant transformation related pathway analysis |
| Find out the enriched GO biological processes and KEGG pathways involved in transition from healthy to precancer to cancer |
| Tissue | Disease Stage | Enriched GO biological Processes |
| Colorectum | AD |  |
| Colorectum | SER |  |
| Colorectum | MSS |  |
| Colorectum | MSI-H |  |
| Colorectum | FAP |  |
| ∗Top 15 enriched GO BP terms are showed in the bar plot of each disease state in each tissue. Each row represents a significant GO biological process which is colored according to the -log10(p.adjust). |
| Page: 1 2 3 4 5 6 7 8 9 |
| GO ID | Tissue | Disease Stage | Description | Gene Ratio | Bg Ratio | pvalue | p.adjust | Count |
| GO:00604856 | Esophagus | ESCC | mesenchyme development | 156/8552 | 291/18723 | 3.76e-03 | 1.53e-02 | 156 |
| GO:00032794 | Thyroid | PTC | cardiac septum development | 54/5968 | 103/18723 | 1.17e-05 | 1.29e-04 | 54 |
| GO:00032055 | Thyroid | PTC | cardiac chamber development | 72/5968 | 161/18723 | 4.13e-04 | 2.77e-03 | 72 |
| GO:006048514 | Thyroid | PTC | mesenchyme development | 112/5968 | 291/18723 | 9.48e-03 | 3.90e-02 | 112 |
| GO:006048521 | Thyroid | ATC | mesenchyme development | 136/6293 | 291/18723 | 2.04e-06 | 2.43e-05 | 136 |
| GO:000327912 | Thyroid | ATC | cardiac septum development | 56/6293 | 103/18723 | 1.14e-05 | 1.11e-04 | 56 |
| GO:000320512 | Thyroid | ATC | cardiac chamber development | 79/6293 | 161/18723 | 3.39e-05 | 2.80e-04 | 79 |
| GO:0003197 | Thyroid | ATC | endocardial cushion development | 25/6293 | 45/18723 | 2.00e-03 | 9.59e-03 | 25 |
| Page: 1 |
| Pathway ID | Tissue | Disease Stage | Description | Gene Ratio | Bg Ratio | pvalue | p.adjust | qvalue | Count |
| Page: 1 |
Top |
Cell-cell communication analysis |
| Identification of potential cell-cell interactions between two cell types and their ligand-receptor pairs for different disease states |
| Ligand | Receptor | LRpair | Pathway | Tissue | Disease Stage |
| Page: 1 |
Top |
Single-cell gene regulatory network inference analysis |
| Find out the significant the regulons (TFs) and the target genes of each regulon across cell types for different disease states |
| TF | Cell Type | Tissue | Disease Stage | Target Gene | RSS | Regulon Activity |
| ∗The dot plots of a searched regulon are shown for all cell subpopulations in each disease state of each tissue based on the regulon specific score inferred using pySCENIC and by calculating the average expression. |
| Page: 1 |
Top |
Somatic mutation of malignant transformation related genes |
| Annotation of somatic variants for genes involved in malignant transformation |
| Hugo Symbol | Variant Class | Variant Classification | dbSNP RS | HGVSc | HGVSp | HGVSp Short | SWISSPROT | BIOTYPE | SIFT | PolyPhen | Tumor Sample Barcode | Tissue | Histology | Sex | Age | Stage | Therapy Types | Drugs | Outcome |
| CRELD1 | SNV | Missense_Mutation | novel | c.775N>T | p.Asp259Tyr | p.D259Y | Q96HD1 | protein_coding | deleterious(0) | possibly_damaging(0.66) | TCGA-A2-A25A-01 | Breast | breast invasive carcinoma | Female | <65 | I/II | Unspecific | Cytoxan | SD |
| CRELD1 | SNV | Missense_Mutation | novel | c.889N>G | p.Gln297Glu | p.Q297E | Q96HD1 | protein_coding | tolerated(0.46) | benign(0.342) | TCGA-BH-A0B6-01 | Breast | breast invasive carcinoma | Female | <65 | I/II | Unknown | Unknown | SD |
| CRELD1 | SNV | Missense_Mutation | c.250N>C | p.Lys84Gln | p.K84Q | Q96HD1 | protein_coding | tolerated(0.15) | possibly_damaging(0.59) | TCGA-BH-A0WA-01 | Breast | breast invasive carcinoma | Female | >=65 | I/II | Unknown | Unknown | SD | |
| CRELD1 | SNV | Missense_Mutation | c.157N>C | p.Val53Leu | p.V53L | Q96HD1 | protein_coding | tolerated(0.08) | possibly_damaging(0.775) | TCGA-D8-A1XQ-01 | Breast | breast invasive carcinoma | Female | >=65 | I/II | Unknown | Unknown | SD | |
| CRELD1 | deletion | Frame_Shift_Del | novel | c.1082delN | p.Thr362GlnfsTer16 | p.T362Qfs*16 | Q96HD1 | protein_coding | TCGA-EW-A2FV-01 | Breast | breast invasive carcinoma | Female | <65 | III/IV | Chemotherapy | docetaxel | SD | ||
| CRELD1 | SNV | Missense_Mutation | c.739N>C | p.Asp247His | p.D247H | Q96HD1 | protein_coding | deleterious(0) | probably_damaging(0.999) | TCGA-C5-A1BQ-01 | Cervix | cervical & endocervical cancer | Female | >=65 | III/IV | Chemotherapy | cisplatin | CR | |
| CRELD1 | SNV | Missense_Mutation | novel | c.351N>C | p.Glu117Asp | p.E117D | Q96HD1 | protein_coding | deleterious(0) | probably_damaging(0.987) | TCGA-MA-AA3Y-01 | Cervix | cervical & endocervical cancer | Female | <65 | I/II | Unknown | Unknown | SD |
| CRELD1 | SNV | Missense_Mutation | novel | c.110N>G | p.Ser37Cys | p.S37C | Q96HD1 | protein_coding | deleterious(0.03) | possibly_damaging(0.545) | TCGA-VS-A9U6-01 | Cervix | cervical & endocervical cancer | Female | <65 | I/II | Chemotherapy | cisplatin | PD |
| CRELD1 | SNV | Missense_Mutation | novel | c.236A>C | p.Asn79Thr | p.N79T | Q96HD1 | protein_coding | tolerated(0.53) | benign(0.05) | TCGA-AA-A010-01 | Colorectum | colon adenocarcinoma | Female | <65 | I/II | Chemotherapy | folinic | CR |
| CRELD1 | SNV | Missense_Mutation | rs140647459 | c.1094N>A | p.Arg365His | p.R365H | Q96HD1 | protein_coding | tolerated(0.16) | benign(0.157) | TCGA-AA-A022-01 | Colorectum | colon adenocarcinoma | Female | >=65 | I/II | Unknown | Unknown | SD |
| Page: 1 2 3 |
Top |
Related drugs of malignant transformation related genes |
| Identification of chemicals and drugs interact with genes involved in malignant transfromation |
| (DGIdb 4.0) |
| Entrez ID | Symbol | Category | Interaction Types | Drug Claim Name | Drug Name | PMIDs |
| Page: 1 |

Copyright 2023-Present -The University of Texas Health Science Center at Houston |