
|
|||||
|
 | |
| |
| |
| |
| |
| |
|
Gene: CREG2 |
Gene summary for CREG2 |
| Gene information | Species | Human | Gene symbol | CREG2 | Gene ID | 200407 |
| Gene name | cellular repressor of E1A stimulated genes 2 | |
| Gene Alias | CREG2 | |
| Cytomap | 2q11.2 | |
| Gene Type | protein-coding | GO ID | GO:0005575 | UniProtAcc | Q8IUH2 |
Top |
Malignant transformation analysis |
| Identification of the aberrant gene expression in precancerous and cancerous lesions by comparing the gene expression of stem-like cells in diseased tissues with normal stem cells |
| Entrez ID | Symbol | Replicates | Species | Organ | Tissue | Adj P-value | Log2FC | Malignancy |
| 200407 | CREG2 | P5T-E | Human | Esophagus | ESCC | 5.17e-27 | 5.43e-01 | 0.1327 |
| 200407 | CREG2 | P11T-E | Human | Esophagus | ESCC | 1.78e-13 | 6.30e-01 | 0.1426 |
| 200407 | CREG2 | P19T-E | Human | Esophagus | ESCC | 1.17e-11 | 1.62e+00 | 0.1662 |
| 200407 | CREG2 | P21T-E | Human | Esophagus | ESCC | 4.44e-08 | 2.12e-01 | 0.1617 |
| 200407 | CREG2 | P24T-E | Human | Esophagus | ESCC | 9.67e-18 | 6.14e-01 | 0.1287 |
| 200407 | CREG2 | P26T-E | Human | Esophagus | ESCC | 1.96e-05 | 1.31e-01 | 0.1276 |
| 200407 | CREG2 | P28T-E | Human | Esophagus | ESCC | 1.78e-03 | 1.32e-01 | 0.1149 |
| 200407 | CREG2 | P31T-E | Human | Esophagus | ESCC | 4.17e-05 | 1.56e-01 | 0.1251 |
| 200407 | CREG2 | P37T-E | Human | Esophagus | ESCC | 5.94e-11 | 2.66e-01 | 0.1371 |
| 200407 | CREG2 | P40T-E | Human | Esophagus | ESCC | 2.37e-02 | 1.52e-01 | 0.109 |
| 200407 | CREG2 | P49T-E | Human | Esophagus | ESCC | 1.17e-11 | 1.23e+00 | 0.1768 |
| 200407 | CREG2 | P52T-E | Human | Esophagus | ESCC | 4.41e-07 | 2.51e-01 | 0.1555 |
| 200407 | CREG2 | P61T-E | Human | Esophagus | ESCC | 1.59e-04 | 2.44e-01 | 0.099 |
| 200407 | CREG2 | P62T-E | Human | Esophagus | ESCC | 1.20e-02 | 1.28e-01 | 0.1302 |
| 200407 | CREG2 | P83T-E | Human | Esophagus | ESCC | 4.84e-09 | 3.33e-01 | 0.1738 |
| 200407 | CREG2 | P107T-E | Human | Esophagus | ESCC | 3.92e-42 | 1.39e+00 | 0.171 |
| Page: 1 |
| Tissue | Expression Dynamics | Abbreviation |
| Esophagus | 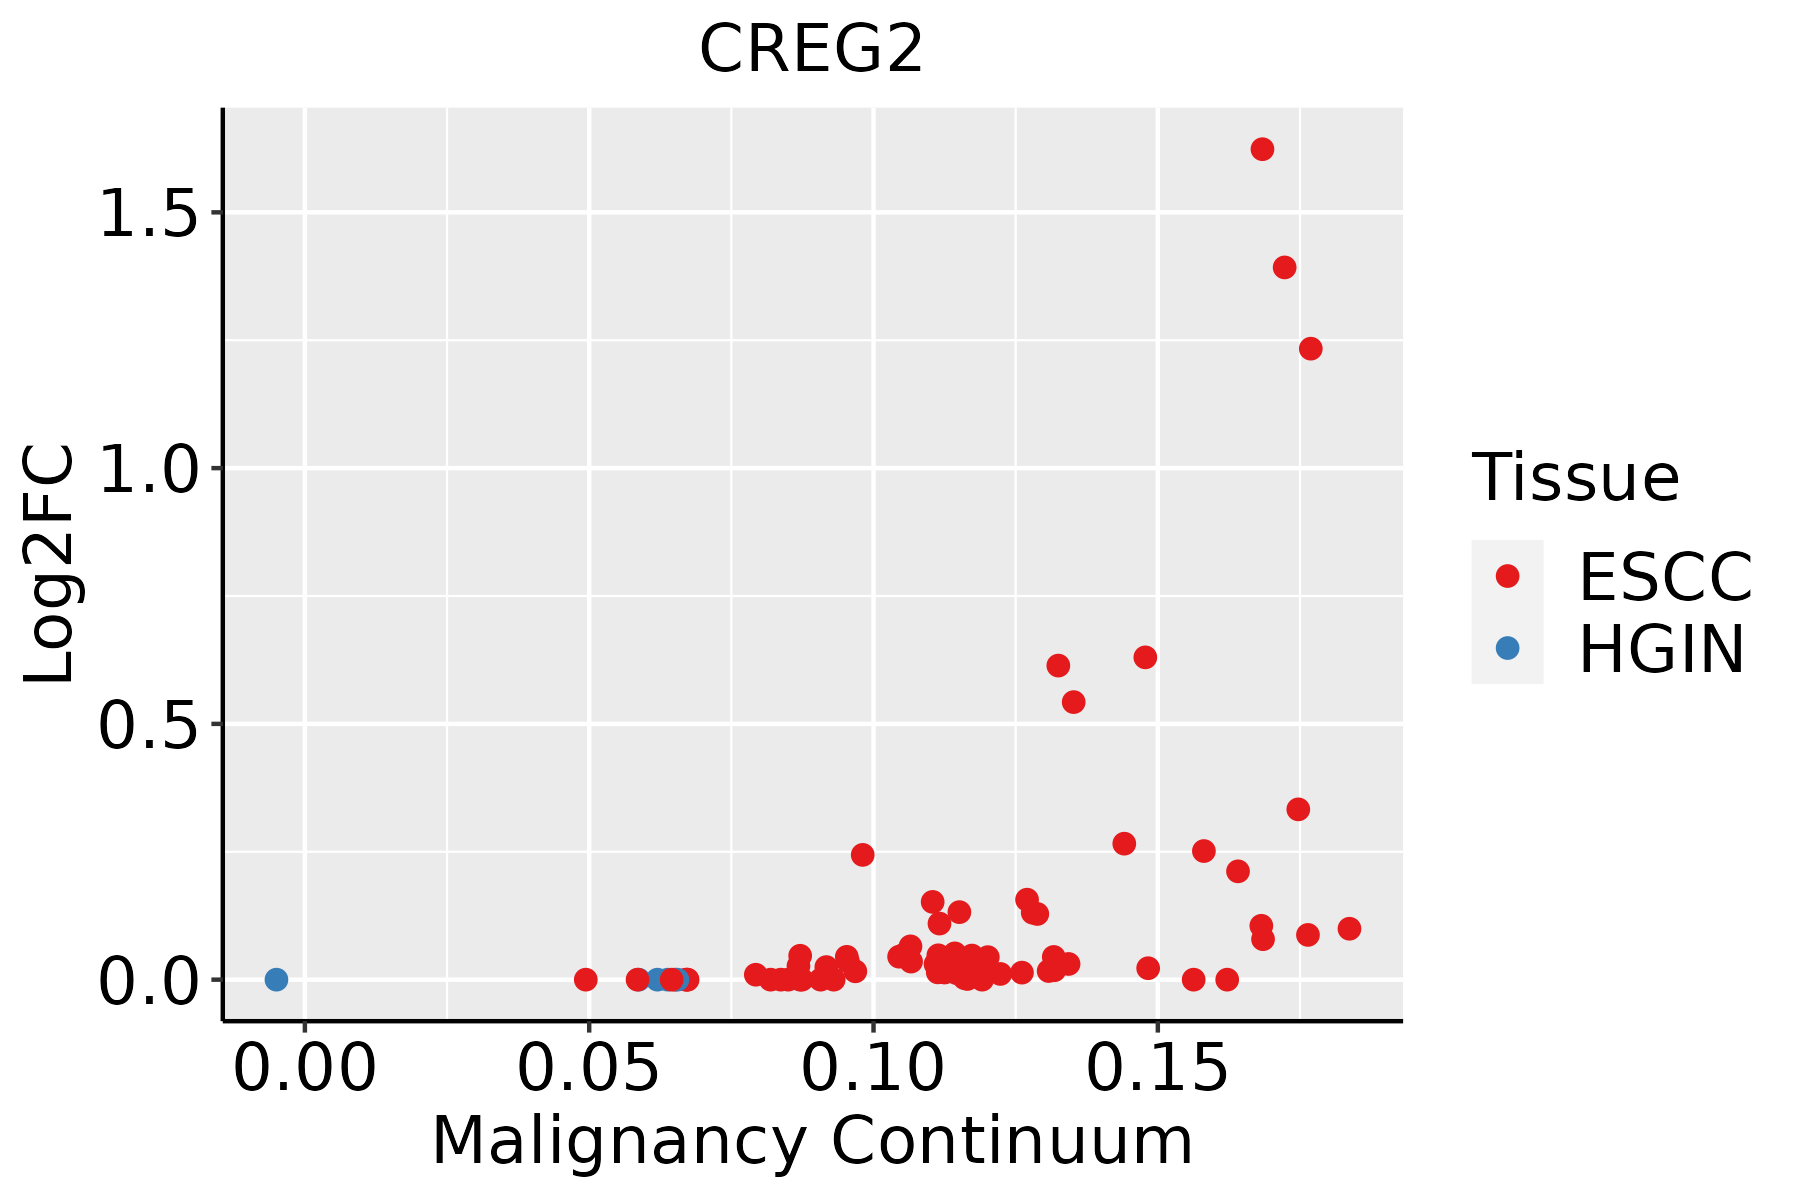 | ESCC: Esophageal squamous cell carcinoma |
| HGIN: High-grade intraepithelial neoplasias | ||
| LGIN: Low-grade intraepithelial neoplasias |
| ∗log2FC in expression of this searched gene in stem-like cells from each diseased tissue sample relative to stem-like cells in normal samples in each tissue plotted against the malignancy continuum. Samples are colored based on if they are from different disease stage. |
Top |
Malignant transformation related pathway analysis |
| Find out the enriched GO biological processes and KEGG pathways involved in transition from healthy to precancer to cancer |
| Tissue | Disease Stage | Enriched GO biological Processes |
| Colorectum | AD |  |
| Colorectum | SER |  |
| Colorectum | MSS |  |
| Colorectum | MSI-H |  |
| Colorectum | FAP |  |
| ∗Top 15 enriched GO BP terms are showed in the bar plot of each disease state in each tissue. Each row represents a significant GO biological process which is colored according to the -log10(p.adjust). |
| Page: 1 2 3 4 5 6 7 8 9 |
| GO ID | Tissue | Disease Stage | Description | Gene Ratio | Bg Ratio | pvalue | p.adjust | Count |
| Page: 1 |
| Pathway ID | Tissue | Disease Stage | Description | Gene Ratio | Bg Ratio | pvalue | p.adjust | qvalue | Count |
| Page: 1 |
Top |
Cell-cell communication analysis |
| Identification of potential cell-cell interactions between two cell types and their ligand-receptor pairs for different disease states |
| Ligand | Receptor | LRpair | Pathway | Tissue | Disease Stage |
| Page: 1 |
Top |
Single-cell gene regulatory network inference analysis |
| Find out the significant the regulons (TFs) and the target genes of each regulon across cell types for different disease states |
| TF | Cell Type | Tissue | Disease Stage | Target Gene | RSS | Regulon Activity |
| ∗The dot plots of a searched regulon are shown for all cell subpopulations in each disease state of each tissue based on the regulon specific score inferred using pySCENIC and by calculating the average expression. |
| Page: 1 |
Top |
Somatic mutation of malignant transformation related genes |
| Annotation of somatic variants for genes involved in malignant transformation |
| Hugo Symbol | Variant Class | Variant Classification | dbSNP RS | HGVSc | HGVSp | HGVSp Short | SWISSPROT | BIOTYPE | SIFT | PolyPhen | Tumor Sample Barcode | Tissue | Histology | Sex | Age | Stage | Therapy Types | Drugs | Outcome |
| CREG2 | SNV | Missense_Mutation | rs149973647 | c.752N>A | p.Arg251His | p.R251H | Q8IUH2 | protein_coding | tolerated(0.08) | probably_damaging(0.98) | TCGA-A5-A0G2-01 | Endometrium | uterine corpus endometrioid carcinoma | Female | <65 | III/IV | Unknown | Unknown | SD |
| CREG2 | SNV | Missense_Mutation | c.534N>T | p.Lys178Asn | p.K178N | Q8IUH2 | protein_coding | tolerated(0.11) | possibly_damaging(0.773) | TCGA-AP-A051-01 | Endometrium | uterine corpus endometrioid carcinoma | Female | >=65 | I/II | Unknown | Unknown | SD | |
| CREG2 | SNV | Missense_Mutation | c.777N>T | p.Lys259Asn | p.K259N | Q8IUH2 | protein_coding | deleterious(0) | probably_damaging(0.999) | TCGA-AP-A0LM-01 | Endometrium | uterine corpus endometrioid carcinoma | Female | <65 | III/IV | Chemotherapy | cisplatin | SD | |
| CREG2 | SNV | Missense_Mutation | c.751N>T | p.Arg251Cys | p.R251C | Q8IUH2 | protein_coding | deleterious(0.03) | probably_damaging(0.98) | TCGA-AX-A05Z-01 | Endometrium | uterine corpus endometrioid carcinoma | Female | <65 | III/IV | Chemotherapy | adriamycin | SD | |
| CREG2 | SNV | Missense_Mutation | c.516C>A | p.Phe172Leu | p.F172L | Q8IUH2 | protein_coding | tolerated(0.05) | possibly_damaging(0.869) | TCGA-BS-A0UV-01 | Endometrium | uterine corpus endometrioid carcinoma | Female | <65 | III/IV | Unknown | Unknown | SD | |
| CREG2 | SNV | Missense_Mutation | c.521A>G | p.Tyr174Cys | p.Y174C | Q8IUH2 | protein_coding | deleterious(0.02) | probably_damaging(0.998) | TCGA-D1-A17H-01 | Endometrium | uterine corpus endometrioid carcinoma | Female | <65 | I/II | Unknown | Unknown | SD | |
| CREG2 | SNV | Missense_Mutation | c.516C>A | p.Phe172Leu | p.F172L | Q8IUH2 | protein_coding | tolerated(0.05) | possibly_damaging(0.869) | TCGA-EO-A22X-01 | Endometrium | uterine corpus endometrioid carcinoma | Female | <65 | III/IV | Unspecific | Carboplatin | Complete Response | |
| CREG2 | insertion | Frame_Shift_Ins | novel | c.617_618insA | p.Asn206LysfsTer4 | p.N206Kfs*4 | Q8IUH2 | protein_coding | TCGA-ED-A7PX-01 | Liver | liver hepatocellular carcinoma | Female | <65 | I/II | Unknown | Unknown | SD | ||
| CREG2 | SNV | Missense_Mutation | rs754794220 | c.856G>T | p.Val286Phe | p.V286F | Q8IUH2 | protein_coding | deleterious(0) | benign(0.388) | TCGA-38-4631-01 | Lung | lung adenocarcinoma | Female | >=65 | I/II | Unknown | Unknown | PD |
| CREG2 | SNV | Missense_Mutation | c.820G>T | p.Ala274Ser | p.A274S | Q8IUH2 | protein_coding | tolerated(0.08) | benign(0.079) | TCGA-64-1678-01 | Lung | lung adenocarcinoma | Female | >=65 | I/II | Chemotherapy | carboplatin | SD |
| Page: 1 2 |
Top |
Related drugs of malignant transformation related genes |
| Identification of chemicals and drugs interact with genes involved in malignant transfromation |
| (DGIdb 4.0) |
| Entrez ID | Symbol | Category | Interaction Types | Drug Claim Name | Drug Name | PMIDs |
| Page: 1 |

Copyright 2023-Present -The University of Texas Health Science Center at Houston |