Schematic overview of the cellular and molecular mechanisms involved in the cancer progression, including the proposed cellular and molecular mechanisms in cancer cells trajectory. AT1: alveolar type 1 cells; AT2: alveolar type 2 cells; AAH: atypical adenomatous hyperplasia; AIS: adenocarcinoma in situ; MIA: minimally invasive adenocarcinoma; IA: invasive adenocarcinoma; EMT: epithelial-mesenchymal transition

Home

Download

Statistics

Help

Contact

Center for Computational Systems Medicine
leaf

Gene summary

leaf

Malignant transformation analysis

leaf

Malignant transformation related pathway analysis

leaf

Cell-cell communication analysis

leaf

Single-cell gene regulatory network inference analysis

leaf

Somatic mutation of malignant transformation related genes

leaf

Related drugs of malignant transformation related genes

Gene: CREBZF

Gene summary for CREBZF

check button Gene summary.

Gene informationSpeciesHuman
Gene symbol

CREBZF

Gene ID

58487

Gene nameCREB/ATF bZIP transcription factor
Gene AliasSMILE
Cytomap11q14.1
Gene Typeprotein-coding
GO ID

GO:0006139

UniProtAcc

Q9NS37


Top

Malignant transformation analysis

check button Identification of the aberrant gene expression in precancerous and cancerous lesions by comparing the gene expression of stem-like cells in diseased tissues with normal stem cells
check button Malignant transformation involving gene list.
Entrez IDSymbolReplicatesSpeciesOrganTissueAdj P-valueLog2FCMalignancy
58487CREBZFLZE2THumanEsophagusESCC2.67e-076.34e-010.082
58487CREBZFLZE7THumanEsophagusESCC8.70e-061.74e-010.0667
58487CREBZFLZE8THumanEsophagusESCC2.42e-122.13e-010.067
58487CREBZFLZE20THumanEsophagusESCC1.41e-042.07e-020.0662
58487CREBZFLZE22THumanEsophagusESCC4.67e-031.36e-010.068
58487CREBZFLZE24THumanEsophagusESCC2.57e-176.26e-010.0596
58487CREBZFLZE6THumanEsophagusESCC1.17e-061.37e-010.0845
58487CREBZFP1T-EHumanEsophagusESCC3.38e-133.82e-010.0875
58487CREBZFP2T-EHumanEsophagusESCC2.32e-212.46e-010.1177
58487CREBZFP4T-EHumanEsophagusESCC4.54e-245.61e-010.1323
58487CREBZFP5T-EHumanEsophagusESCC2.89e-141.26e-010.1327
58487CREBZFP8T-EHumanEsophagusESCC5.10e-168.84e-020.0889
58487CREBZFP9T-EHumanEsophagusESCC5.05e-142.12e-010.1131
58487CREBZFP10T-EHumanEsophagusESCC4.20e-253.78e-010.116
58487CREBZFP11T-EHumanEsophagusESCC8.68e-124.86e-010.1426
58487CREBZFP12T-EHumanEsophagusESCC2.47e-183.22e-010.1122
58487CREBZFP15T-EHumanEsophagusESCC6.41e-137.59e-020.1149
58487CREBZFP16T-EHumanEsophagusESCC3.81e-203.47e-010.1153
58487CREBZFP17T-EHumanEsophagusESCC1.49e-111.86e-010.1278
58487CREBZFP20T-EHumanEsophagusESCC6.19e-251.92e-010.1124
Page: 1 2 3 4 5 6 

check button Transcriptomic changes along malignancy continuum.
TissueExpression DynamicsAbbreviation
EsophagusThe image shows the transcriptomic changes along malignancy continuum.log2FC in expression of this searched gene in stem-like cells from each diseased tissue sample relative to stem-like cells in normal samples in each tissue plotted against the malignancy continuum. Samples are colored based on if they are from different disease stage.
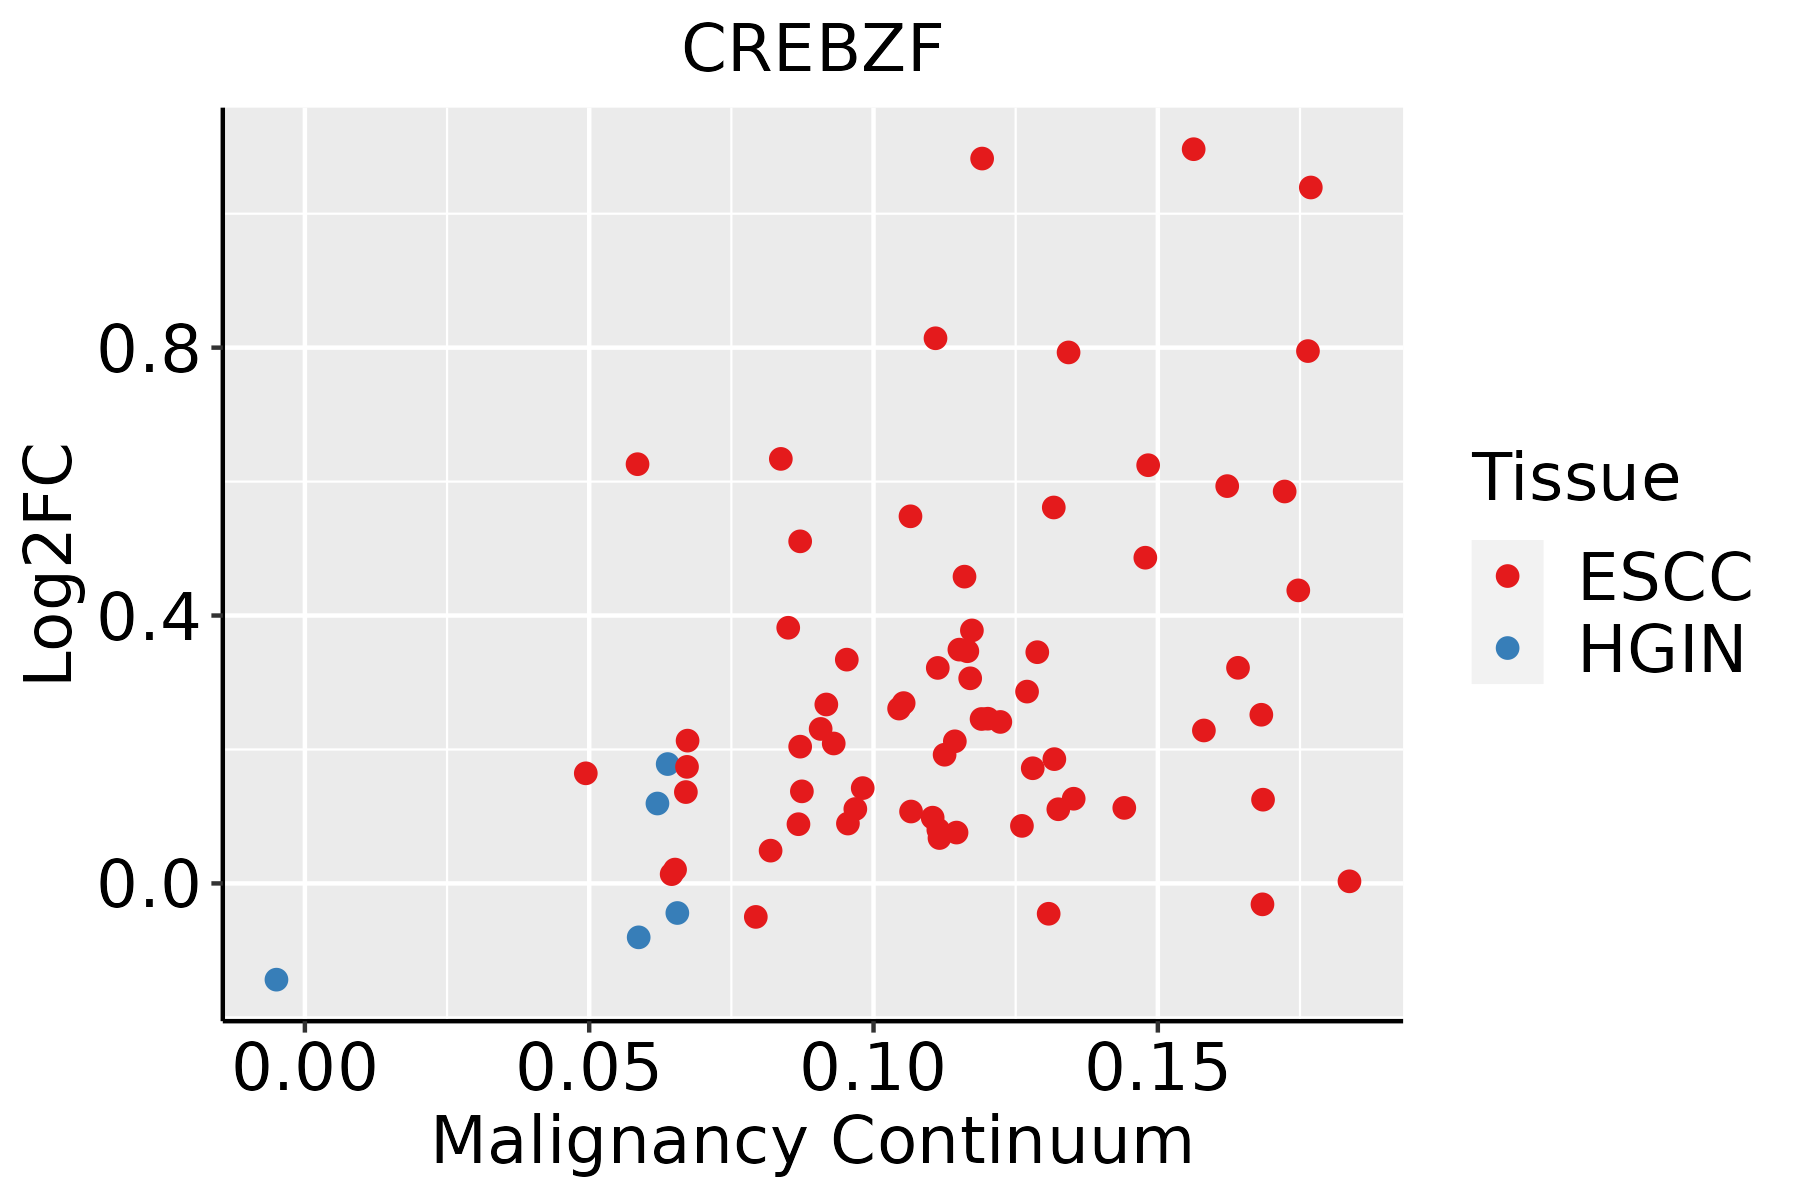
ESCC: Esophageal squamous cell carcinoma
HGIN: High-grade intraepithelial neoplasias
LGIN: Low-grade intraepithelial neoplasias
LiverThe image shows the transcriptomic changes along malignancy continuum.log2FC in expression of this searched gene in stem-like cells from each diseased tissue sample relative to stem-like cells in normal samples in each tissue plotted against the malignancy continuum. Samples are colored based on if they are from different disease stage.HCC: Hepatocellular carcinoma
NAFLD: Non-alcoholic fatty liver disease
Oral CavityThe image shows the transcriptomic changes along malignancy continuum.log2FC in expression of this searched gene in stem-like cells from each diseased tissue sample relative to stem-like cells in normal samples in each tissue plotted against the malignancy continuum. Samples are colored based on if they are from different disease stage.
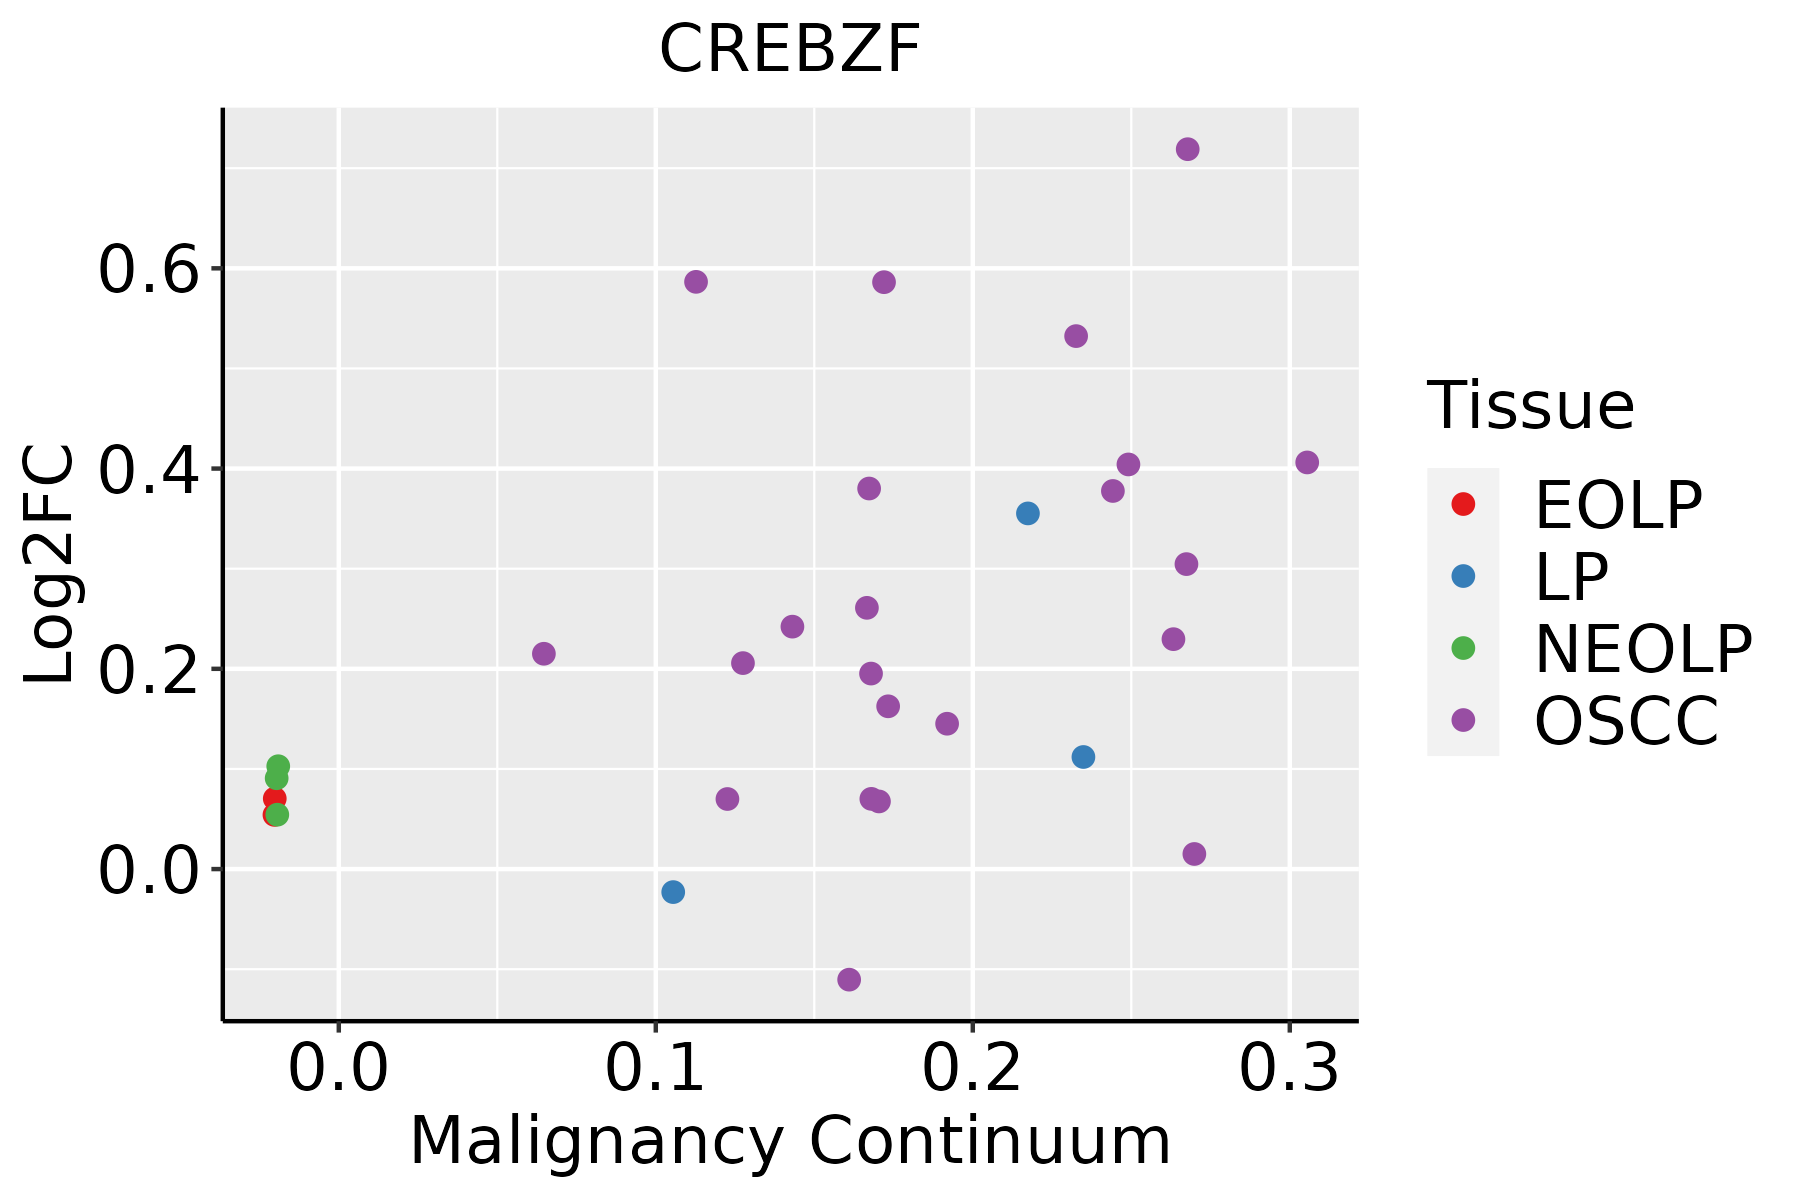
EOLP: Erosive Oral lichen planus
LP: leukoplakia
NEOLP: Non-erosive oral lichen planus
OSCC: Oral squamous cell carcinoma
ProstateThe image shows the transcriptomic changes along malignancy continuum.log2FC in expression of this searched gene in stem-like cells from each diseased tissue sample relative to stem-like cells in normal samples in each tissue plotted against the malignancy continuum. Samples are colored based on if they are from different disease stage.
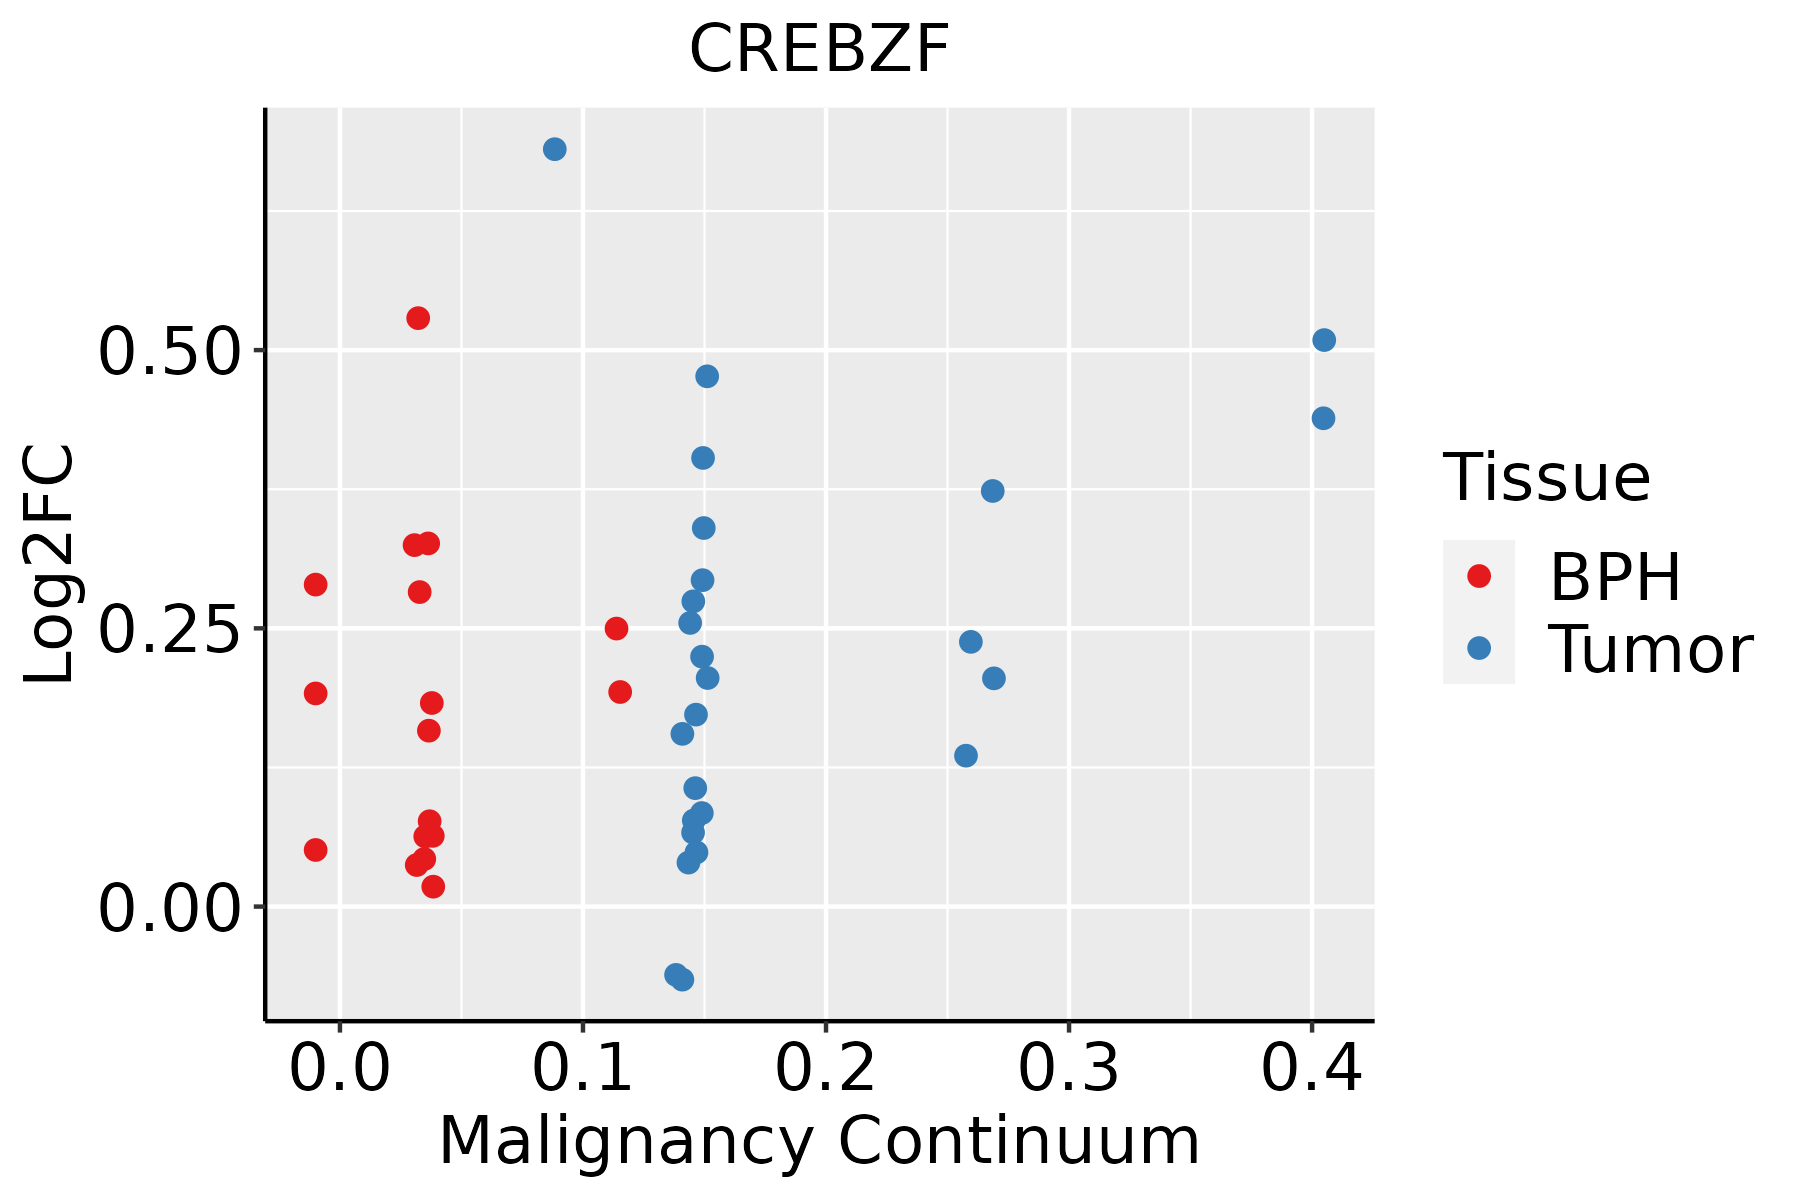
BPH: Benign Prostatic Hyperplasia
ThyroidThe image shows the transcriptomic changes along malignancy continuum.log2FC in expression of this searched gene in stem-like cells from each diseased tissue sample relative to stem-like cells in normal samples in each tissue plotted against the malignancy continuum. Samples are colored based on if they are from different disease stage.
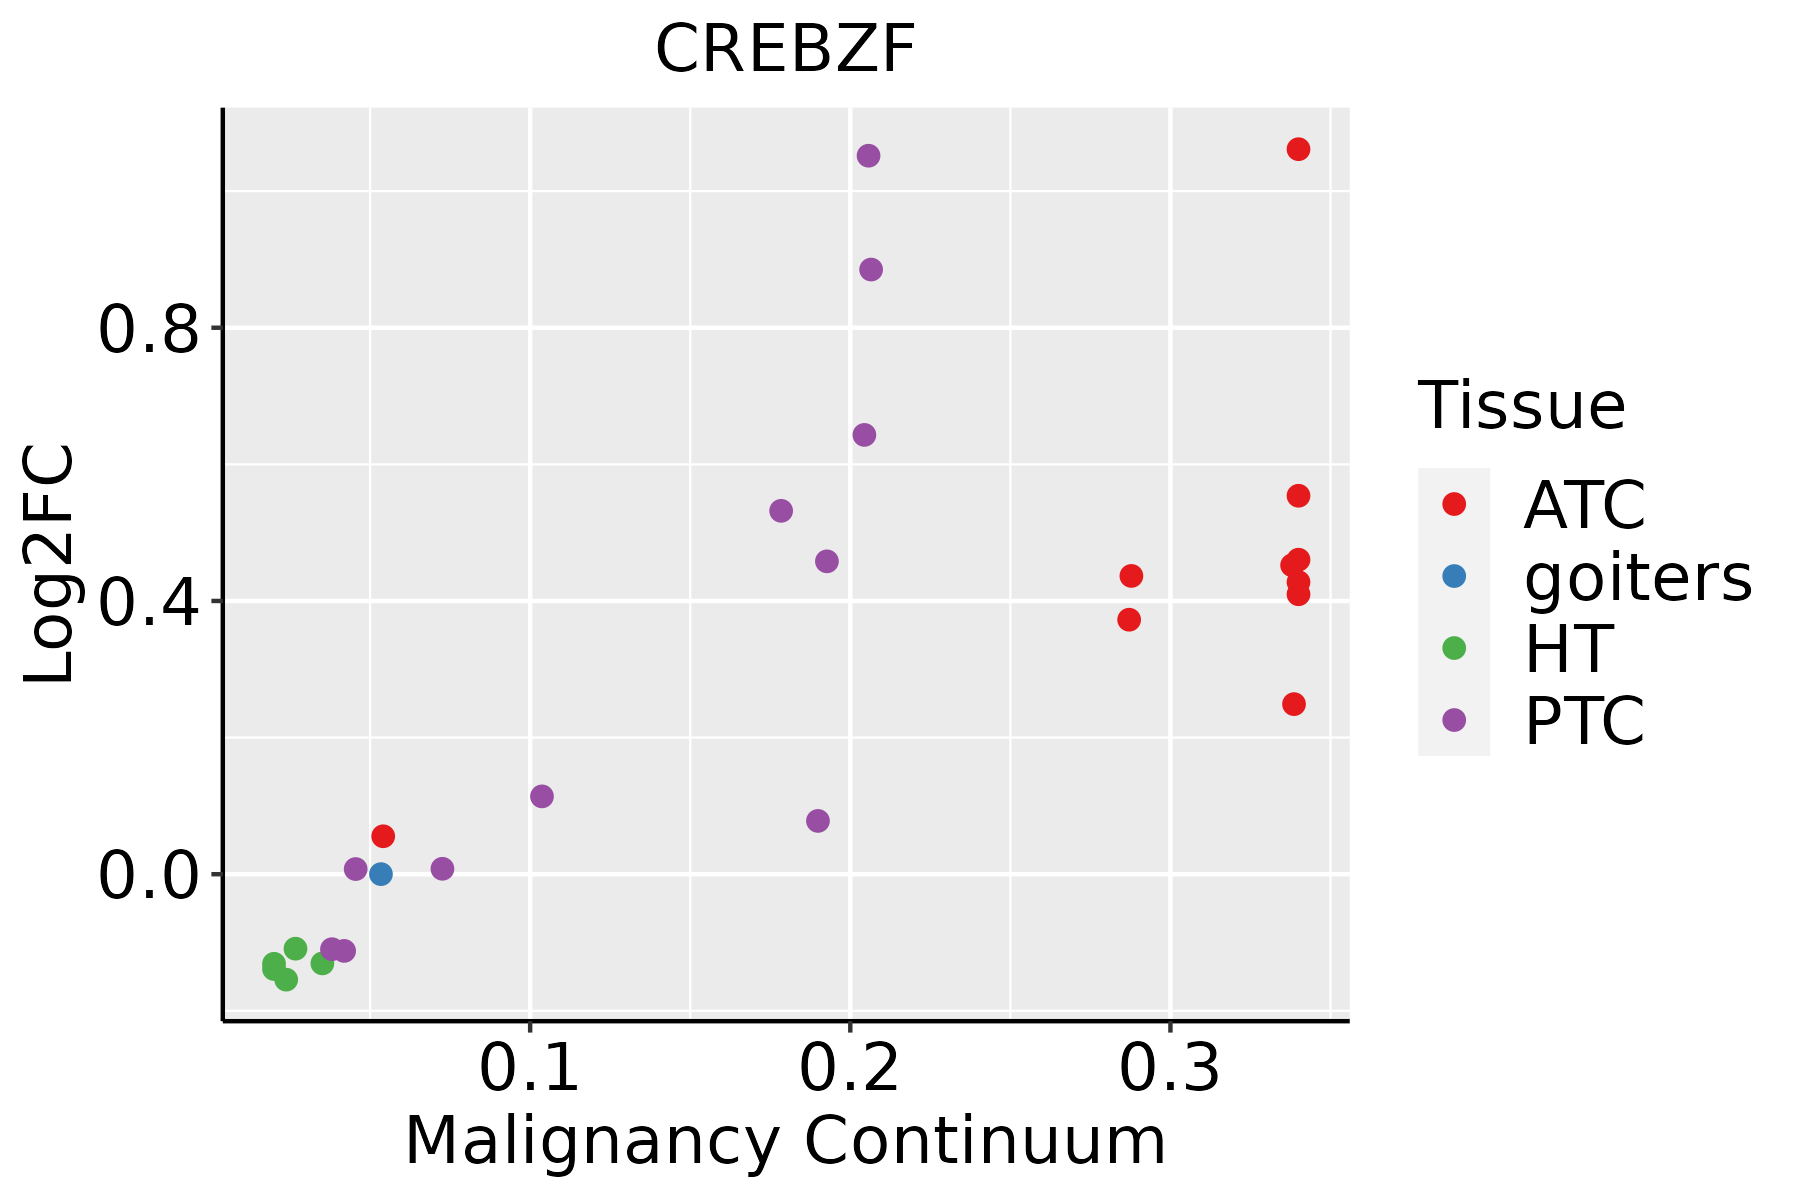
ATC: Anaplastic thyroid cancer
HT: Hashimoto's thyroiditis
PTC: Papillary thyroid cancer
∗log2FC in expression of this searched gene in stem-like cells from each diseased tissue sample relative to stem-like cells in normal samples in each tissue plotted against the malignancy continuum. Samples are colored based on if they are from different disease stage.

Top

Malignant transformation related pathway analysis

check buttonFind out the enriched GO biological processes and KEGG pathways involved in transition from healthy to precancer to cancer
check button Figure of enriched GO biological processes.
TissueDisease StageEnriched GO biological Processes
ColorectumADGO analysis - Figure of enriched GO biological processes: Top 15 enriched GO BP terms are showed in the bar plot of each disease state in each tissue. Each row represents a significant GO biological process which is colored according to the -log10(p.adjust).
ColorectumSERGO analysis - Figure of enriched GO biological processes: Top 15 enriched GO BP terms are showed in the bar plot of each disease state in each tissue. Each row represents a significant GO biological process which is colored according to the -log10(p.adjust).
ColorectumMSSGO analysis - Figure of enriched GO biological processes: Top 15 enriched GO BP terms are showed in the bar plot of each disease state in each tissue. Each row represents a significant GO biological process which is colored according to the -log10(p.adjust).
ColorectumMSI-HGO analysis - Figure of enriched GO biological processes: Top 15 enriched GO BP terms are showed in the bar plot of each disease state in each tissue. Each row represents a significant GO biological process which is colored according to the -log10(p.adjust).
ColorectumFAPGO analysis - Figure of enriched GO biological processes: Top 15 enriched GO BP terms are showed in the bar plot of each disease state in each tissue. Each row represents a significant GO biological process which is colored according to the -log10(p.adjust).
∗Top 15 enriched GO BP terms are showed in the bar plot of each disease state in each tissue. Each row represents a significant GO biological process which is colored according to the -log10(p.adjust).
Page: 1 2 3 4 5 6 7 8 9 

check button Enriched GO biological processes.
GO IDTissueDisease StageDescriptionGene RatioBg Ratiopvaluep.adjustCount
GO:000961518EsophagusESCCresponse to virus238/8552367/187236.65e-143.32e-12238
GO:00400295EsophagusESCCregulation of gene expression, epigenetic74/8552105/187232.24e-073.42e-0674
GO:00510908EsophagusESCCregulation of DNA-binding transcription factor activity252/8552440/187235.22e-076.97e-06252
GO:0045814EsophagusESCCnegative regulation of gene expression, epigenetic32/855250/187236.90e-032.52e-0232
GO:000961511LiverHCCresponse to virus210/7958367/187237.32e-091.86e-07210
GO:00510902LiverHCCregulation of DNA-binding transcription factor activity220/7958440/187238.04e-044.82e-03220
GO:0040029LiverHCCregulation of gene expression, epigenetic61/7958105/187239.02e-045.31e-0361
GO:000961515Oral cavityOSCCresponse to virus215/7305367/187231.63e-149.41e-13215
GO:00510907Oral cavityOSCCregulation of DNA-binding transcription factor activity221/7305440/187239.06e-071.23e-05221
GO:00400294Oral cavityOSCCregulation of gene expression, epigenetic59/7305105/187232.62e-041.68e-0359
GO:000961510ProstateBPHresponse to virus99/3107367/187232.82e-076.07e-0699
GO:00510906ProstateBPHregulation of DNA-binding transcription factor activity100/3107440/187234.71e-043.37e-03100
GO:000961514ProstateTumorresponse to virus101/3246367/187236.40e-071.32e-05101
GO:005109014ProstateTumorregulation of DNA-binding transcription factor activity105/3246440/187232.69e-042.23e-03105
GO:00400291ProstateTumorregulation of gene expression, epigenetic29/3246105/187235.72e-032.66e-0229
GO:000961520ThyroidPTCresponse to virus162/5968367/187234.52e-077.41e-06162
GO:00400297ThyroidPTCregulation of gene expression, epigenetic57/5968105/187231.60e-062.25e-0557
GO:005109016ThyroidPTCregulation of DNA-binding transcription factor activity178/5968440/187237.63e-056.54e-04178
GO:00458142ThyroidPTCnegative regulation of gene expression, epigenetic26/596850/187232.44e-031.27e-0226
GO:0009615111ThyroidATCresponse to virus173/6293367/187234.23e-087.71e-07173
Page: 1 2 

check button Enriched KEGG pathways.
Pathway IDTissueDisease StageDescriptionGene RatioBg Ratiopvaluep.adjustqvalueCount
Page: 1 

Top

Cell-cell communication analysis

check buttonIdentification of potential cell-cell interactions between two cell types and their ligand-receptor pairs for different disease states
LigandReceptorLRpairPathwayTissueDisease Stage
Page: 1 

Top

Single-cell gene regulatory network inference analysis

check buttonFind out the significant the regulons (TFs) and the target genes of each regulon across cell types for different disease states
TFCell TypeTissueDisease StageTarget GeneRSSRegulon Activity
CREBZFCD8TEFFBreastADJPNISR,ARGLU1,LUC7L3, etc.1.57e-01The dot plots of a searched regulon are shown for all cell subpopulations in each disease state of each tissue based on the regulon specific score inferred using pySCENIC and by calculating the average expression.
CREBZFCD8TEFFBreastIDCPNISR,ARGLU1,LUC7L3, etc.7.95e-02The dot plots of a searched regulon are shown for all cell subpopulations in each disease state of each tissue based on the regulon specific score inferred using pySCENIC and by calculating the average expression.
CREBZFMSC.MVASkinHealthyMETTL2A,AJUBA,TIPARP, etc.4.42e-02The dot plots of a searched regulon are shown for all cell subpopulations in each disease state of each tissue based on the regulon specific score inferred using pySCENIC and by calculating the average expression.
∗The dot plots of a searched regulon are shown for all cell subpopulations in each disease state of each tissue based on the regulon specific score inferred using pySCENIC and by calculating the average expression.
Page: 1 

Top

Somatic mutation of malignant transformation related genes

check buttonAnnotation of somatic variants for genes involved in malignant transformation
Hugo SymbolVariant ClassVariant ClassificationdbSNP RSHGVScHGVSpHGVSp ShortSWISSPROTBIOTYPESIFTPolyPhenTumor Sample BarcodeTissueHistologySexAgeStageTherapy TypesDrugsOutcome
CREBZFSNVMissense_Mutationrs768921956c.410N>Tp.Ser137Leup.S137LQ9NS37protein_codingdeleterious_low_confidence(0.02)probably_damaging(0.953)TCGA-AC-A6IV-01Breastbreast invasive carcinomaFemale<65I/IIUnknownUnknownSD
CREBZFinsertionNonsense_Mutationnovelc.569_570insTTTAGGCCAAGGTTAGTGAp.Gly191LeufsTer5p.G191Lfs*5Q9NS37protein_codingTCGA-BH-A0DS-01Breastbreast invasive carcinomaFemale>=65III/IVChemotherapycyclophosphamideSD
CREBZFinsertionFrame_Shift_Insnovelc.698_699insAp.Ser234GlufsTer70p.S234Efs*70Q9NS37protein_codingTCGA-E2-A570-01Breastbreast invasive carcinomaFemale<65I/IIHormone TherapyanastrozoleSD
CREBZFSNVMissense_Mutationc.896N>Gp.Ser299Trpp.S299WQ9NS37protein_codingdeleterious(0)possibly_damaging(0.59)TCGA-DR-A0ZM-01Cervixcervical & endocervical cancerFemale<65III/IVUnspecificCisplatinSD
CREBZFSNVMissense_Mutationc.395N>Tp.Ser132Leup.S132LQ9NS37protein_codingdeleterious_low_confidence(0.01)probably_damaging(0.953)TCGA-EK-A3GN-01Cervixcervical & endocervical cancerFemale<65III/IVUnknownUnknownSD
CREBZFSNVMissense_Mutationrs770349667c.65N>Ap.Ser22Asnp.S22NQ9NS37protein_codingtolerated_low_confidence(0.18)benign(0.035)TCGA-5M-AAT6-01Colorectumcolon adenocarcinomaFemale<65III/IVUnknownUnknownPD
CREBZFSNVMissense_Mutationc.331N>Ap.Leu111Metp.L111MQ9NS37protein_codingdeleterious(0.02)probably_damaging(0.99)TCGA-G4-6320-01Colorectumcolon adenocarcinomaMale>=65III/IVChemotherapyoxaliplatinSD
CREBZFSNVMissense_Mutationrs777311621c.76N>Ap.Ala26Thrp.A26TQ9NS37protein_codingdeleterious_low_confidence(0.04)benign(0.007)TCGA-NH-A5IV-01Colorectumcolon adenocarcinomaFemale>=65I/IIUnknownUnknownSD
CREBZFSNVMissense_Mutationc.883C>Tp.Leu295Phep.L295FQ9NS37protein_codingtolerated(0.11)probably_damaging(0.997)TCGA-F5-6814-01Colorectumrectum adenocarcinomaMale<65I/IIUnknownUnknownSD
CREBZFSNVMissense_Mutationnovelc.958G>Ap.Glu320Lysp.E320KQ9NS37protein_codingtolerated(0.06)benign(0.08)TCGA-A5-A0G1-01Endometriumuterine corpus endometrioid carcinomaFemale>=65I/IIUnknownUnknownSD
Page: 1 2 3 

Top

Related drugs of malignant transformation related genes

check buttonIdentification of chemicals and drugs interact with genes involved in malignant transfromation
(DGIdb 4.0)
Entrez IDSymbolCategoryInteraction TypesDrug Claim NameDrug NamePMIDs
Page: 1