
|
|||||
|
 | |
| |
| |
| |
| |
| |
|
Gene: CREBRF |
Gene summary for CREBRF |
| Gene information | Species | Human | Gene symbol | CREBRF | Gene ID | 153222 |
| Gene name | CREB3 regulatory factor | |
| Gene Alias | C5orf41 | |
| Cytomap | 5q35.1 | |
| Gene Type | protein-coding | GO ID | GO:0006139 | UniProtAcc | Q8IUR6 |
Top |
Malignant transformation analysis |
| Identification of the aberrant gene expression in precancerous and cancerous lesions by comparing the gene expression of stem-like cells in diseased tissues with normal stem cells |
| Entrez ID | Symbol | Replicates | Species | Organ | Tissue | Adj P-value | Log2FC | Malignancy |
| 153222 | CREBRF | LZE3D | Human | Esophagus | HGIN | 2.01e-02 | 6.19e-01 | 0.0668 |
| 153222 | CREBRF | LZE4T | Human | Esophagus | ESCC | 2.77e-03 | 5.10e-02 | 0.0811 |
| 153222 | CREBRF | LZE7T | Human | Esophagus | ESCC | 8.44e-06 | 8.86e-02 | 0.0667 |
| 153222 | CREBRF | LZE8T | Human | Esophagus | ESCC | 5.08e-07 | 7.75e-02 | 0.067 |
| 153222 | CREBRF | LZE20T | Human | Esophagus | ESCC | 8.56e-03 | 4.22e-02 | 0.0662 |
| 153222 | CREBRF | LZE24T | Human | Esophagus | ESCC | 3.57e-13 | 2.15e-01 | 0.0596 |
| 153222 | CREBRF | LZE6T | Human | Esophagus | ESCC | 8.31e-04 | 8.18e-02 | 0.0845 |
| 153222 | CREBRF | P1T-E | Human | Esophagus | ESCC | 4.41e-07 | 1.53e-01 | 0.0875 |
| 153222 | CREBRF | P2T-E | Human | Esophagus | ESCC | 4.68e-16 | 2.22e-01 | 0.1177 |
| 153222 | CREBRF | P4T-E | Human | Esophagus | ESCC | 1.10e-08 | -2.62e-02 | 0.1323 |
| 153222 | CREBRF | P5T-E | Human | Esophagus | ESCC | 6.10e-16 | -3.51e-02 | 0.1327 |
| 153222 | CREBRF | P8T-E | Human | Esophagus | ESCC | 2.13e-11 | 2.77e-01 | 0.0889 |
| 153222 | CREBRF | P9T-E | Human | Esophagus | ESCC | 3.83e-07 | 6.72e-02 | 0.1131 |
| 153222 | CREBRF | P10T-E | Human | Esophagus | ESCC | 2.61e-16 | 2.55e-01 | 0.116 |
| 153222 | CREBRF | P11T-E | Human | Esophagus | ESCC | 1.35e-05 | 2.61e-01 | 0.1426 |
| 153222 | CREBRF | P12T-E | Human | Esophagus | ESCC | 1.96e-17 | 2.14e-01 | 0.1122 |
| 153222 | CREBRF | P15T-E | Human | Esophagus | ESCC | 1.25e-18 | 4.49e-01 | 0.1149 |
| 153222 | CREBRF | P16T-E | Human | Esophagus | ESCC | 4.09e-15 | 2.39e-01 | 0.1153 |
| 153222 | CREBRF | P17T-E | Human | Esophagus | ESCC | 1.61e-02 | 4.01e-02 | 0.1278 |
| 153222 | CREBRF | P20T-E | Human | Esophagus | ESCC | 2.05e-07 | 5.59e-02 | 0.1124 |
| Page: 1 2 3 4 5 6 |
| Tissue | Expression Dynamics | Abbreviation |
| Esophagus | 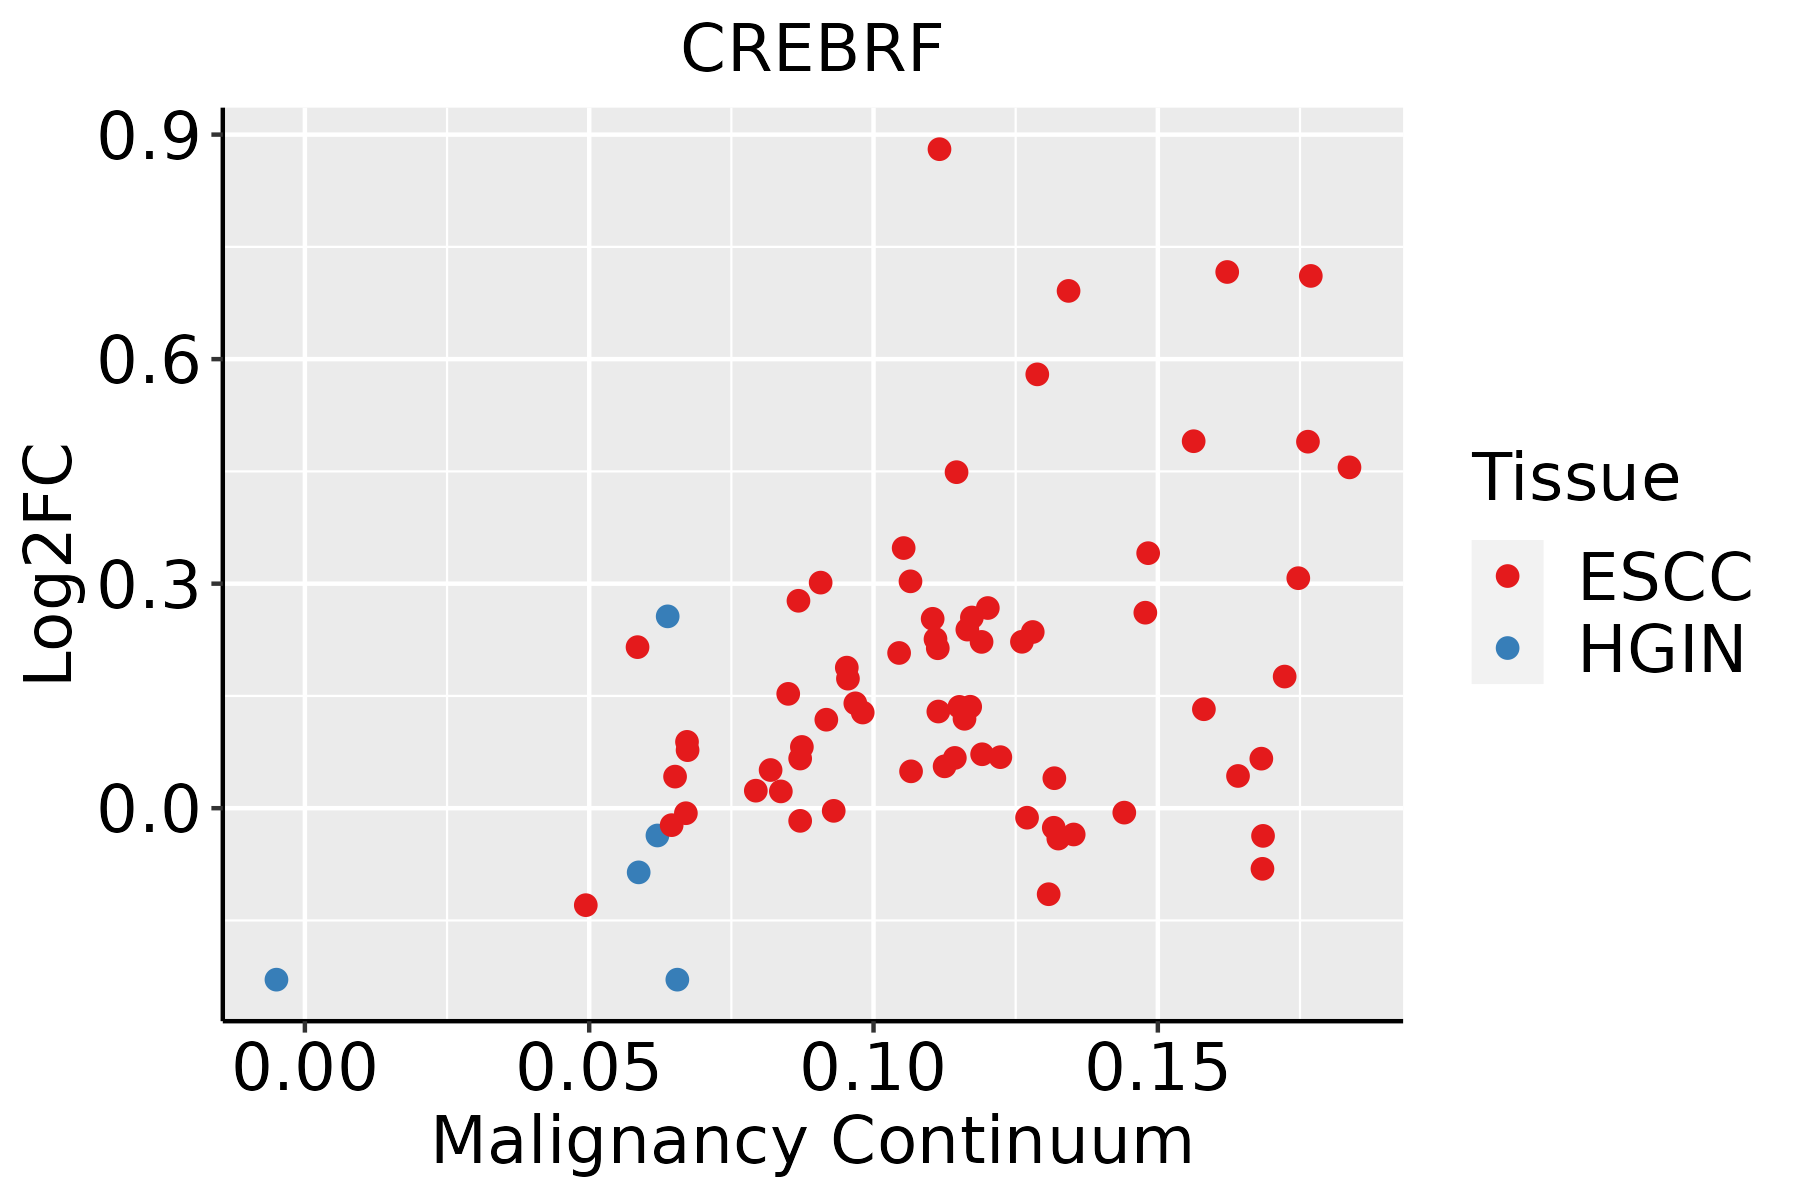 | ESCC: Esophageal squamous cell carcinoma |
| HGIN: High-grade intraepithelial neoplasias | ||
| LGIN: Low-grade intraepithelial neoplasias | ||
| Liver |  | HCC: Hepatocellular carcinoma |
| NAFLD: Non-alcoholic fatty liver disease | ||
| Prostate | 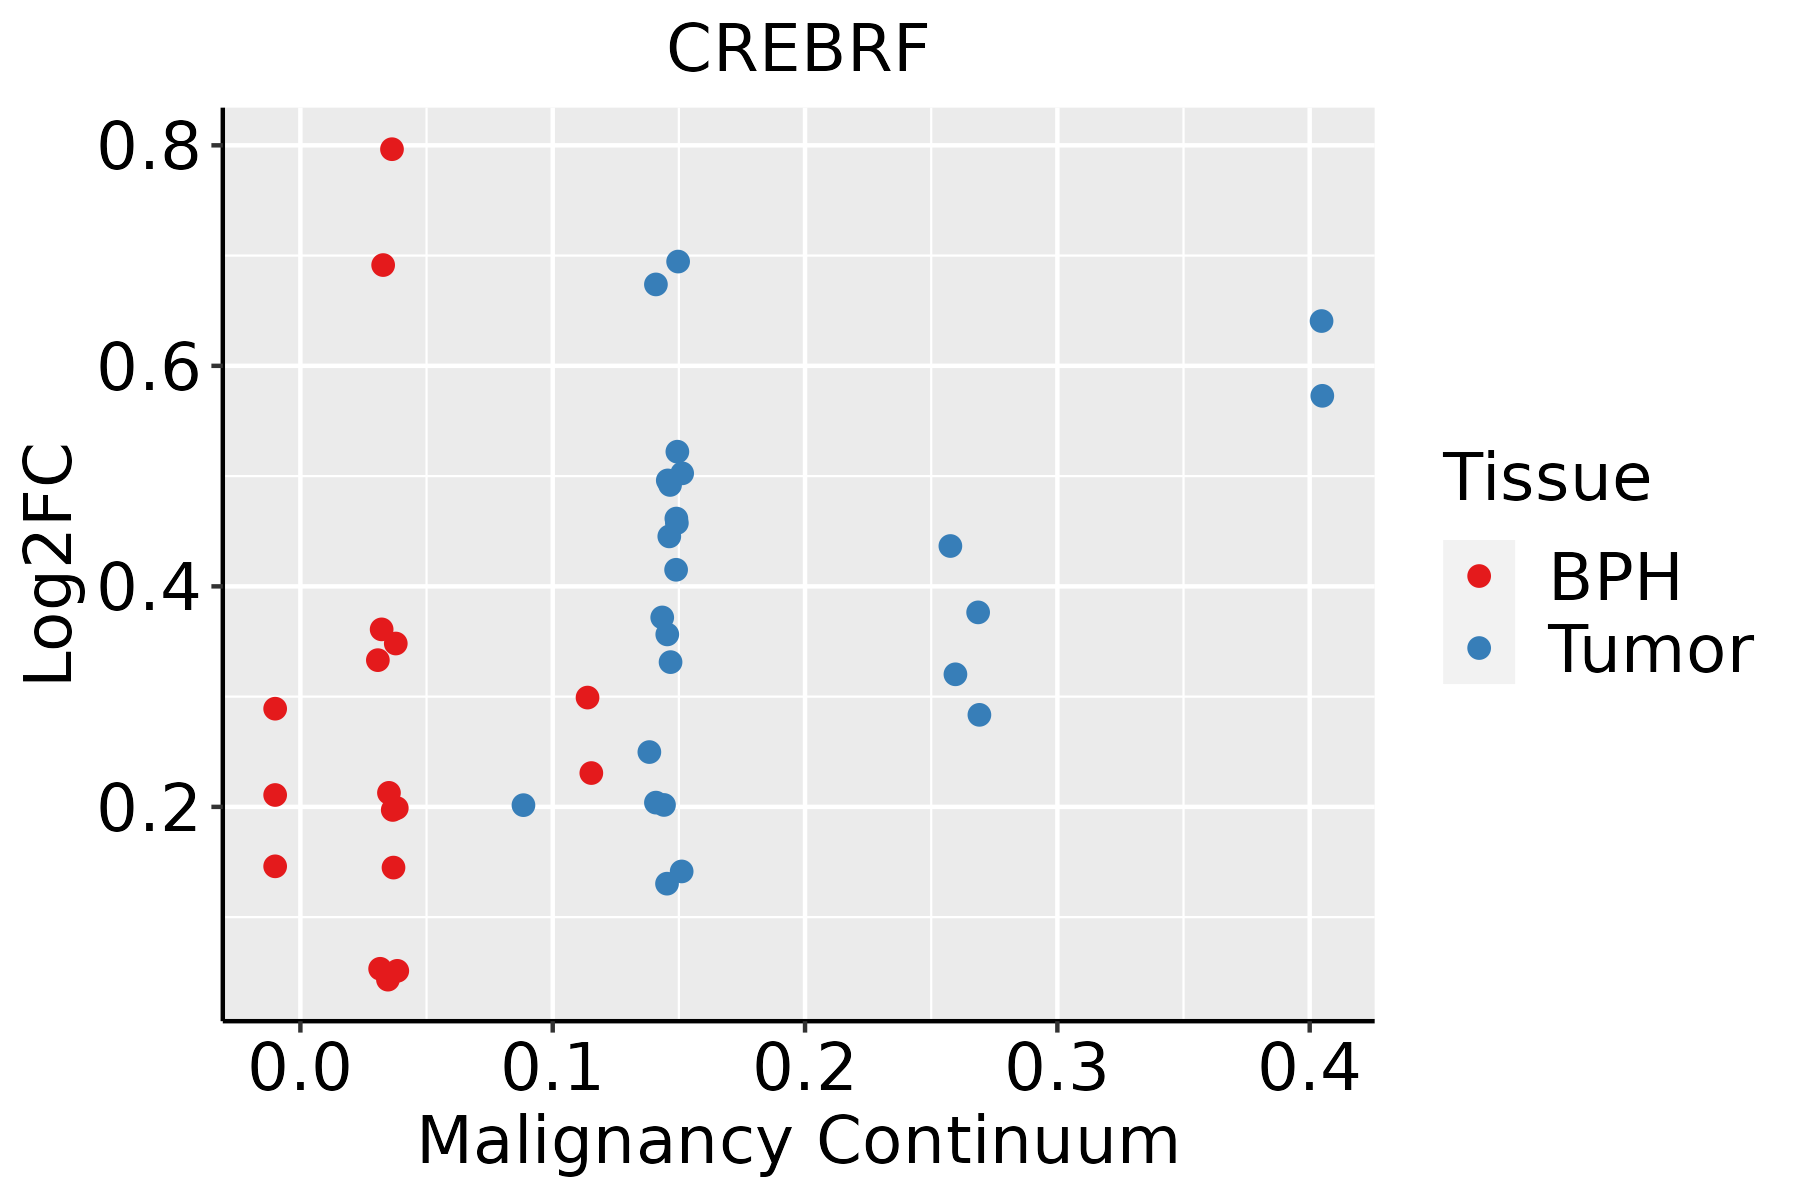 | BPH: Benign Prostatic Hyperplasia |
| Thyroid |  | ATC: Anaplastic thyroid cancer |
| HT: Hashimoto's thyroiditis | ||
| PTC: Papillary thyroid cancer |
| ∗log2FC in expression of this searched gene in stem-like cells from each diseased tissue sample relative to stem-like cells in normal samples in each tissue plotted against the malignancy continuum. Samples are colored based on if they are from different disease stage. |
Top |
Malignant transformation related pathway analysis |
| Find out the enriched GO biological processes and KEGG pathways involved in transition from healthy to precancer to cancer |
| Tissue | Disease Stage | Enriched GO biological Processes |
| Colorectum | AD |  |
| Colorectum | SER |  |
| Colorectum | MSS |  |
| Colorectum | MSI-H |  |
| Colorectum | FAP |  |
| ∗Top 15 enriched GO BP terms are showed in the bar plot of each disease state in each tissue. Each row represents a significant GO biological process which is colored according to the -log10(p.adjust). |
| Page: 1 2 3 4 5 6 7 8 9 |
| GO ID | Tissue | Disease Stage | Description | Gene Ratio | Bg Ratio | pvalue | p.adjust | Count |
| GO:0035966111 | Esophagus | ESCC | response to topologically incorrect protein | 125/8552 | 159/18723 | 1.44e-17 | 1.27e-15 | 125 |
| GO:0006986111 | Esophagus | ESCC | response to unfolded protein | 107/8552 | 137/18723 | 7.01e-15 | 3.87e-13 | 107 |
| GO:00359667 | Liver | Cirrhotic | response to topologically incorrect protein | 91/4634 | 159/18723 | 2.07e-18 | 3.60e-16 | 91 |
| GO:00069867 | Liver | Cirrhotic | response to unfolded protein | 79/4634 | 137/18723 | 1.99e-16 | 2.49e-14 | 79 |
| GO:003596612 | Liver | HCC | response to topologically incorrect protein | 123/7958 | 159/18723 | 2.60e-19 | 3.44e-17 | 123 |
| GO:000698612 | Liver | HCC | response to unfolded protein | 103/7958 | 137/18723 | 6.50e-15 | 4.48e-13 | 103 |
| GO:000698618 | Prostate | BPH | response to unfolded protein | 61/3107 | 137/18723 | 1.40e-14 | 1.80e-12 | 61 |
| GO:003596618 | Prostate | BPH | response to topologically incorrect protein | 66/3107 | 159/18723 | 7.35e-14 | 7.98e-12 | 66 |
| GO:000698619 | Prostate | Tumor | response to unfolded protein | 65/3246 | 137/18723 | 3.56e-16 | 7.50e-14 | 65 |
| GO:003596619 | Prostate | Tumor | response to topologically incorrect protein | 69/3246 | 159/18723 | 1.28e-14 | 1.81e-12 | 69 |
| GO:000698627 | Thyroid | HT | response to unfolded protein | 34/1272 | 137/18723 | 2.36e-11 | 3.75e-09 | 34 |
| GO:003596627 | Thyroid | HT | response to topologically incorrect protein | 35/1272 | 159/18723 | 4.27e-10 | 4.95e-08 | 35 |
| GO:0035966113 | Thyroid | PTC | response to topologically incorrect protein | 101/5968 | 159/18723 | 2.00e-16 | 1.66e-14 | 101 |
| GO:0006986113 | Thyroid | PTC | response to unfolded protein | 87/5968 | 137/18723 | 2.46e-14 | 1.57e-12 | 87 |
| GO:003596633 | Thyroid | ATC | response to topologically incorrect protein | 102/6293 | 159/18723 | 2.87e-15 | 1.99e-13 | 102 |
| GO:000698633 | Thyroid | ATC | response to unfolded protein | 88/6293 | 137/18723 | 2.04e-13 | 9.91e-12 | 88 |
| Page: 1 |
| Pathway ID | Tissue | Disease Stage | Description | Gene Ratio | Bg Ratio | pvalue | p.adjust | qvalue | Count |
| Page: 1 |
Top |
Cell-cell communication analysis |
| Identification of potential cell-cell interactions between two cell types and their ligand-receptor pairs for different disease states |
| Ligand | Receptor | LRpair | Pathway | Tissue | Disease Stage |
| Page: 1 |
Top |
Single-cell gene regulatory network inference analysis |
| Find out the significant the regulons (TFs) and the target genes of each regulon across cell types for different disease states |
| TF | Cell Type | Tissue | Disease Stage | Target Gene | RSS | Regulon Activity |
| ∗The dot plots of a searched regulon are shown for all cell subpopulations in each disease state of each tissue based on the regulon specific score inferred using pySCENIC and by calculating the average expression. |
| Page: 1 |
Top |
Somatic mutation of malignant transformation related genes |
| Annotation of somatic variants for genes involved in malignant transformation |
| Hugo Symbol | Variant Class | Variant Classification | dbSNP RS | HGVSc | HGVSp | HGVSp Short | SWISSPROT | BIOTYPE | SIFT | PolyPhen | Tumor Sample Barcode | Tissue | Histology | Sex | Age | Stage | Therapy Types | Drugs | Outcome |
| CREBRF | SNV | Missense_Mutation | novel | c.1459N>C | p.Asp487His | p.D487H | Q8IUR6 | protein_coding | deleterious(0) | probably_damaging(0.997) | TCGA-5L-AAT1-01 | Breast | breast invasive carcinoma | Female | <65 | III/IV | Hormone Therapy | letrozol | SD |
| CREBRF | SNV | Missense_Mutation | novel | c.118N>A | p.Asp40Asn | p.D40N | Q8IUR6 | protein_coding | deleterious_low_confidence(0.01) | possibly_damaging(0.528) | TCGA-AN-A046-01 | Breast | breast invasive carcinoma | Female | >=65 | I/II | Unknown | Unknown | SD |
| CREBRF | SNV | Missense_Mutation | c.1521N>C | p.Lys507Asn | p.K507N | Q8IUR6 | protein_coding | deleterious(0.01) | benign(0.24) | TCGA-AO-A0JC-01 | Breast | breast invasive carcinoma | Female | <65 | I/II | Chemotherapy | fluorouracil | SD | |
| CREBRF | SNV | Missense_Mutation | c.1306N>C | p.Glu436Gln | p.E436Q | Q8IUR6 | protein_coding | tolerated(0.33) | probably_damaging(0.986) | TCGA-BH-A1F0-01 | Breast | breast invasive carcinoma | Female | >=65 | I/II | Unknown | Unknown | PD | |
| CREBRF | SNV | Missense_Mutation | c.371C>G | p.Ser124Cys | p.S124C | Q8IUR6 | protein_coding | deleterious_low_confidence(0) | probably_damaging(0.997) | TCGA-E2-A155-01 | Breast | breast invasive carcinoma | Female | <65 | I/II | Chemotherapy | cytoxan | SD | |
| CREBRF | insertion | In_Frame_Ins | novel | c.1116_1117insGATTCACACAGATGCAGCAAAGGAGAACACCTGCTACTGTGG | p.Gly372_Phe373insAspSerHisArgCysSerLysGlyGluHisLeuLeuLeuTrp | p.G372_F373insDSHRCSKGEHLLLW | Q8IUR6 | protein_coding | TCGA-A2-A0EV-01 | Breast | breast invasive carcinoma | Female | >=65 | I/II | Unknown | Unknown | SD | ||
| CREBRF | SNV | Missense_Mutation | c.1015N>G | p.Leu339Val | p.L339V | Q8IUR6 | protein_coding | deleterious(0) | probably_damaging(0.992) | TCGA-IR-A3LK-01 | Cervix | cervical & endocervical cancer | Female | >=65 | I/II | Chemotherapy | cisplatin | PD | |
| CREBRF | SNV | Missense_Mutation | c.880N>C | p.Glu294Gln | p.E294Q | Q8IUR6 | protein_coding | tolerated_low_confidence(0.11) | possibly_damaging(0.87) | TCGA-Q1-A73O-01 | Cervix | cervical & endocervical cancer | Female | <65 | I/II | Chemotherapy | cisplatin | CR | |
| CREBRF | SNV | Missense_Mutation | c.1108N>A | p.Asp370Asn | p.D370N | Q8IUR6 | protein_coding | deleterious(0.04) | probably_damaging(0.99) | TCGA-Q1-A73O-01 | Cervix | cervical & endocervical cancer | Female | <65 | I/II | Chemotherapy | cisplatin | CR | |
| CREBRF | SNV | Missense_Mutation | c.658T>C | p.Tyr220His | p.Y220H | Q8IUR6 | protein_coding | tolerated_low_confidence(0.47) | benign(0) | TCGA-AA-3663-01 | Colorectum | colon adenocarcinoma | Male | <65 | I/II | Unknown | Unknown | SD |
| Page: 1 2 3 4 5 6 |
Top |
Related drugs of malignant transformation related genes |
| Identification of chemicals and drugs interact with genes involved in malignant transfromation |
| (DGIdb 4.0) |
| Entrez ID | Symbol | Category | Interaction Types | Drug Claim Name | Drug Name | PMIDs |
| Page: 1 |

Copyright 2023-Present -The University of Texas Health Science Center at Houston |