
|
|||||
|
 | |
| |
| |
| |
| |
| |
|
Gene: CREBL2 |
Gene summary for CREBL2 |
| Gene information | Species | Human | Gene symbol | CREBL2 | Gene ID | 1389 |
| Gene name | cAMP responsive element binding protein like 2 | |
| Gene Alias | CREBL2 | |
| Cytomap | 12p13.1 | |
| Gene Type | protein-coding | GO ID | GO:0001932 | UniProtAcc | O60519 |
Top |
Malignant transformation analysis |
| Identification of the aberrant gene expression in precancerous and cancerous lesions by comparing the gene expression of stem-like cells in diseased tissues with normal stem cells |
| Entrez ID | Symbol | Replicates | Species | Organ | Tissue | Adj P-value | Log2FC | Malignancy |
| 1389 | CREBL2 | LZE24T | Human | Esophagus | ESCC | 4.34e-08 | 7.76e-02 | 0.0596 |
| 1389 | CREBL2 | P1T-E | Human | Esophagus | ESCC | 3.10e-03 | 1.01e-01 | 0.0875 |
| 1389 | CREBL2 | P2T-E | Human | Esophagus | ESCC | 4.90e-26 | 3.66e-01 | 0.1177 |
| 1389 | CREBL2 | P4T-E | Human | Esophagus | ESCC | 5.30e-09 | 2.54e-01 | 0.1323 |
| 1389 | CREBL2 | P5T-E | Human | Esophagus | ESCC | 3.15e-05 | 2.52e-03 | 0.1327 |
| 1389 | CREBL2 | P8T-E | Human | Esophagus | ESCC | 1.54e-17 | 7.96e-02 | 0.0889 |
| 1389 | CREBL2 | P9T-E | Human | Esophagus | ESCC | 1.56e-04 | 8.10e-02 | 0.1131 |
| 1389 | CREBL2 | P10T-E | Human | Esophagus | ESCC | 6.80e-24 | 2.79e-01 | 0.116 |
| 1389 | CREBL2 | P11T-E | Human | Esophagus | ESCC | 1.01e-02 | 1.59e-01 | 0.1426 |
| 1389 | CREBL2 | P12T-E | Human | Esophagus | ESCC | 4.83e-19 | 2.99e-01 | 0.1122 |
| 1389 | CREBL2 | P15T-E | Human | Esophagus | ESCC | 4.72e-11 | 2.15e-01 | 0.1149 |
| 1389 | CREBL2 | P16T-E | Human | Esophagus | ESCC | 8.42e-46 | 1.00e+00 | 0.1153 |
| 1389 | CREBL2 | P17T-E | Human | Esophagus | ESCC | 4.35e-02 | 5.31e-02 | 0.1278 |
| 1389 | CREBL2 | P19T-E | Human | Esophagus | ESCC | 2.27e-02 | 1.61e-01 | 0.1662 |
| 1389 | CREBL2 | P20T-E | Human | Esophagus | ESCC | 1.64e-03 | 2.55e-02 | 0.1124 |
| 1389 | CREBL2 | P21T-E | Human | Esophagus | ESCC | 1.52e-08 | 2.77e-03 | 0.1617 |
| 1389 | CREBL2 | P22T-E | Human | Esophagus | ESCC | 1.54e-24 | 3.17e-01 | 0.1236 |
| 1389 | CREBL2 | P23T-E | Human | Esophagus | ESCC | 3.30e-02 | 5.72e-02 | 0.108 |
| 1389 | CREBL2 | P24T-E | Human | Esophagus | ESCC | 1.60e-12 | 6.12e-02 | 0.1287 |
| 1389 | CREBL2 | P26T-E | Human | Esophagus | ESCC | 9.57e-18 | 1.39e-01 | 0.1276 |
| Page: 1 2 3 4 |
| Tissue | Expression Dynamics | Abbreviation |
| Esophagus | 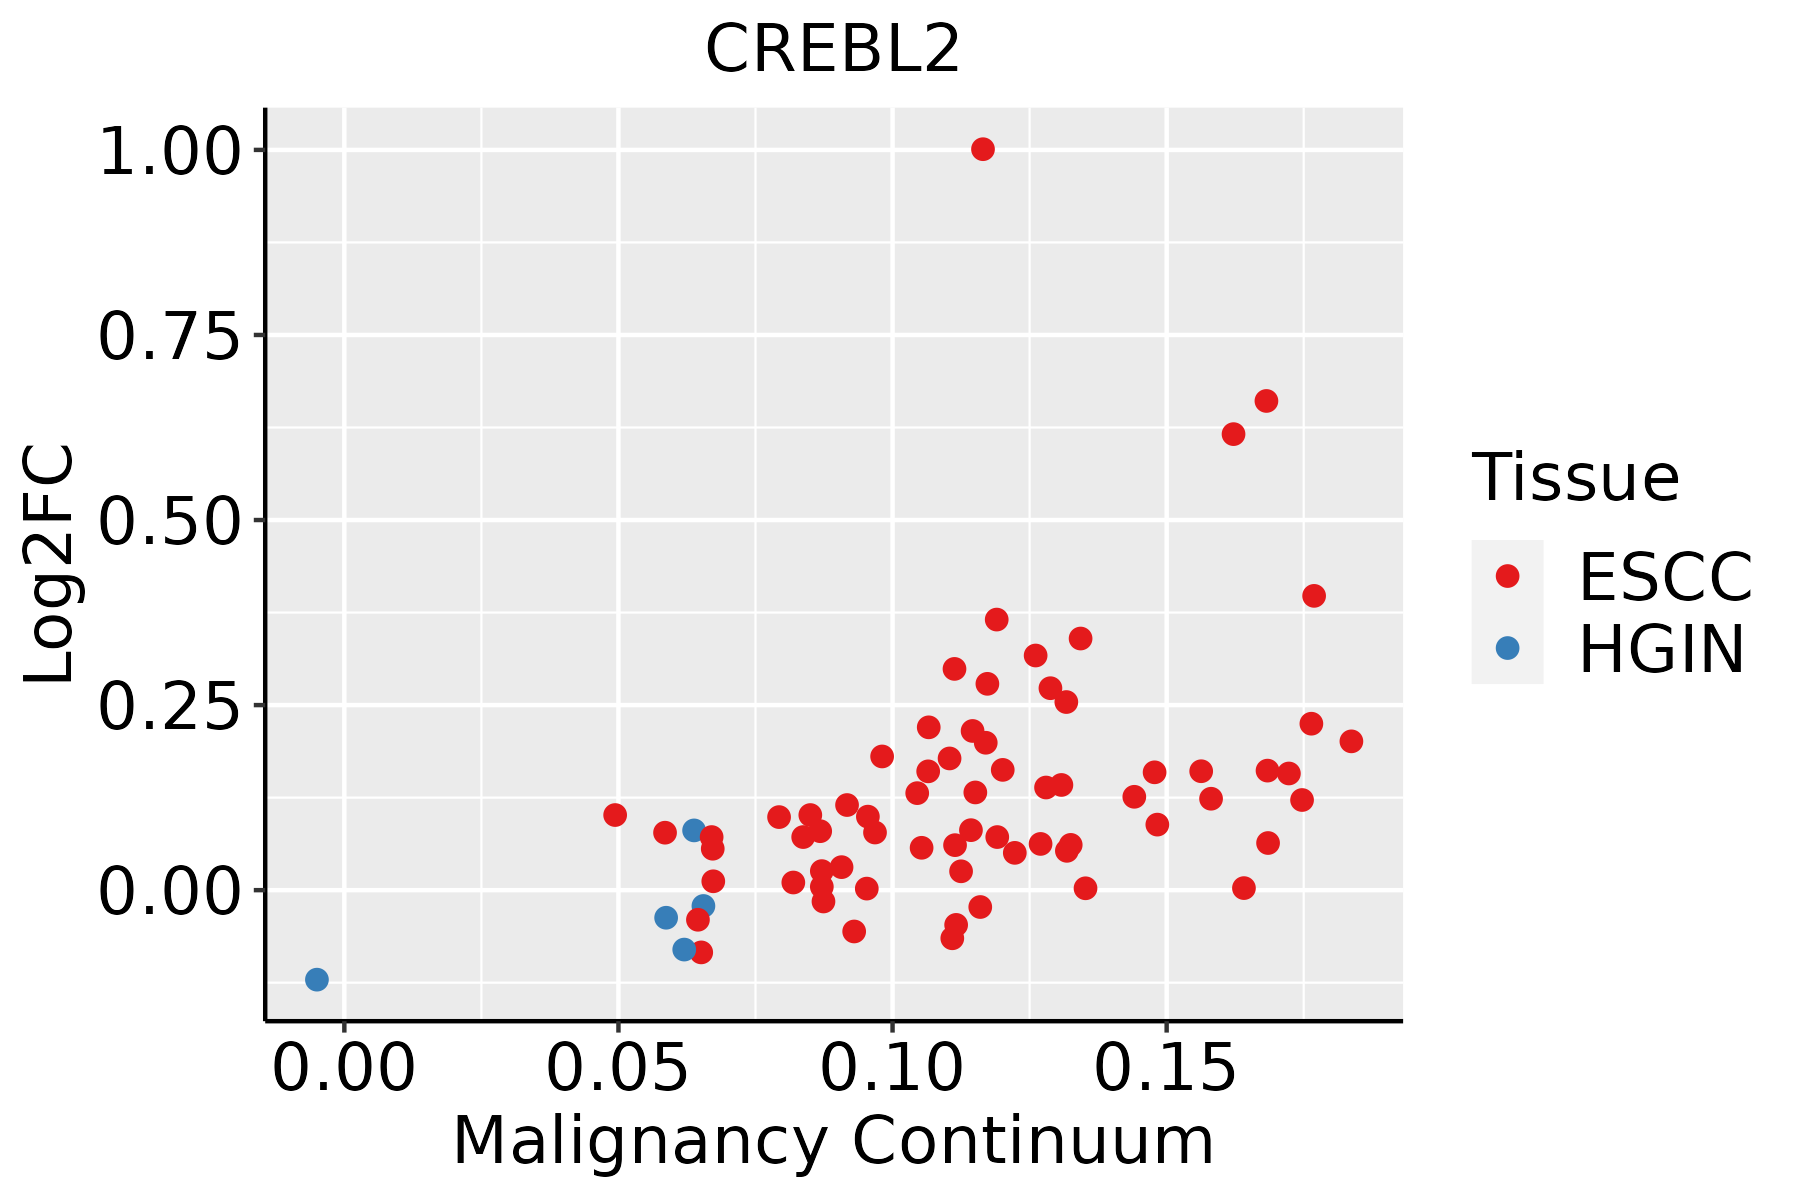 | ESCC: Esophageal squamous cell carcinoma |
| HGIN: High-grade intraepithelial neoplasias | ||
| LGIN: Low-grade intraepithelial neoplasias | ||
| Liver | 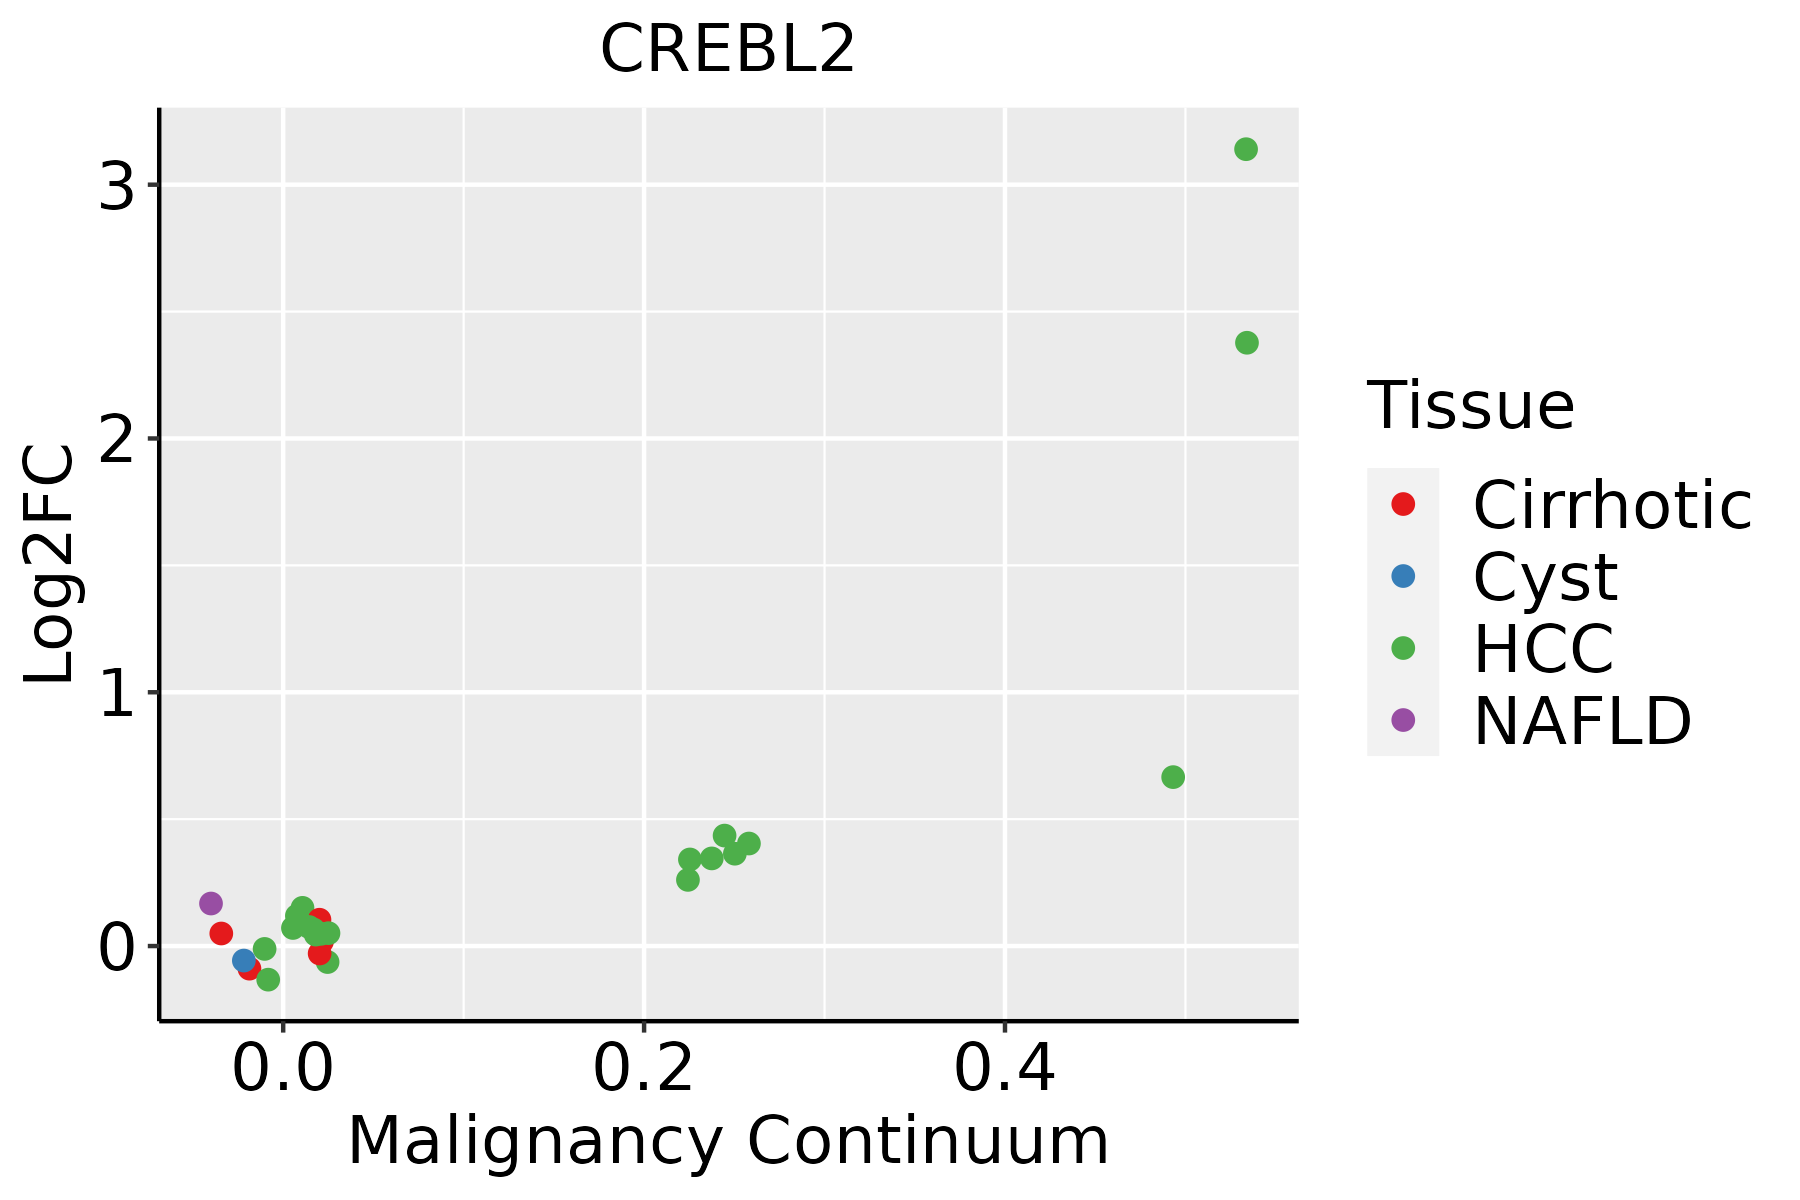 | HCC: Hepatocellular carcinoma |
| NAFLD: Non-alcoholic fatty liver disease | ||
| Oral Cavity | 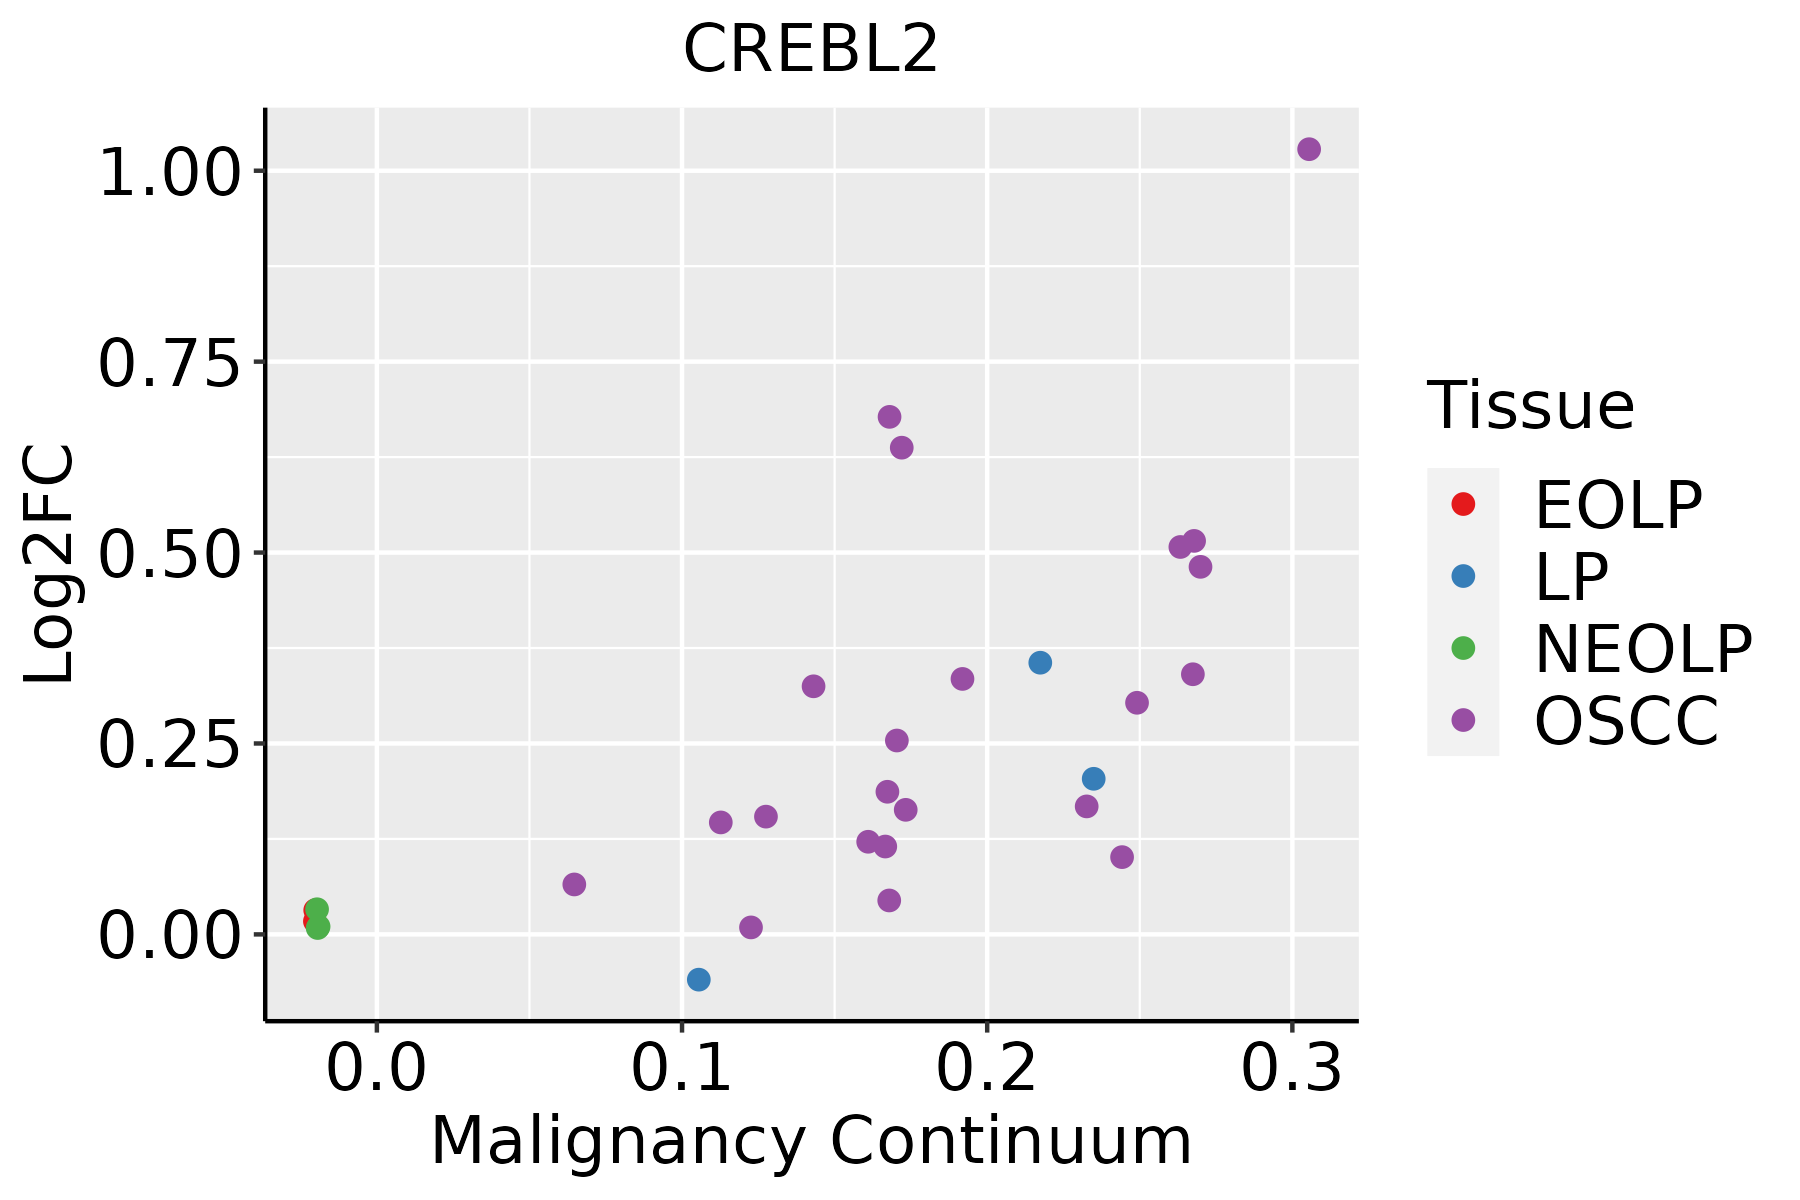 | EOLP: Erosive Oral lichen planus |
| LP: leukoplakia | ||
| NEOLP: Non-erosive oral lichen planus | ||
| OSCC: Oral squamous cell carcinoma |
| ∗log2FC in expression of this searched gene in stem-like cells from each diseased tissue sample relative to stem-like cells in normal samples in each tissue plotted against the malignancy continuum. Samples are colored based on if they are from different disease stage. |
Top |
Malignant transformation related pathway analysis |
| Find out the enriched GO biological processes and KEGG pathways involved in transition from healthy to precancer to cancer |
| Tissue | Disease Stage | Enriched GO biological Processes |
| Colorectum | AD |  |
| Colorectum | SER |  |
| Colorectum | MSS |  |
| Colorectum | MSI-H |  |
| Colorectum | FAP |  |
| ∗Top 15 enriched GO BP terms are showed in the bar plot of each disease state in each tissue. Each row represents a significant GO biological process which is colored according to the -log10(p.adjust). |
| Page: 1 2 3 4 5 6 7 8 9 |
| GO ID | Tissue | Disease Stage | Description | Gene Ratio | Bg Ratio | pvalue | p.adjust | Count |
| GO:0031647111 | Esophagus | ESCC | regulation of protein stability | 223/8552 | 298/18723 | 5.76e-25 | 1.52e-22 | 223 |
| GO:0050821111 | Esophagus | ESCC | protein stabilization | 140/8552 | 191/18723 | 6.50e-15 | 3.61e-13 | 140 |
| GO:00182099 | Esophagus | ESCC | peptidyl-serine modification | 196/8552 | 338/18723 | 3.07e-06 | 3.47e-05 | 196 |
| GO:001810515 | Esophagus | ESCC | peptidyl-serine phosphorylation | 184/8552 | 315/18723 | 3.22e-06 | 3.61e-05 | 184 |
| GO:00454449 | Esophagus | ESCC | fat cell differentiation | 135/8552 | 229/18723 | 3.38e-05 | 2.78e-04 | 135 |
| GO:00456007 | Esophagus | ESCC | positive regulation of fat cell differentiation | 46/8552 | 66/18723 | 6.72e-05 | 5.11e-04 | 46 |
| GO:00455984 | Esophagus | ESCC | regulation of fat cell differentiation | 79/8552 | 139/18723 | 5.23e-03 | 1.97e-02 | 79 |
| GO:00331355 | Esophagus | ESCC | regulation of peptidyl-serine phosphorylation | 81/8552 | 144/18723 | 6.79e-03 | 2.48e-02 | 81 |
| GO:00192168 | Esophagus | ESCC | regulation of lipid metabolic process | 172/8552 | 331/18723 | 1.20e-02 | 4.02e-02 | 172 |
| GO:00331383 | Esophagus | ESCC | positive regulation of peptidyl-serine phosphorylation | 61/8552 | 108/18723 | 1.54e-02 | 4.96e-02 | 61 |
| GO:003164712 | Liver | Cirrhotic | regulation of protein stability | 144/4634 | 298/18723 | 6.74e-19 | 1.28e-16 | 144 |
| GO:005082112 | Liver | Cirrhotic | protein stabilization | 97/4634 | 191/18723 | 6.67e-15 | 6.97e-13 | 97 |
| GO:001921611 | Liver | Cirrhotic | regulation of lipid metabolic process | 119/4634 | 331/18723 | 3.05e-06 | 5.39e-05 | 119 |
| GO:004689011 | Liver | Cirrhotic | regulation of lipid biosynthetic process | 67/4634 | 171/18723 | 2.00e-05 | 2.65e-04 | 67 |
| GO:00454442 | Liver | Cirrhotic | fat cell differentiation | 73/4634 | 229/18723 | 8.57e-03 | 3.97e-02 | 73 |
| GO:003164722 | Liver | HCC | regulation of protein stability | 211/7958 | 298/18723 | 2.29e-23 | 5.01e-21 | 211 |
| GO:005082122 | Liver | HCC | protein stabilization | 139/7958 | 191/18723 | 1.61e-17 | 1.71e-15 | 139 |
| GO:00192162 | Liver | HCC | regulation of lipid metabolic process | 181/7958 | 331/18723 | 4.58e-06 | 5.79e-05 | 181 |
| GO:001810511 | Liver | HCC | peptidyl-serine phosphorylation | 169/7958 | 315/18723 | 3.86e-05 | 3.81e-04 | 169 |
| GO:001820911 | Liver | HCC | peptidyl-serine modification | 177/7958 | 338/18723 | 1.45e-04 | 1.17e-03 | 177 |
| Page: 1 2 |
| Pathway ID | Tissue | Disease Stage | Description | Gene Ratio | Bg Ratio | pvalue | p.adjust | qvalue | Count |
| Page: 1 |
Top |
Cell-cell communication analysis |
| Identification of potential cell-cell interactions between two cell types and their ligand-receptor pairs for different disease states |
| Ligand | Receptor | LRpair | Pathway | Tissue | Disease Stage |
| Page: 1 |
Top |
Single-cell gene regulatory network inference analysis |
| Find out the significant the regulons (TFs) and the target genes of each regulon across cell types for different disease states |
| TF | Cell Type | Tissue | Disease Stage | Target Gene | RSS | Regulon Activity |
| CREBL2 | CD8TEXINT | Skin | ADJ | TMEM176B,TMEM176A,IL7R, etc. | 1.57e-01 |  |
| CREBL2 | MAST | Skin | AK | TMEM176B,TMEM176A,IL7R, etc. | 4.49e-02 |  |
| CREBL2 | CD8TEXINT | Skin | AK | TMEM176B,TMEM176A,IL7R, etc. | 1.47e-02 | |
| CREBL2 | INMON | Skin | cSCC | TMEM176B,TMEM176A,IL7R, etc. | 2.41e-01 |  |
| CREBL2 | CD8TEXINT | Skin | cSCC | TMEM176B,TMEM176A,IL7R, etc. | 1.01e-01 | |
| CREBL2 | LC | Skin | Healthy | TMEM176B,TMEM176A,IL7R, etc. | 9.69e-02 |  |
| CREBL2 | CD8TEXINT | Skin | Healthy | TMEM176B,TMEM176A,IL7R, etc. | 1.46e-01 | |
| CREBL2 | CD8TEXP | Skin | Healthy | TMEM176B,TMEM176A,IL7R, etc. | 8.29e-02 | |
| CREBL2 | CD8TEXINT | Skin | SCCIS | TMEM176B,TMEM176A,IL7R, etc. | 2.32e-01 |  |
| CREBL2 | MAST | Skin | SCCIS | TMEM176B,TMEM176A,IL7R, etc. | 9.14e-02 | |
| ∗The dot plots of a searched regulon are shown for all cell subpopulations in each disease state of each tissue based on the regulon specific score inferred using pySCENIC and by calculating the average expression. |
| Page: 1 2 |
Top |
Somatic mutation of malignant transformation related genes |
| Annotation of somatic variants for genes involved in malignant transformation |
| Hugo Symbol | Variant Class | Variant Classification | dbSNP RS | HGVSc | HGVSp | HGVSp Short | SWISSPROT | BIOTYPE | SIFT | PolyPhen | Tumor Sample Barcode | Tissue | Histology | Sex | Age | Stage | Therapy Types | Drugs | Outcome |
| CREBL2 | SNV | Missense_Mutation | c.128N>A | p.Arg43Gln | p.R43Q | O60519 | protein_coding | deleterious(0) | probably_damaging(0.988) | TCGA-AN-A046-01 | Breast | breast invasive carcinoma | Female | >=65 | I/II | Unknown | Unknown | SD | |
| CREBL2 | SNV | Missense_Mutation | c.173N>T | p.Arg58Leu | p.R58L | O60519 | protein_coding | deleterious(0) | benign(0.38) | TCGA-EW-A1P5-01 | Breast | breast invasive carcinoma | Female | >=65 | I/II | Hormone Therapy | anastrozole | SD | |
| CREBL2 | SNV | Missense_Mutation | novel | c.226N>C | p.Cys76Arg | p.C76R | O60519 | protein_coding | deleterious(0.01) | probably_damaging(0.979) | TCGA-AA-3984-01 | Colorectum | colon adenocarcinoma | Female | <65 | I/II | Unknown | Unknown | SD |
| CREBL2 | SNV | Missense_Mutation | novel | c.268G>A | p.Ala90Thr | p.A90T | O60519 | protein_coding | tolerated(0.2) | benign(0.003) | TCGA-A5-A1OF-01 | Endometrium | uterine corpus endometrioid carcinoma | Female | <65 | I/II | Unknown | Unknown | SD |
| CREBL2 | SNV | Missense_Mutation | c.353A>G | p.Asn118Ser | p.N118S | O60519 | protein_coding | tolerated_low_confidence(0.46) | benign(0.003) | TCGA-AP-A054-01 | Endometrium | uterine corpus endometrioid carcinoma | Female | <65 | III/IV | Chemotherapy | carboplatin | PD | |
| CREBL2 | SNV | Missense_Mutation | novel | c.269N>T | p.Ala90Val | p.A90V | O60519 | protein_coding | tolerated(0.06) | benign(0.099) | TCGA-AX-A1CE-01 | Endometrium | uterine corpus endometrioid carcinoma | Female | <65 | I/II | Unspecific | Paclitaxel | SD |
| CREBL2 | SNV | Missense_Mutation | novel | c.191C>T | p.Ala64Val | p.A64V | O60519 | protein_coding | tolerated(0.17) | benign(0.015) | TCGA-AX-A2HD-01 | Endometrium | uterine corpus endometrioid carcinoma | Female | >=65 | III/IV | Unknown | Unknown | SD |
| CREBL2 | SNV | Missense_Mutation | c.30N>C | p.Lys10Asn | p.K10N | O60519 | protein_coding | deleterious_low_confidence(0.02) | probably_damaging(0.981) | TCGA-B5-A11E-01 | Endometrium | uterine corpus endometrioid carcinoma | Female | <65 | I/II | Unknown | Unknown | SD | |
| CREBL2 | SNV | Missense_Mutation | c.141N>T | p.Arg47Ser | p.R47S | O60519 | protein_coding | deleterious(0) | probably_damaging(0.987) | TCGA-D1-A15V-01 | Endometrium | uterine corpus endometrioid carcinoma | Female | >=65 | I/II | Chemotherapy | taxol | SD | |
| CREBL2 | SNV | Missense_Mutation | c.128G>A | p.Arg43Gln | p.R43Q | O60519 | protein_coding | deleterious(0) | probably_damaging(0.988) | TCGA-KK-A59V-01 | Prostate | prostate adenocarcinoma | Male | <65 | 9 | Unknown | Unknown | SD |
| Page: 1 |
Top |
Related drugs of malignant transformation related genes |
| Identification of chemicals and drugs interact with genes involved in malignant transfromation |
| (DGIdb 4.0) |
| Entrez ID | Symbol | Category | Interaction Types | Drug Claim Name | Drug Name | PMIDs |
| Page: 1 |

Copyright 2023-Present -The University of Texas Health Science Center at Houston |