
|
|||||
|
 | |
| |
| |
| |
| |
| |
|
Gene: CREB5 |
Gene summary for CREB5 |
| Gene information | Species | Human | Gene symbol | CREB5 | Gene ID | 9586 |
| Gene name | cAMP responsive element binding protein 5 | |
| Gene Alias | CRE-BPA | |
| Cytomap | 7p15.1-p14.3 | |
| Gene Type | protein-coding | GO ID | GO:0006139 | UniProtAcc | Q02930 |
Top |
Malignant transformation analysis |
| Identification of the aberrant gene expression in precancerous and cancerous lesions by comparing the gene expression of stem-like cells in diseased tissues with normal stem cells |
| Entrez ID | Symbol | Replicates | Species | Organ | Tissue | Adj P-value | Log2FC | Malignancy |
| 9586 | CREB5 | AEH-subject1 | Human | Endometrium | AEH | 3.32e-05 | 3.70e-01 | -0.3059 |
| 9586 | CREB5 | AEH-subject4 | Human | Endometrium | AEH | 1.32e-09 | 5.52e-01 | -0.2657 |
| 9586 | CREB5 | EEC-subject1 | Human | Endometrium | EEC | 2.58e-29 | 8.07e-01 | -0.2682 |
| 9586 | CREB5 | EEC-subject2 | Human | Endometrium | EEC | 5.67e-04 | 2.76e-01 | -0.2607 |
| 9586 | CREB5 | EEC-subject5 | Human | Endometrium | EEC | 6.73e-10 | 4.46e-01 | -0.249 |
| 9586 | CREB5 | GSM5276934 | Human | Endometrium | EEC | 6.99e-08 | 3.42e-01 | -0.0913 |
| 9586 | CREB5 | GSM6177620_NYU_UCEC1_lib1_lib1 | Human | Endometrium | EEC | 3.50e-06 | -7.42e-04 | -0.1869 |
| 9586 | CREB5 | GSM6177620_NYU_UCEC1_lib2_lib2 | Human | Endometrium | EEC | 1.08e-03 | -4.42e-02 | -0.1875 |
| 9586 | CREB5 | GSM6177620_NYU_UCEC1_lib3_lib3 | Human | Endometrium | EEC | 6.43e-09 | -7.92e-02 | -0.1883 |
| 9586 | CREB5 | GSM6177622_NYU_UCEC3_lib1_lib1 | Human | Endometrium | EEC | 7.17e-07 | -9.28e-02 | -0.1917 |
| 9586 | CREB5 | GSM6177622_NYU_UCEC3_lib2_lib2 | Human | Endometrium | EEC | 2.37e-06 | -8.93e-02 | -0.1916 |
| 9586 | CREB5 | LZE4T | Human | Esophagus | ESCC | 1.12e-11 | 7.42e-01 | 0.0811 |
| 9586 | CREB5 | P2T-E | Human | Esophagus | ESCC | 2.87e-30 | 8.02e-01 | 0.1177 |
| 9586 | CREB5 | P4T-E | Human | Esophagus | ESCC | 2.91e-15 | 6.94e-01 | 0.1323 |
| 9586 | CREB5 | P5T-E | Human | Esophagus | ESCC | 3.40e-19 | 3.97e-01 | 0.1327 |
| 9586 | CREB5 | P9T-E | Human | Esophagus | ESCC | 2.13e-38 | 1.31e+00 | 0.1131 |
| 9586 | CREB5 | P10T-E | Human | Esophagus | ESCC | 9.45e-56 | 1.15e+00 | 0.116 |
| 9586 | CREB5 | P11T-E | Human | Esophagus | ESCC | 6.00e-18 | 1.23e+00 | 0.1426 |
| 9586 | CREB5 | P12T-E | Human | Esophagus | ESCC | 8.78e-22 | 5.86e-01 | 0.1122 |
| 9586 | CREB5 | P19T-E | Human | Esophagus | ESCC | 3.47e-10 | 1.43e+00 | 0.1662 |
| Page: 1 2 3 4 5 6 |
| Tissue | Expression Dynamics | Abbreviation |
| Endometrium |  | AEH: Atypical endometrial hyperplasia |
| EEC: Endometrioid Cancer | ||
| Esophagus | 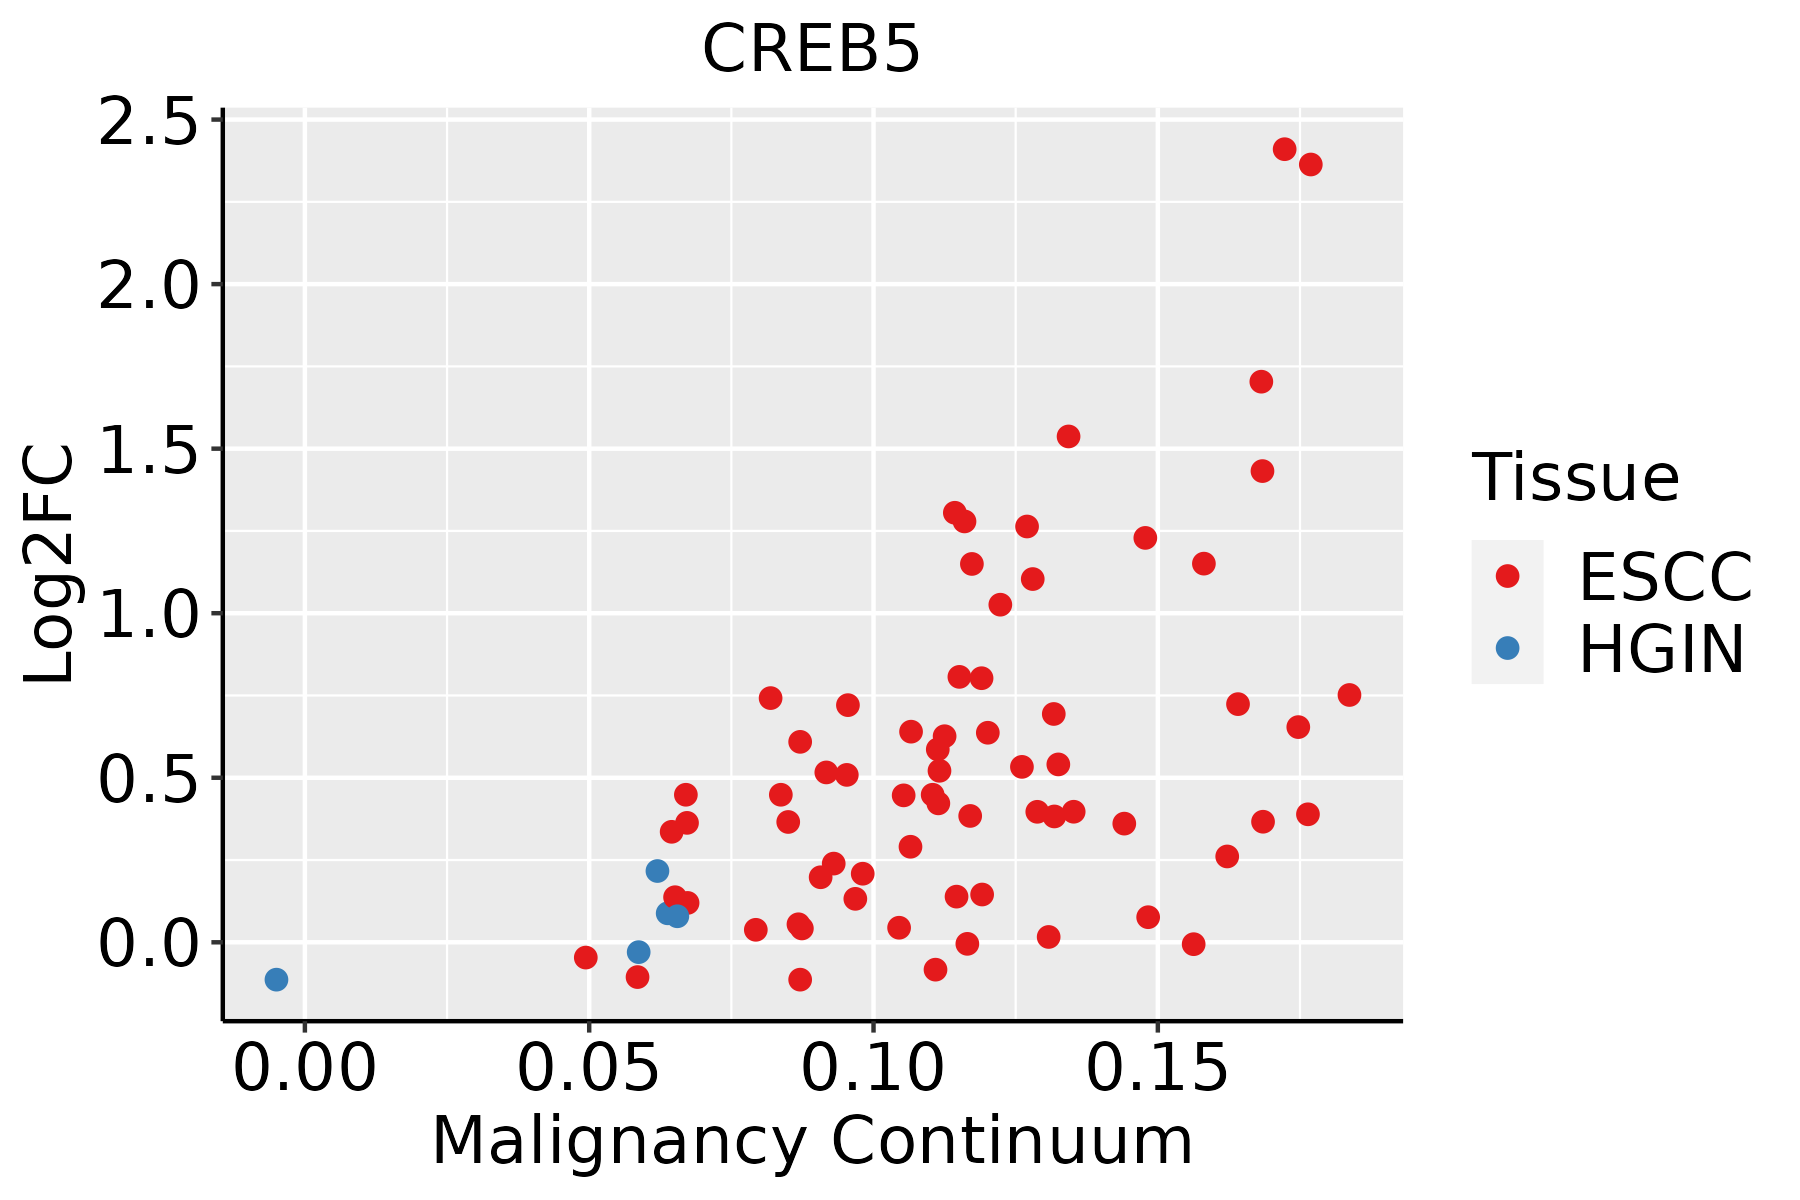 | ESCC: Esophageal squamous cell carcinoma |
| HGIN: High-grade intraepithelial neoplasias | ||
| LGIN: Low-grade intraepithelial neoplasias | ||
| Liver | 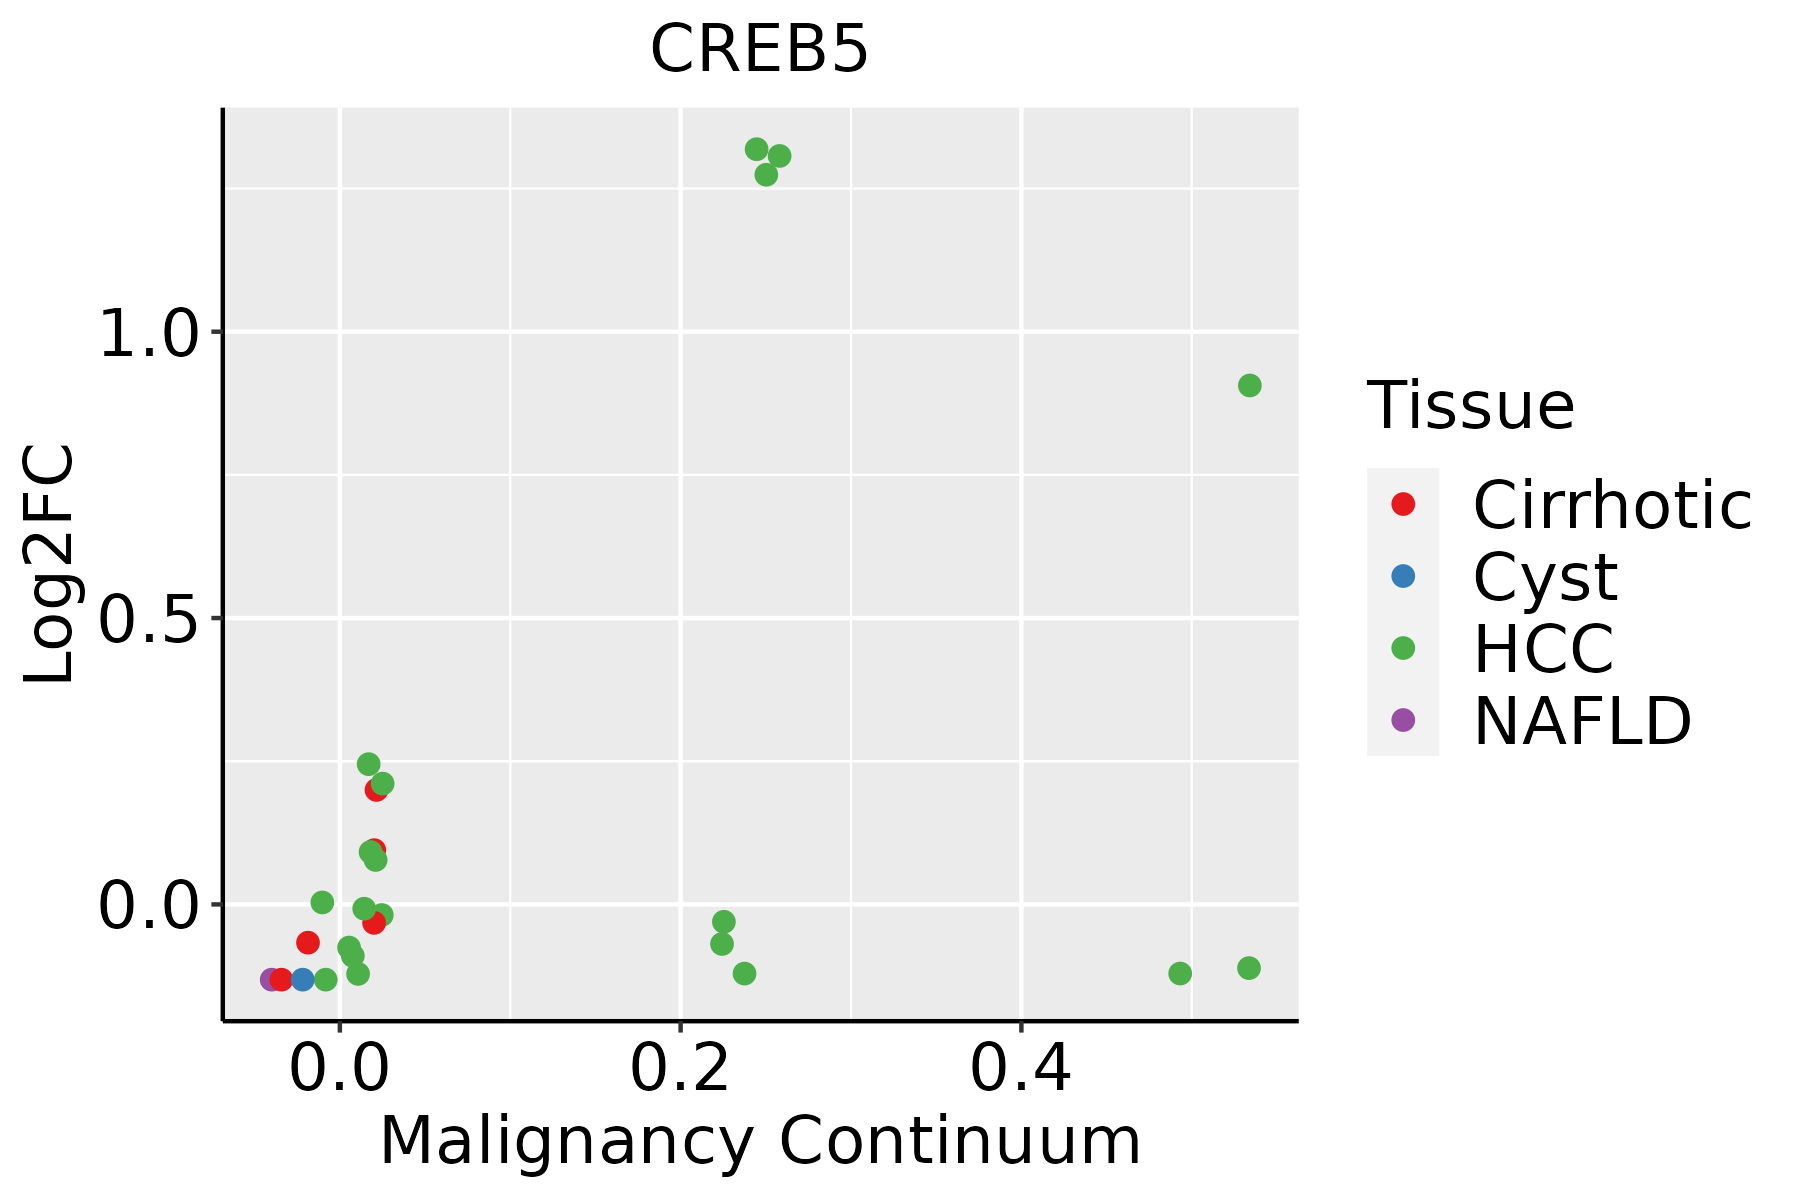 | HCC: Hepatocellular carcinoma |
| NAFLD: Non-alcoholic fatty liver disease | ||
| Lung | 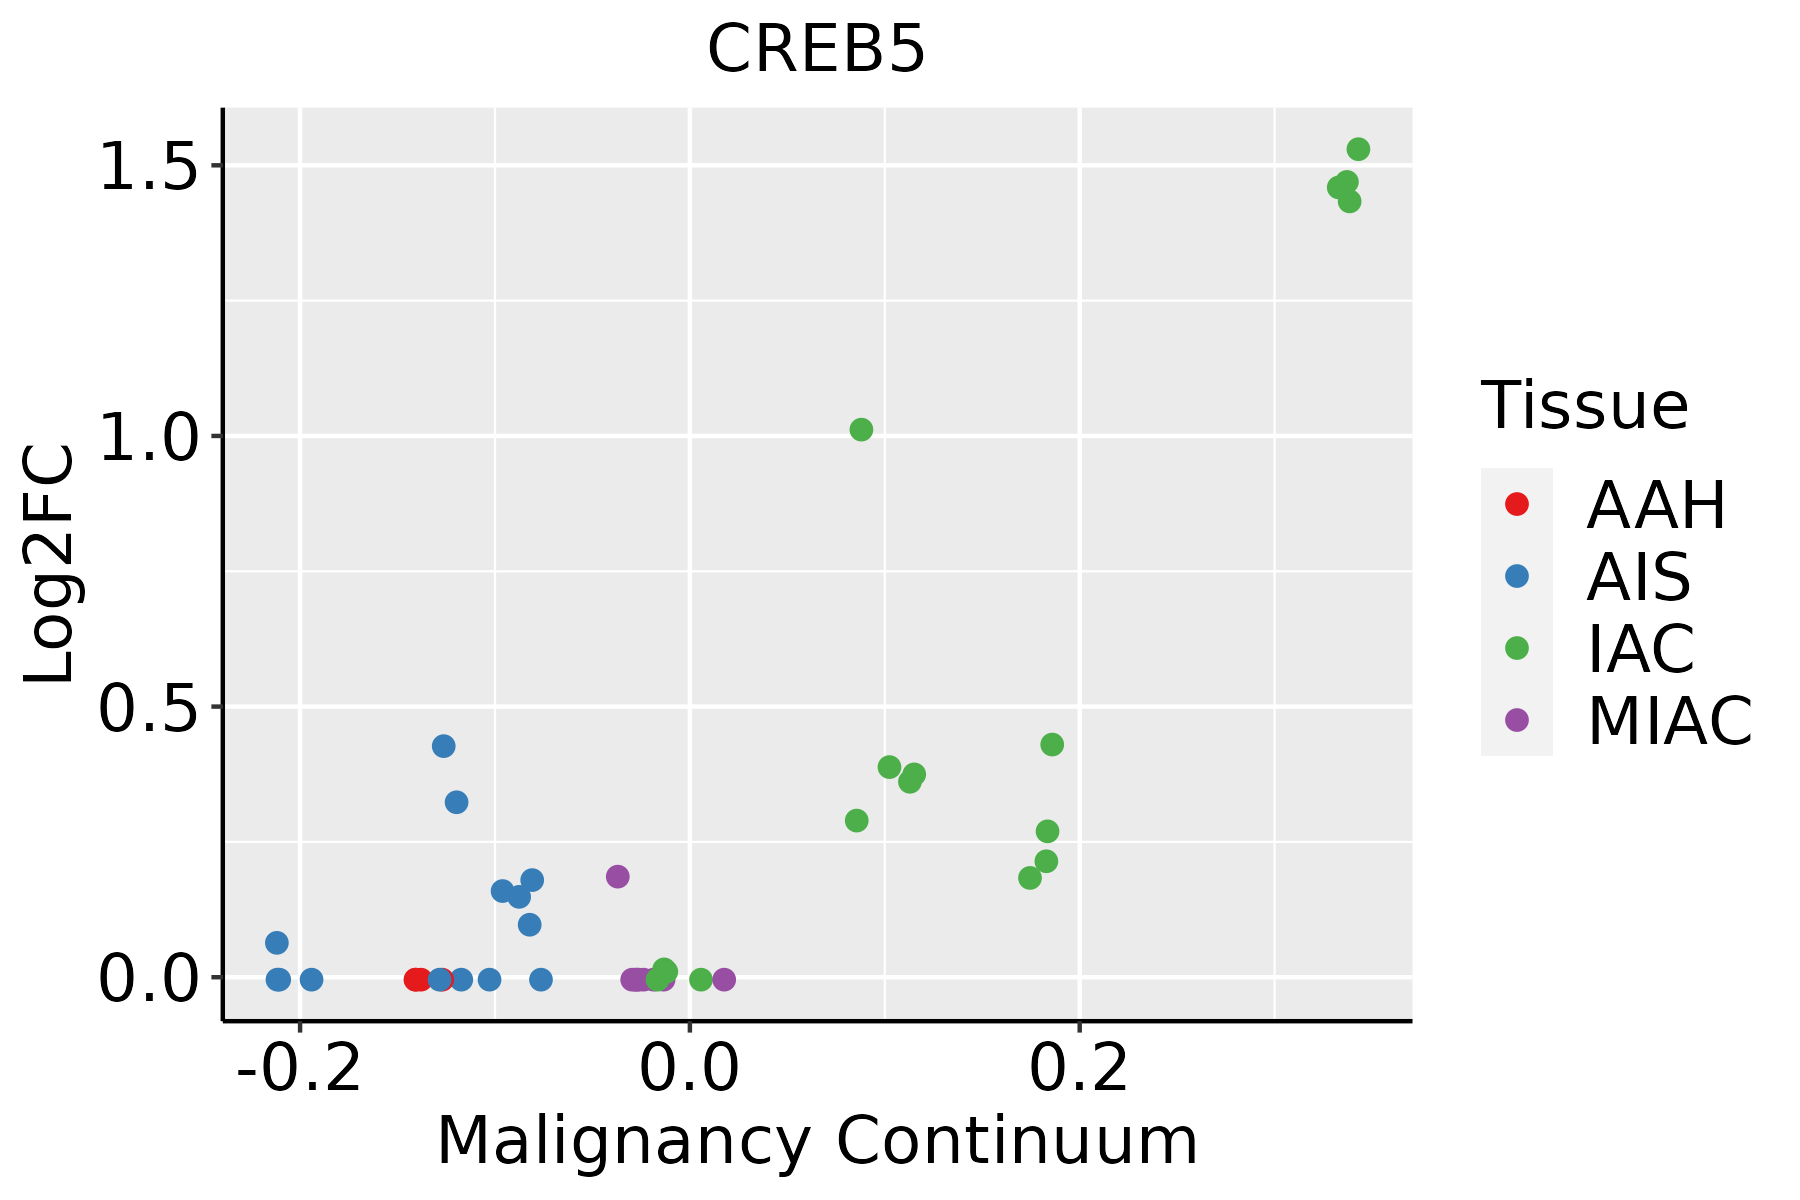 | AAH: Atypical adenomatous hyperplasia |
| AIS: Adenocarcinoma in situ | ||
| IAC: Invasive lung adenocarcinoma | ||
| MIA: Minimally invasive adenocarcinoma | ||
| Oral Cavity |  | EOLP: Erosive Oral lichen planus |
| LP: leukoplakia | ||
| NEOLP: Non-erosive oral lichen planus | ||
| OSCC: Oral squamous cell carcinoma | ||
| Prostate | 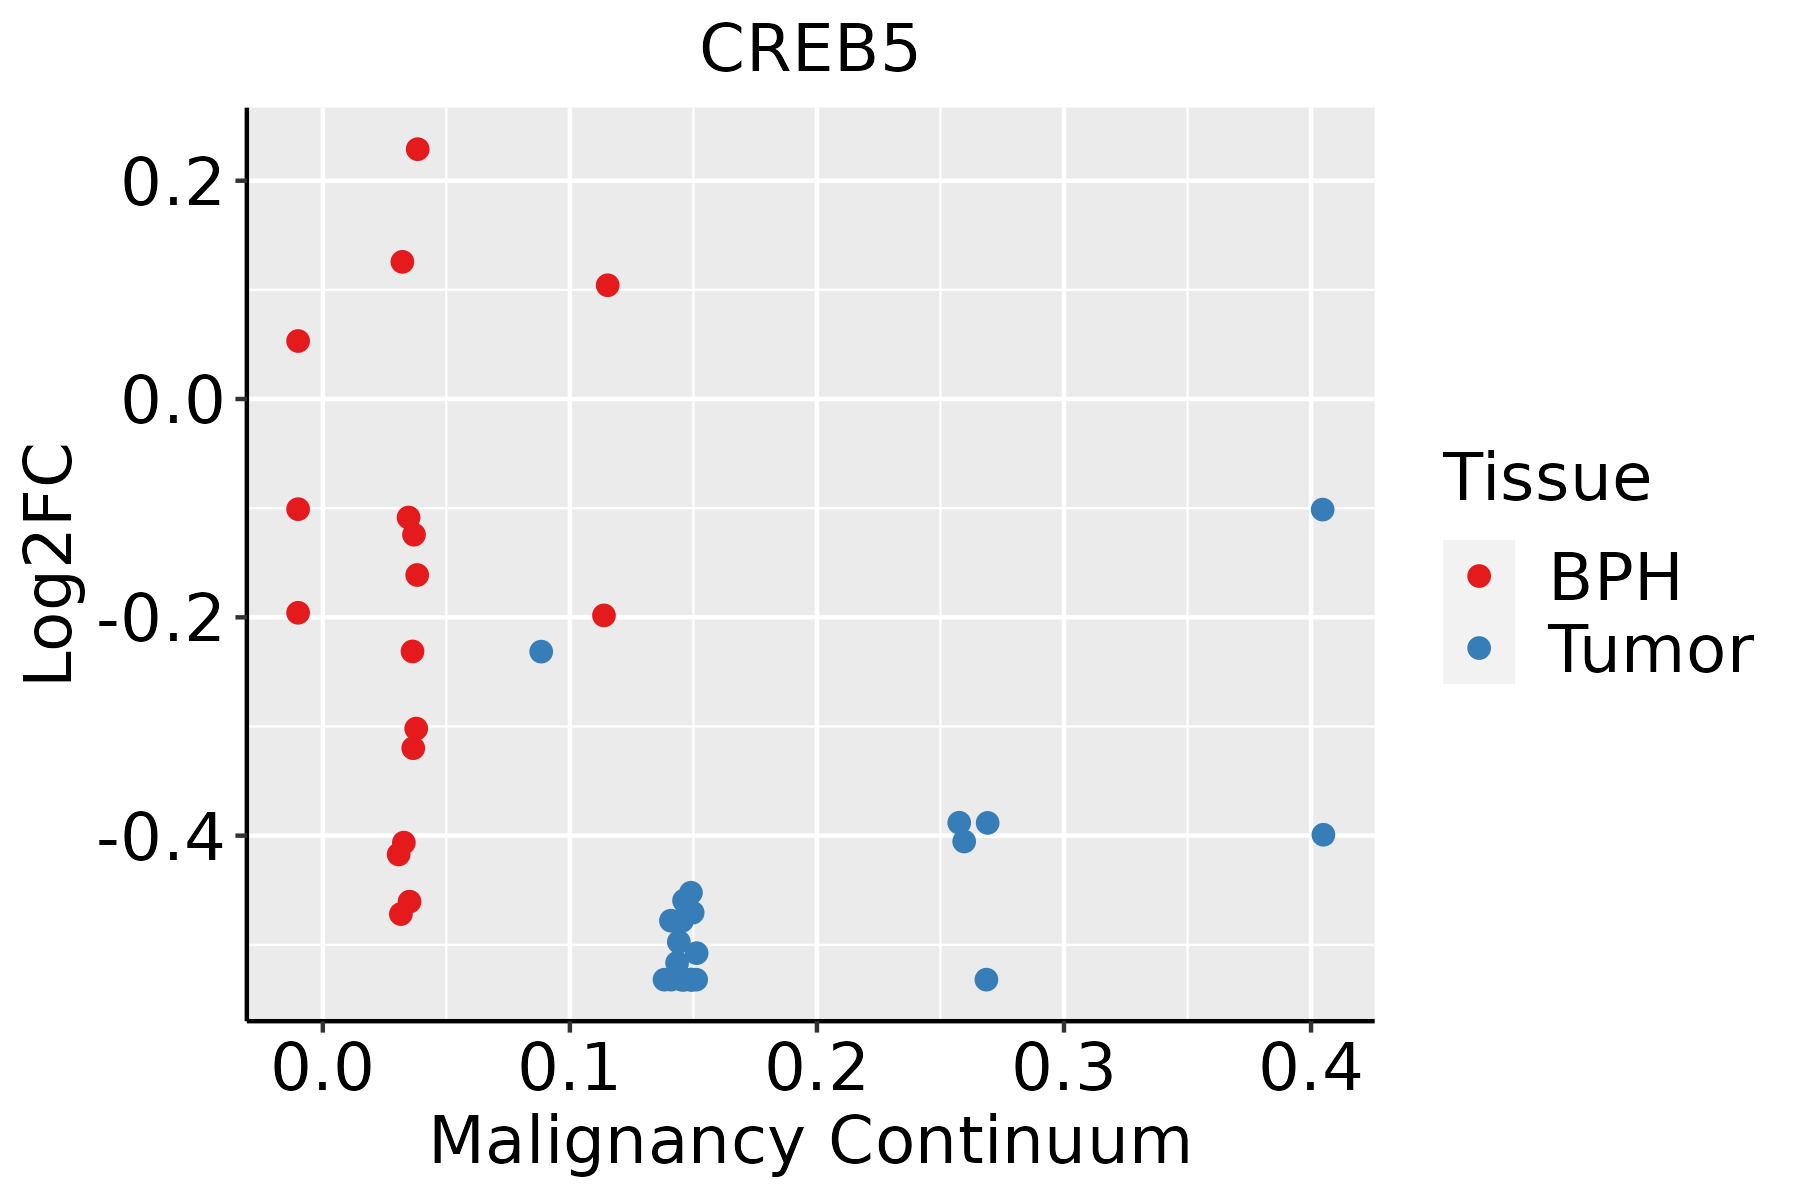 | BPH: Benign Prostatic Hyperplasia |
| Skin | 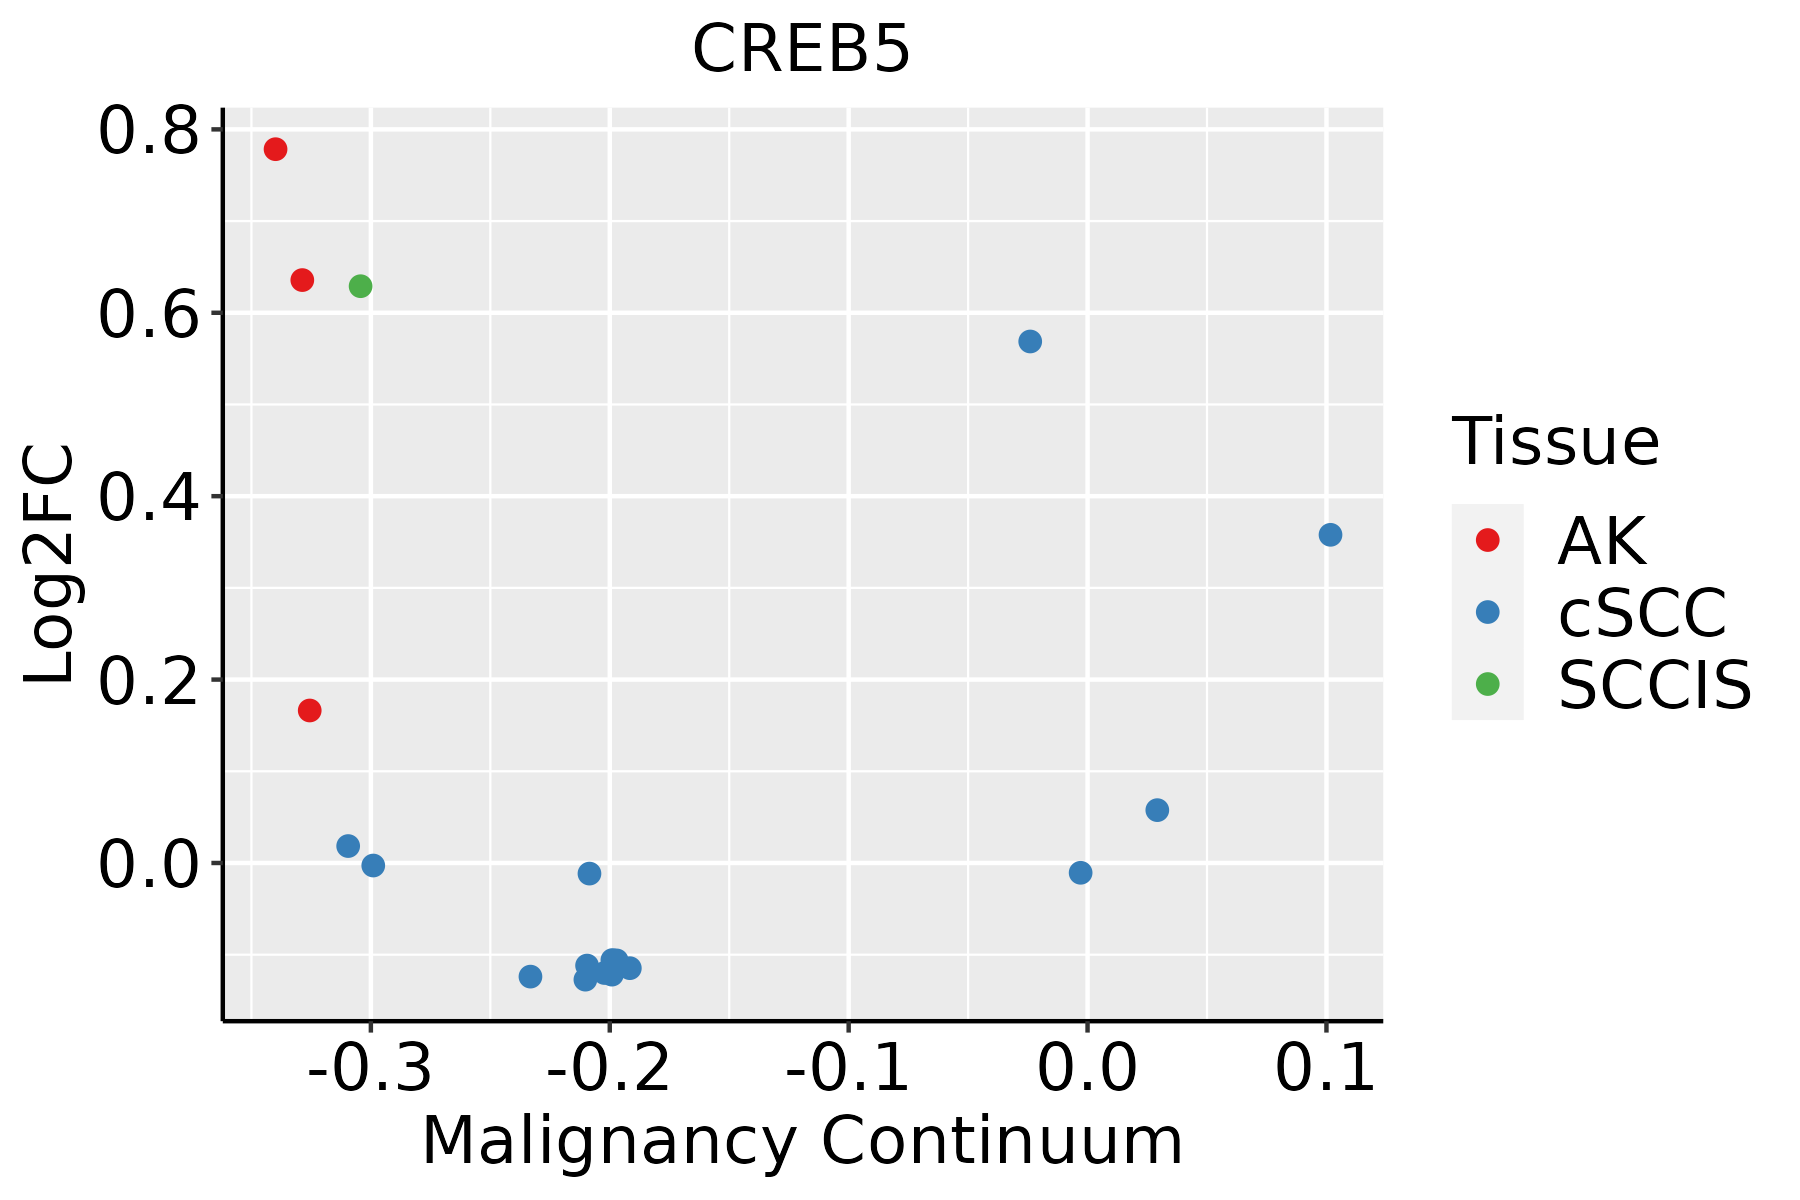 | AK: Actinic keratosis |
| cSCC: Cutaneous squamous cell carcinoma | ||
| SCCIS:squamous cell carcinoma in situ | ||
| Thyroid | 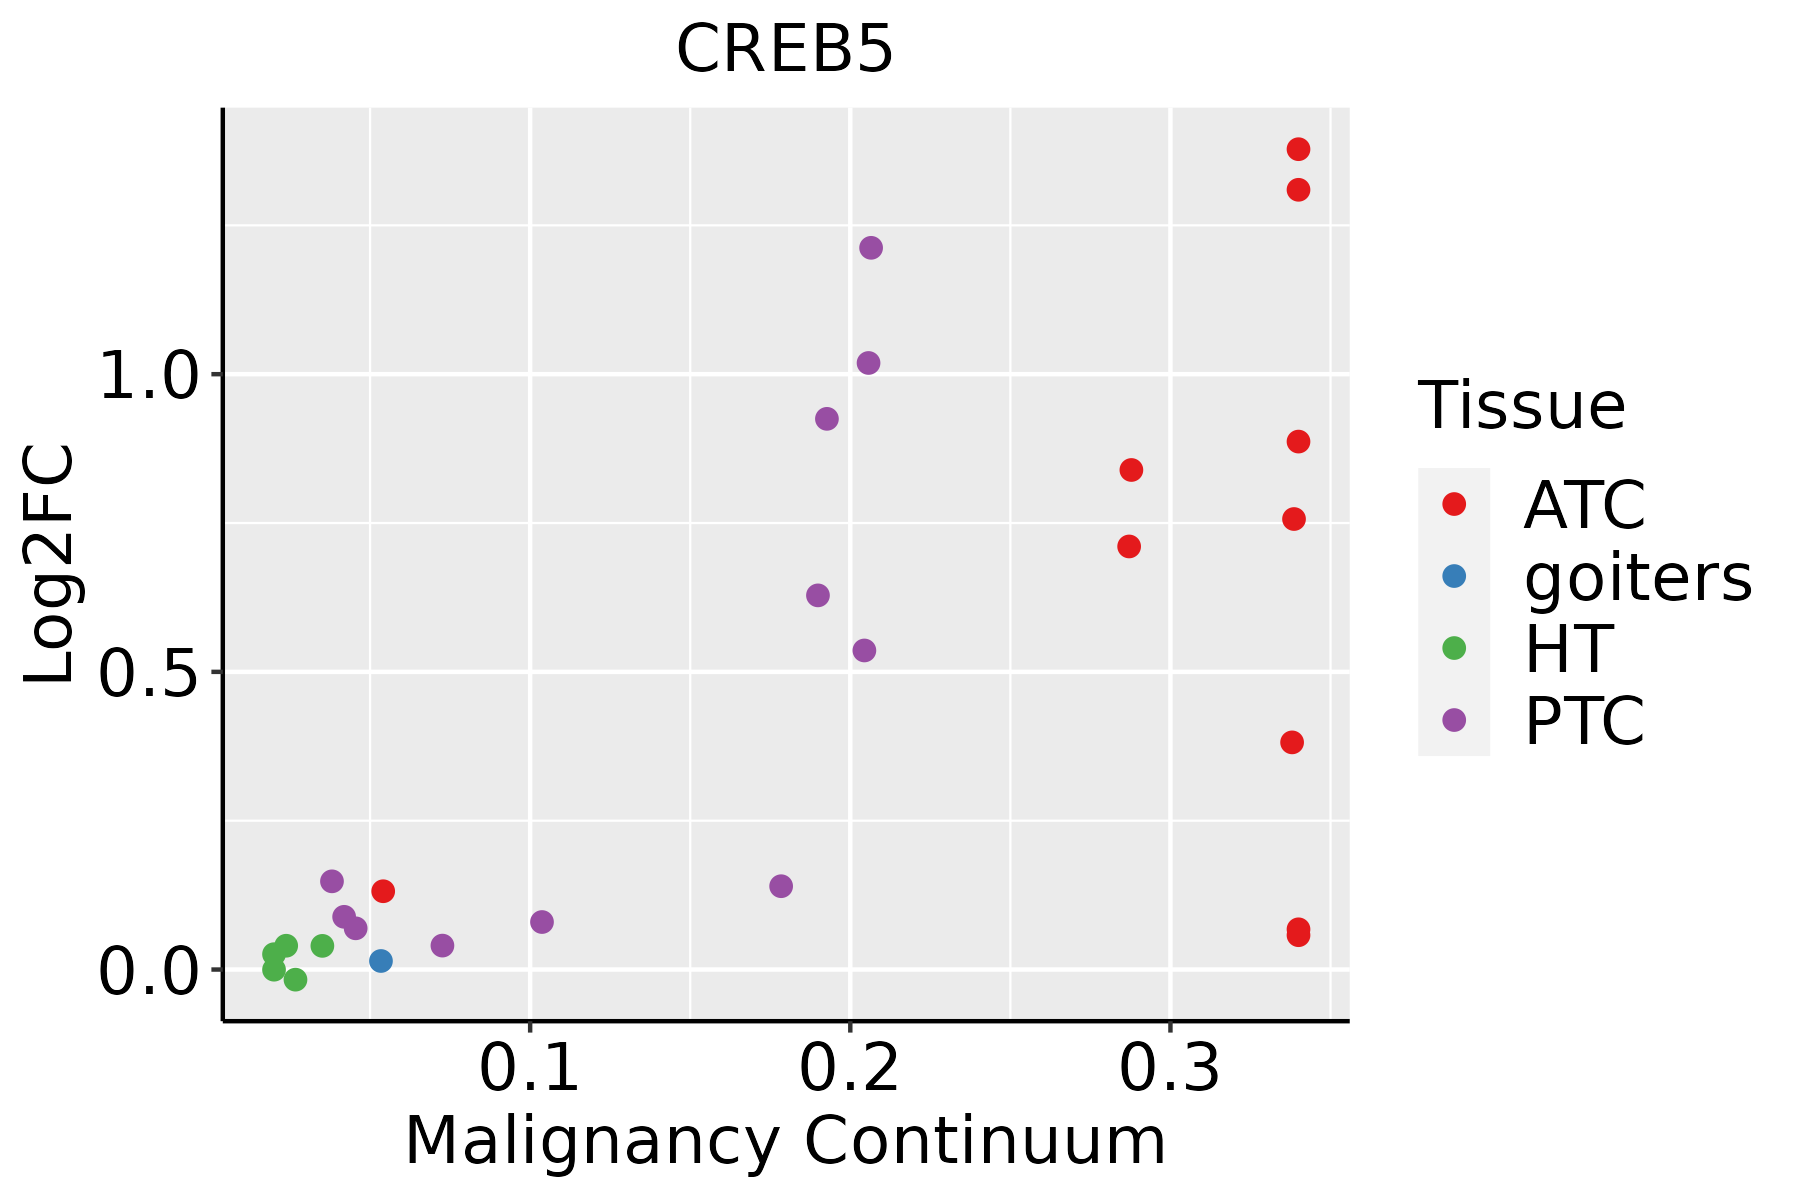 | ATC: Anaplastic thyroid cancer |
| HT: Hashimoto's thyroiditis | ||
| PTC: Papillary thyroid cancer |
| ∗log2FC in expression of this searched gene in stem-like cells from each diseased tissue sample relative to stem-like cells in normal samples in each tissue plotted against the malignancy continuum. Samples are colored based on if they are from different disease stage. |
Top |
Malignant transformation related pathway analysis |
| Find out the enriched GO biological processes and KEGG pathways involved in transition from healthy to precancer to cancer |
| Tissue | Disease Stage | Enriched GO biological Processes |
| Colorectum | AD |  |
| Colorectum | SER |  |
| Colorectum | MSS |  |
| Colorectum | MSI-H |  |
| Colorectum | FAP |  |
| ∗Top 15 enriched GO BP terms are showed in the bar plot of each disease state in each tissue. Each row represents a significant GO biological process which is colored according to the -log10(p.adjust). |
| Page: 1 2 3 4 5 6 7 8 9 |
| GO ID | Tissue | Disease Stage | Description | Gene Ratio | Bg Ratio | pvalue | p.adjust | Count |
| Page: 1 |
| Pathway ID | Tissue | Disease Stage | Description | Gene Ratio | Bg Ratio | pvalue | p.adjust | qvalue | Count |
| hsa0502020 | Endometrium | AEH | Prion disease | 110/1197 | 273/8465 | 2.39e-27 | 2.44e-25 | 1.78e-25 | 110 |
| hsa0501620 | Endometrium | AEH | Huntington disease | 118/1197 | 306/8465 | 3.00e-27 | 2.44e-25 | 1.78e-25 | 118 |
| hsa0471426 | Endometrium | AEH | Thermogenesis | 85/1197 | 232/8465 | 3.44e-18 | 9.33e-17 | 6.83e-17 | 85 |
| hsa0491525 | Endometrium | AEH | Estrogen signaling pathway | 35/1197 | 138/8465 | 3.10e-04 | 2.40e-03 | 1.75e-03 | 35 |
| hsa0516626 | Endometrium | AEH | Human T-cell leukemia virus 1 infection | 50/1197 | 222/8465 | 4.30e-04 | 3.11e-03 | 2.27e-03 | 50 |
| hsa052158 | Endometrium | AEH | Prostate cancer | 25/1197 | 97/8465 | 1.68e-03 | 1.01e-02 | 7.39e-03 | 25 |
| hsa0516320 | Endometrium | AEH | Human cytomegalovirus infection | 45/1197 | 225/8465 | 8.98e-03 | 4.56e-02 | 3.34e-02 | 45 |
| hsa05020110 | Endometrium | AEH | Prion disease | 110/1197 | 273/8465 | 2.39e-27 | 2.44e-25 | 1.78e-25 | 110 |
| hsa05016110 | Endometrium | AEH | Huntington disease | 118/1197 | 306/8465 | 3.00e-27 | 2.44e-25 | 1.78e-25 | 118 |
| hsa04714111 | Endometrium | AEH | Thermogenesis | 85/1197 | 232/8465 | 3.44e-18 | 9.33e-17 | 6.83e-17 | 85 |
| hsa04915111 | Endometrium | AEH | Estrogen signaling pathway | 35/1197 | 138/8465 | 3.10e-04 | 2.40e-03 | 1.75e-03 | 35 |
| hsa05166111 | Endometrium | AEH | Human T-cell leukemia virus 1 infection | 50/1197 | 222/8465 | 4.30e-04 | 3.11e-03 | 2.27e-03 | 50 |
| hsa0521513 | Endometrium | AEH | Prostate cancer | 25/1197 | 97/8465 | 1.68e-03 | 1.01e-02 | 7.39e-03 | 25 |
| hsa05163110 | Endometrium | AEH | Human cytomegalovirus infection | 45/1197 | 225/8465 | 8.98e-03 | 4.56e-02 | 3.34e-02 | 45 |
| hsa0501625 | Endometrium | EEC | Huntington disease | 120/1237 | 306/8465 | 3.86e-27 | 4.23e-25 | 3.15e-25 | 120 |
| hsa0502025 | Endometrium | EEC | Prion disease | 111/1237 | 273/8465 | 1.01e-26 | 8.27e-25 | 6.16e-25 | 111 |
| hsa0471427 | Endometrium | EEC | Thermogenesis | 85/1237 | 232/8465 | 2.79e-17 | 7.05e-16 | 5.26e-16 | 85 |
| hsa0516627 | Endometrium | EEC | Human T-cell leukemia virus 1 infection | 52/1237 | 222/8465 | 2.73e-04 | 2.36e-03 | 1.76e-03 | 52 |
| hsa0491526 | Endometrium | EEC | Estrogen signaling pathway | 34/1237 | 138/8465 | 1.19e-03 | 8.02e-03 | 5.98e-03 | 34 |
| hsa0521522 | Endometrium | EEC | Prostate cancer | 25/1237 | 97/8465 | 2.66e-03 | 1.56e-02 | 1.16e-02 | 25 |
| Page: 1 2 3 4 5 6 7 8 9 10 11 12 13 14 |
Top |
Cell-cell communication analysis |
| Identification of potential cell-cell interactions between two cell types and their ligand-receptor pairs for different disease states |
| Ligand | Receptor | LRpair | Pathway | Tissue | Disease Stage |
| Page: 1 |
Top |
Single-cell gene regulatory network inference analysis |
| Find out the significant the regulons (TFs) and the target genes of each regulon across cell types for different disease states |
| TF | Cell Type | Tissue | Disease Stage | Target Gene | RSS | Regulon Activity |
| CREB5 | PLA | Breast | ADJ | MNDA,CLEC10A,MTRNR2L8, etc. | 1.29e-01 |  |
| CREB5 | M1MAC | Breast | DCIS | MNDA,CLEC10A,MTRNR2L8, etc. | 9.36e-02 |  |
| CREB5 | DC | Breast | DCIS | MNDA,CLEC10A,MTRNR2L8, etc. | 1.35e-01 | |
| CREB5 | INMON | Breast | DCIS | MNDA,CLEC10A,MTRNR2L8, etc. | 8.08e-02 | |
| CREB5 | DC | Breast | Healthy | MNDA,CLEC10A,MTRNR2L8, etc. | 3.71e-01 |  |
| CREB5 | M1MAC | Breast | IDC | MNDA,CLEC10A,MTRNR2L8, etc. | 2.23e-01 |  |
| CREB5 | DC | Breast | IDC | MNDA,CLEC10A,MTRNR2L8, etc. | 1.14e-01 | |
| CREB5 | INMON | Breast | IDC | MNDA,CLEC10A,MTRNR2L8, etc. | 1.60e-01 | |
| CREB5 | INMON | Breast | Precancer | MNDA,CLEC10A,MTRNR2L8, etc. | 3.05e-01 |  |
| CREB5 | CHO | Liver | Healthy | DPP10,GRHL2,CTBP2, etc. | 3.29e-01 |  |
| ∗The dot plots of a searched regulon are shown for all cell subpopulations in each disease state of each tissue based on the regulon specific score inferred using pySCENIC and by calculating the average expression. |
| Page: 1 2 |
Top |
Somatic mutation of malignant transformation related genes |
| Annotation of somatic variants for genes involved in malignant transformation |
| Hugo Symbol | Variant Class | Variant Classification | dbSNP RS | HGVSc | HGVSp | HGVSp Short | SWISSPROT | BIOTYPE | SIFT | PolyPhen | Tumor Sample Barcode | Tissue | Histology | Sex | Age | Stage | Therapy Types | Drugs | Outcome |
| CREB5 | SNV | Missense_Mutation | novel | c.227G>T | p.Ser76Ile | p.S76I | Q02930 | protein_coding | deleterious(0.01) | benign(0.058) | TCGA-A2-A1FX-01 | Breast | breast invasive carcinoma | Female | <65 | III/IV | Chemotherapy | taxotere | SD |
| CREB5 | SNV | Missense_Mutation | novel | c.929N>C | p.Asn310Thr | p.N310T | Q02930 | protein_coding | tolerated(0.6) | benign(0.011) | TCGA-A2-A1G4-01 | Breast | breast invasive carcinoma | Female | >=65 | III/IV | Chemotherapy | adriamycin | SD |
| CREB5 | SNV | Missense_Mutation | c.10G>A | p.Glu4Lys | p.E4K | Q02930 | protein_coding | tolerated_low_confidence(0.12) | probably_damaging(0.956) | TCGA-BH-A1FU-01 | Breast | breast invasive carcinoma | Female | <65 | I/II | Unknown | Unknown | PD | |
| CREB5 | SNV | Missense_Mutation | c.778N>A | p.Glu260Lys | p.E260K | Q02930 | protein_coding | tolerated(0.39) | benign(0.062) | TCGA-C8-A26Y-01 | Breast | breast invasive carcinoma | Female | >=65 | I/II | Unknown | Unknown | SD | |
| CREB5 | SNV | Missense_Mutation | novel | c.452N>C | p.Asn151Thr | p.N151T | Q02930 | protein_coding | tolerated(0.46) | probably_damaging(0.956) | TCGA-E2-A15A-06 | Breast | breast invasive carcinoma | Female | <65 | III/IV | Chemotherapy | cyclophosphamide | SD |
| CREB5 | SNV | Missense_Mutation | novel | c.929N>C | p.Asn310Thr | p.N310T | Q02930 | protein_coding | tolerated(0.6) | benign(0.011) | TCGA-E9-A22A-01 | Breast | breast invasive carcinoma | Female | >=65 | I/II | Hormone Therapy | tamoxiphen | SD |
| CREB5 | SNV | Missense_Mutation | rs761100378 | c.361C>T | p.Arg121Trp | p.R121W | Q02930 | protein_coding | tolerated(0.13) | probably_damaging(0.985) | TCGA-EW-A1IZ-01 | Breast | breast invasive carcinoma | Female | <65 | III/IV | Chemotherapy | taxotere | SD |
| CREB5 | SNV | Missense_Mutation | novel | c.689N>T | p.Ser230Leu | p.S230L | Q02930 | protein_coding | deleterious(0.03) | probably_damaging(0.95) | TCGA-GM-A2DL-01 | Breast | breast invasive carcinoma | Female | <65 | I/II | Hormone Therapy | tamoxiphen | CR |
| CREB5 | insertion | Nonsense_Mutation | novel | c.282_283insGTTAGGTGGGAATAATACATGTACACAGTGGAAAT | p.Ser95ValfsTer5 | p.S95Vfs*5 | Q02930 | protein_coding | TCGA-A8-A07B-01 | Breast | breast invasive carcinoma | Female | >=65 | I/II | Unknown | Unknown | SD | ||
| CREB5 | SNV | Missense_Mutation | c.1156C>T | p.Arg386Trp | p.R386W | Q02930 | protein_coding | deleterious(0.04) | probably_damaging(1) | TCGA-C5-A2LZ-01 | Cervix | cervical & endocervical cancer | Female | >=65 | III/IV | Unknown | Unknown | PD |
| Page: 1 2 3 4 5 6 7 |
Top |
Related drugs of malignant transformation related genes |
| Identification of chemicals and drugs interact with genes involved in malignant transfromation |
| (DGIdb 4.0) |
| Entrez ID | Symbol | Category | Interaction Types | Drug Claim Name | Drug Name | PMIDs |
| Page: 1 |

Copyright 2023-Present -The University of Texas Health Science Center at Houston |