
|
|||||
|
 | |
| |
| |
| |
| |
| |
|
Gene: CREB3L2 |
Gene summary for CREB3L2 |
| Gene information | Species | Human | Gene symbol | CREB3L2 | Gene ID | 64764 |
| Gene name | cAMP responsive element binding protein 3 like 2 | |
| Gene Alias | BBF2H7 | |
| Cytomap | 7q33 | |
| Gene Type | protein-coding | GO ID | GO:0001501 | UniProtAcc | Q70SY1 |
Top |
Malignant transformation analysis |
| Identification of the aberrant gene expression in precancerous and cancerous lesions by comparing the gene expression of stem-like cells in diseased tissues with normal stem cells |
| Entrez ID | Symbol | Replicates | Species | Organ | Tissue | Adj P-value | Log2FC | Malignancy |
| 64764 | CREB3L2 | LZE4T | Human | Esophagus | ESCC | 1.63e-06 | 1.47e-01 | 0.0811 |
| 64764 | CREB3L2 | LZE20T | Human | Esophagus | ESCC | 1.02e-03 | 8.32e-02 | 0.0662 |
| 64764 | CREB3L2 | LZE24T | Human | Esophagus | ESCC | 2.21e-07 | 4.97e-02 | 0.0596 |
| 64764 | CREB3L2 | P1T-E | Human | Esophagus | ESCC | 1.48e-02 | 4.41e-01 | 0.0875 |
| 64764 | CREB3L2 | P2T-E | Human | Esophagus | ESCC | 1.12e-06 | 9.49e-02 | 0.1177 |
| 64764 | CREB3L2 | P4T-E | Human | Esophagus | ESCC | 2.96e-24 | 3.07e-01 | 0.1323 |
| 64764 | CREB3L2 | P5T-E | Human | Esophagus | ESCC | 7.77e-15 | 1.44e-01 | 0.1327 |
| 64764 | CREB3L2 | P8T-E | Human | Esophagus | ESCC | 7.58e-11 | 3.54e-01 | 0.0889 |
| 64764 | CREB3L2 | P9T-E | Human | Esophagus | ESCC | 4.48e-09 | 9.44e-02 | 0.1131 |
| 64764 | CREB3L2 | P10T-E | Human | Esophagus | ESCC | 1.10e-12 | 2.11e-01 | 0.116 |
| 64764 | CREB3L2 | P11T-E | Human | Esophagus | ESCC | 3.35e-11 | 5.27e-01 | 0.1426 |
| 64764 | CREB3L2 | P12T-E | Human | Esophagus | ESCC | 1.26e-28 | 5.93e-01 | 0.1122 |
| 64764 | CREB3L2 | P15T-E | Human | Esophagus | ESCC | 6.06e-17 | 2.47e-01 | 0.1149 |
| 64764 | CREB3L2 | P16T-E | Human | Esophagus | ESCC | 1.26e-09 | 1.35e-01 | 0.1153 |
| 64764 | CREB3L2 | P19T-E | Human | Esophagus | ESCC | 1.65e-10 | 7.21e-01 | 0.1662 |
| 64764 | CREB3L2 | P20T-E | Human | Esophagus | ESCC | 2.19e-02 | 1.32e-02 | 0.1124 |
| 64764 | CREB3L2 | P21T-E | Human | Esophagus | ESCC | 1.95e-11 | 2.20e-01 | 0.1617 |
| 64764 | CREB3L2 | P22T-E | Human | Esophagus | ESCC | 3.34e-14 | 1.92e-01 | 0.1236 |
| 64764 | CREB3L2 | P23T-E | Human | Esophagus | ESCC | 3.71e-10 | 3.42e-01 | 0.108 |
| 64764 | CREB3L2 | P24T-E | Human | Esophagus | ESCC | 5.46e-09 | 1.50e-01 | 0.1287 |
| Page: 1 2 3 4 5 |
| Tissue | Expression Dynamics | Abbreviation |
| Esophagus | 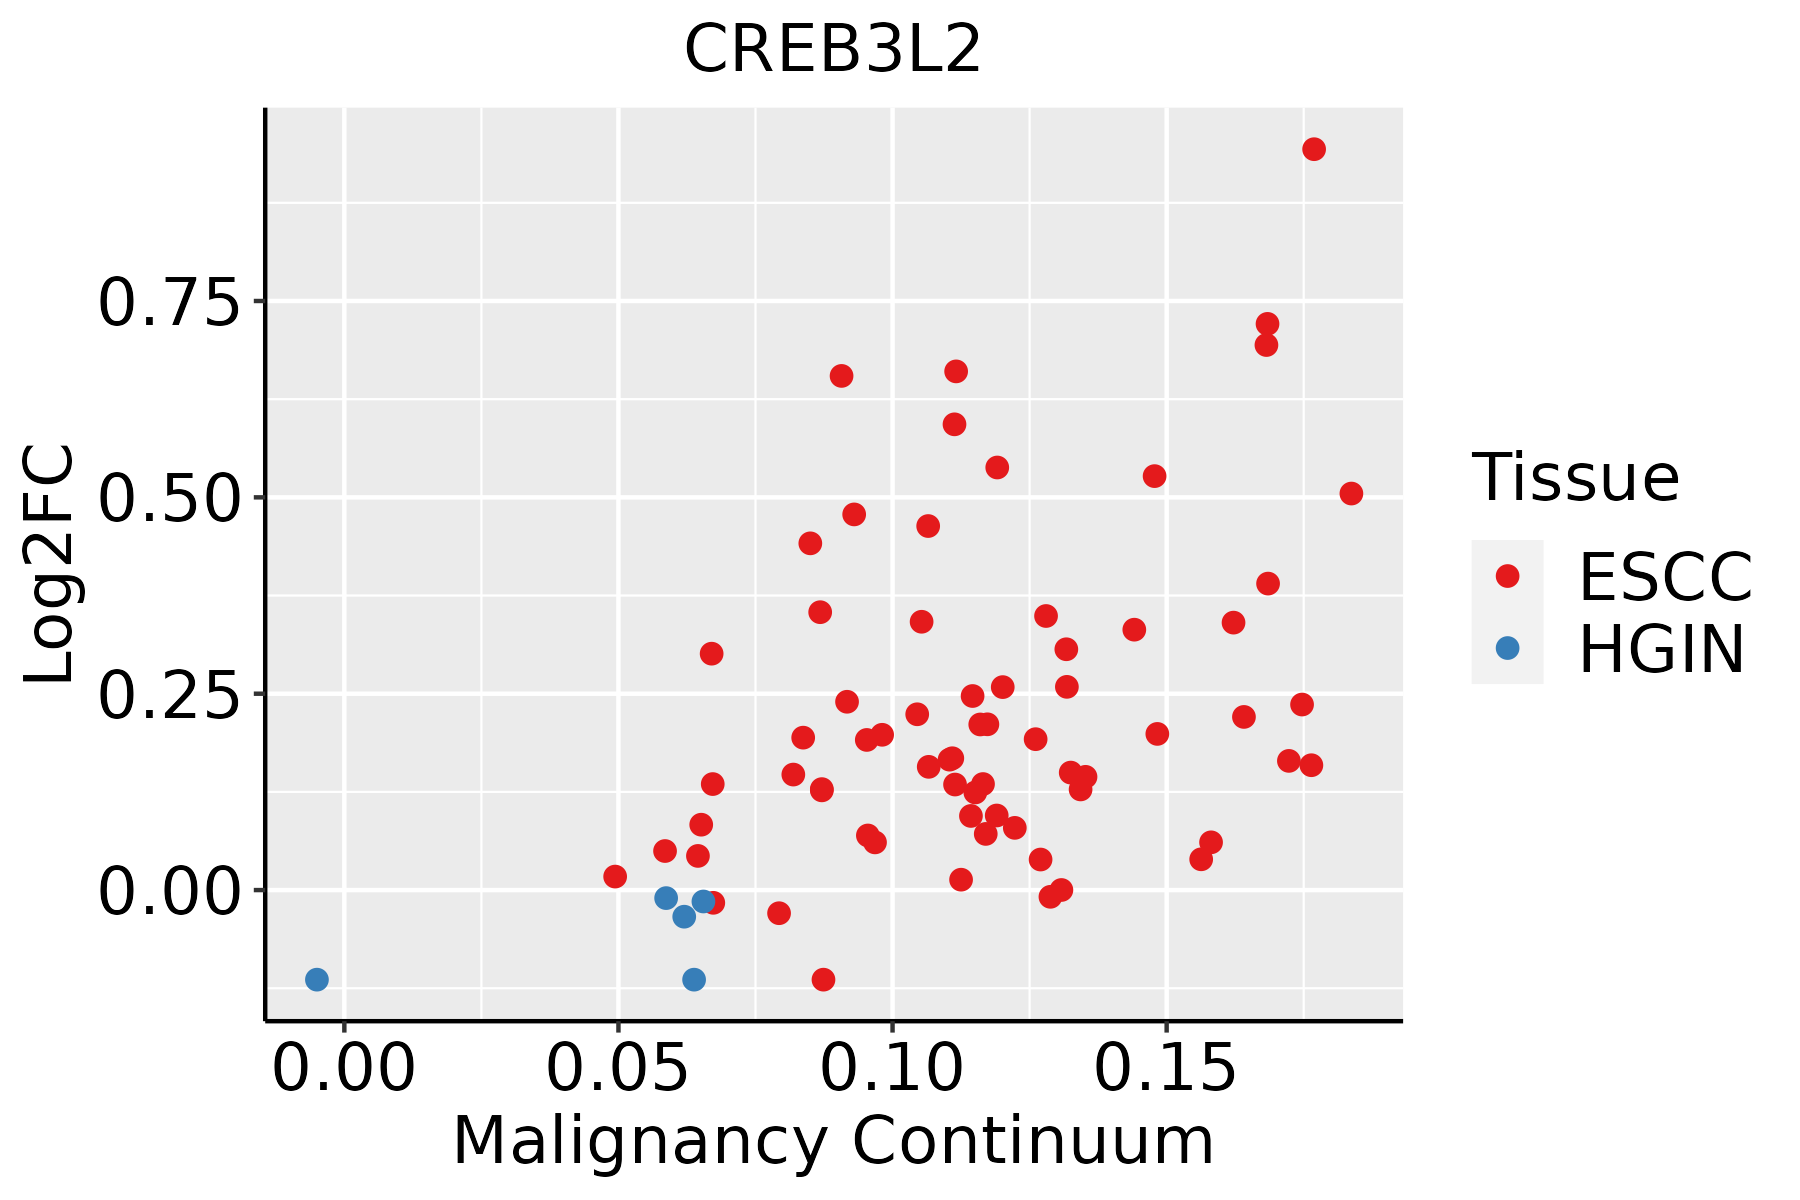 | ESCC: Esophageal squamous cell carcinoma |
| HGIN: High-grade intraepithelial neoplasias | ||
| LGIN: Low-grade intraepithelial neoplasias | ||
| Liver | 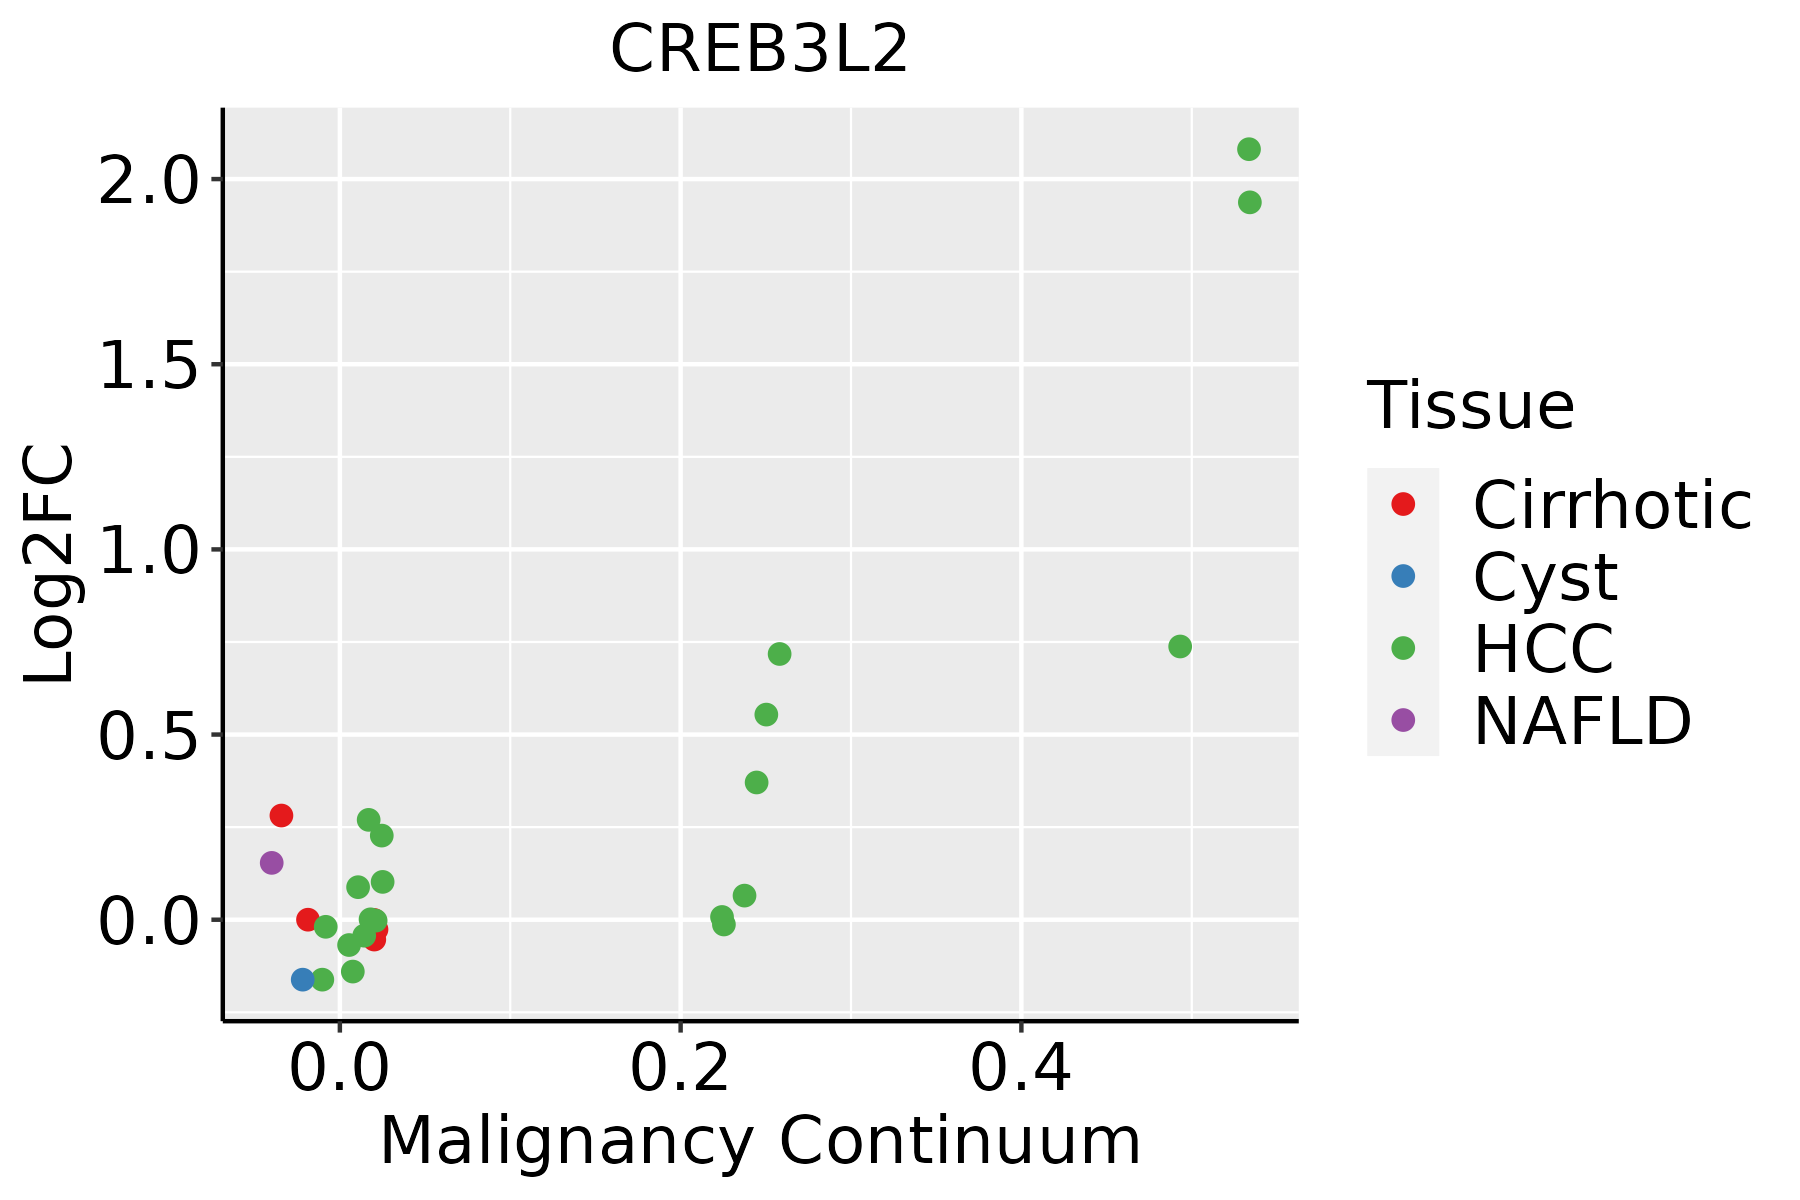 | HCC: Hepatocellular carcinoma |
| NAFLD: Non-alcoholic fatty liver disease | ||
| Lung |  | AAH: Atypical adenomatous hyperplasia |
| AIS: Adenocarcinoma in situ | ||
| IAC: Invasive lung adenocarcinoma | ||
| MIA: Minimally invasive adenocarcinoma | ||
| Prostate | 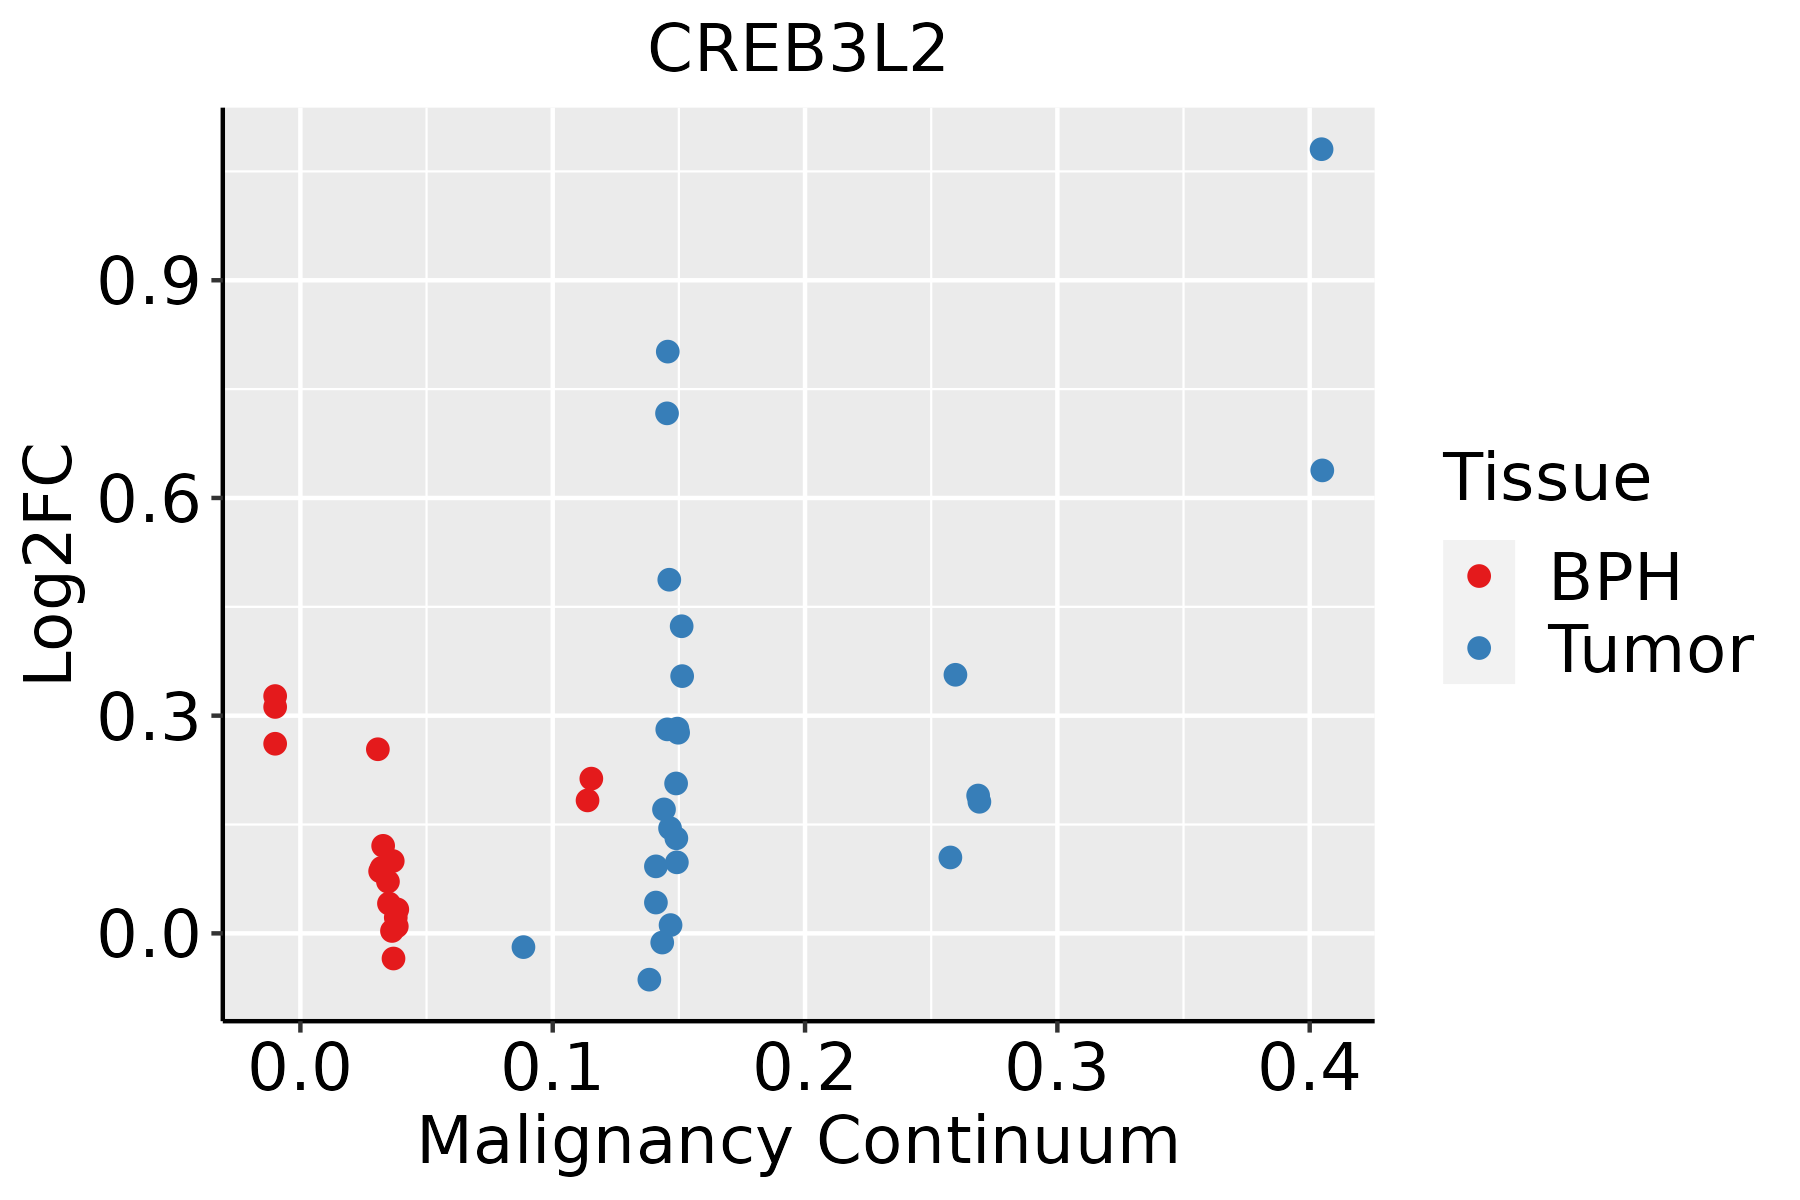 | BPH: Benign Prostatic Hyperplasia |
| Thyroid |  | ATC: Anaplastic thyroid cancer |
| HT: Hashimoto's thyroiditis | ||
| PTC: Papillary thyroid cancer |
| ∗log2FC in expression of this searched gene in stem-like cells from each diseased tissue sample relative to stem-like cells in normal samples in each tissue plotted against the malignancy continuum. Samples are colored based on if they are from different disease stage. |
Top |
Malignant transformation related pathway analysis |
| Find out the enriched GO biological processes and KEGG pathways involved in transition from healthy to precancer to cancer |
| Tissue | Disease Stage | Enriched GO biological Processes |
| Colorectum | AD |  |
| Colorectum | SER |  |
| Colorectum | MSS |  |
| Colorectum | MSI-H |  |
| Colorectum | FAP |  |
| ∗Top 15 enriched GO BP terms are showed in the bar plot of each disease state in each tissue. Each row represents a significant GO biological process which is colored according to the -log10(p.adjust). |
| Page: 1 2 3 4 5 6 7 8 9 |
| GO ID | Tissue | Disease Stage | Description | Gene Ratio | Bg Ratio | pvalue | p.adjust | Count |
| GO:004819318 | Esophagus | ESCC | Golgi vesicle transport | 231/8552 | 296/18723 | 1.82e-30 | 9.63e-28 | 231 |
| GO:0034976111 | Esophagus | ESCC | response to endoplasmic reticulum stress | 192/8552 | 256/18723 | 7.15e-22 | 1.30e-19 | 192 |
| GO:0035966111 | Esophagus | ESCC | response to topologically incorrect protein | 125/8552 | 159/18723 | 1.44e-17 | 1.27e-15 | 125 |
| GO:0006986111 | Esophagus | ESCC | response to unfolded protein | 107/8552 | 137/18723 | 7.01e-15 | 3.87e-13 | 107 |
| GO:000688815 | Esophagus | ESCC | endoplasmic reticulum to Golgi vesicle-mediated transport | 102/8552 | 130/18723 | 1.73e-14 | 9.22e-13 | 102 |
| GO:0035967111 | Esophagus | ESCC | cellular response to topologically incorrect protein | 90/8552 | 116/18723 | 1.94e-12 | 8.11e-11 | 90 |
| GO:0034620111 | Esophagus | ESCC | cellular response to unfolded protein | 74/8552 | 96/18723 | 3.10e-10 | 8.66e-09 | 74 |
| GO:003096818 | Esophagus | ESCC | endoplasmic reticulum unfolded protein response | 59/8552 | 74/18723 | 1.90e-09 | 4.36e-08 | 59 |
| GO:003134616 | Esophagus | ESCC | positive regulation of cell projection organization | 201/8552 | 353/18723 | 1.19e-05 | 1.11e-04 | 201 |
| GO:001097516 | Esophagus | ESCC | regulation of neuron projection development | 240/8552 | 445/18723 | 2.48e-04 | 1.53e-03 | 240 |
| GO:00109764 | Esophagus | ESCC | positive regulation of neuron projection development | 91/8552 | 163/18723 | 5.72e-03 | 2.13e-02 | 91 |
| GO:00512161 | Esophagus | ESCC | cartilage development | 103/8552 | 190/18723 | 1.08e-02 | 3.67e-02 | 103 |
| GO:00020623 | Esophagus | ESCC | chondrocyte differentiation | 60/8552 | 106/18723 | 1.53e-02 | 4.94e-02 | 60 |
| GO:004819321 | Liver | HCC | Golgi vesicle transport | 217/7958 | 296/18723 | 2.58e-27 | 1.02e-24 | 217 |
| GO:003497612 | Liver | HCC | response to endoplasmic reticulum stress | 189/7958 | 256/18723 | 1.43e-24 | 4.06e-22 | 189 |
| GO:003596612 | Liver | HCC | response to topologically incorrect protein | 123/7958 | 159/18723 | 2.60e-19 | 3.44e-17 | 123 |
| GO:000688821 | Liver | HCC | endoplasmic reticulum to Golgi vesicle-mediated transport | 100/7958 | 130/18723 | 1.15e-15 | 8.67e-14 | 100 |
| GO:000698612 | Liver | HCC | response to unfolded protein | 103/7958 | 137/18723 | 6.50e-15 | 4.48e-13 | 103 |
| GO:003596712 | Liver | HCC | cellular response to topologically incorrect protein | 89/7958 | 116/18723 | 5.61e-14 | 3.39e-12 | 89 |
| GO:003462012 | Liver | HCC | cellular response to unfolded protein | 71/7958 | 96/18723 | 3.70e-10 | 1.22e-08 | 71 |
| Page: 1 2 3 4 5 |
| Pathway ID | Tissue | Disease Stage | Description | Gene Ratio | Bg Ratio | pvalue | p.adjust | qvalue | Count |
| hsa05016210 | Esophagus | ESCC | Huntington disease | 226/4205 | 306/8465 | 1.38e-18 | 8.72e-17 | 4.46e-17 | 226 |
| hsa05166211 | Esophagus | ESCC | Human T-cell leukemia virus 1 infection | 164/4205 | 222/8465 | 8.13e-14 | 2.09e-12 | 1.07e-12 | 164 |
| hsa05020210 | Esophagus | ESCC | Prion disease | 193/4205 | 273/8465 | 6.42e-13 | 1.34e-11 | 6.89e-12 | 193 |
| hsa04714211 | Esophagus | ESCC | Thermogenesis | 163/4205 | 232/8465 | 9.22e-11 | 1.14e-09 | 5.86e-10 | 163 |
| hsa0466810 | Esophagus | ESCC | TNF signaling pathway | 89/4205 | 114/8465 | 3.36e-10 | 4.01e-09 | 2.06e-09 | 89 |
| hsa0516510 | Esophagus | ESCC | Human papillomavirus infection | 215/4205 | 331/8465 | 7.86e-09 | 7.12e-08 | 3.65e-08 | 215 |
| hsa0520325 | Esophagus | ESCC | Viral carcinogenesis | 137/4205 | 204/8465 | 2.47e-07 | 1.88e-06 | 9.62e-07 | 137 |
| hsa05163210 | Esophagus | ESCC | Human cytomegalovirus infection | 148/4205 | 225/8465 | 5.73e-07 | 4.00e-06 | 2.05e-06 | 148 |
| hsa0521516 | Esophagus | ESCC | Prostate cancer | 72/4205 | 97/8465 | 6.12e-07 | 4.10e-06 | 2.10e-06 | 72 |
| hsa051619 | Esophagus | ESCC | Hepatitis B | 108/4205 | 162/8465 | 7.68e-06 | 4.15e-05 | 2.12e-05 | 108 |
| hsa0415210 | Esophagus | ESCC | AMPK signaling pathway | 80/4205 | 121/8465 | 1.73e-04 | 6.67e-04 | 3.42e-04 | 80 |
| hsa0496223 | Esophagus | ESCC | Vasopressin-regulated water reabsorption | 33/4205 | 44/8465 | 5.27e-04 | 1.78e-03 | 9.13e-04 | 33 |
| hsa049268 | Esophagus | ESCC | Relaxin signaling pathway | 81/4205 | 129/8465 | 1.72e-03 | 5.09e-03 | 2.61e-03 | 81 |
| hsa049318 | Esophagus | ESCC | Insulin resistance | 69/4205 | 108/8465 | 1.92e-03 | 5.54e-03 | 2.84e-03 | 69 |
| hsa0421114 | Esophagus | ESCC | Longevity regulating pathway | 58/4205 | 89/8465 | 2.19e-03 | 6.16e-03 | 3.16e-03 | 58 |
| hsa0492816 | Esophagus | ESCC | Parathyroid hormone synthesis, secretion and action | 66/4205 | 106/8465 | 5.86e-03 | 1.47e-02 | 7.51e-03 | 66 |
| hsa041517 | Esophagus | ESCC | PI3K-Akt signaling pathway | 197/4205 | 354/8465 | 1.24e-02 | 2.83e-02 | 1.45e-02 | 197 |
| hsa0492214 | Esophagus | ESCC | Glucagon signaling pathway | 64/4205 | 107/8465 | 2.18e-02 | 4.80e-02 | 2.46e-02 | 64 |
| hsa0501638 | Esophagus | ESCC | Huntington disease | 226/4205 | 306/8465 | 1.38e-18 | 8.72e-17 | 4.46e-17 | 226 |
| hsa05166310 | Esophagus | ESCC | Human T-cell leukemia virus 1 infection | 164/4205 | 222/8465 | 8.13e-14 | 2.09e-12 | 1.07e-12 | 164 |
| Page: 1 2 3 4 5 6 7 8 9 10 |
Top |
Cell-cell communication analysis |
| Identification of potential cell-cell interactions between two cell types and their ligand-receptor pairs for different disease states |
| Ligand | Receptor | LRpair | Pathway | Tissue | Disease Stage |
| Page: 1 |
Top |
Single-cell gene regulatory network inference analysis |
| Find out the significant the regulons (TFs) and the target genes of each regulon across cell types for different disease states |
| TF | Cell Type | Tissue | Disease Stage | Target Gene | RSS | Regulon Activity |
| CREB3L2 | PLA | Oral cavity | ADJ | TSC22D3,IGHGP,TBCEL, etc. | 1.05e-01 |  |
| CREB3L2 | PLA | Oral cavity | OSCC | TSC22D3,IGHGP,TBCEL, etc. | 1.68e-01 |  |
| CREB3L2 | PLA | Stomach | ADJ | GLCCI1,TXNDC5,SSR4, etc. | 4.29e-01 |  |
| CREB3L2 | PLA | Stomach | CAG | GLCCI1,TXNDC5,SSR4, etc. | 4.81e-01 |  |
| CREB3L2 | PLA | Stomach | CAG with IM | GLCCI1,TXNDC5,SSR4, etc. | 5.10e-01 |  |
| CREB3L2 | PLA | Stomach | CSG | GLCCI1,TXNDC5,SSR4, etc. | 5.68e-01 |  |
| CREB3L2 | PLA | Stomach | GC | GLCCI1,TXNDC5,SSR4, etc. | 2.64e-01 |  |
| CREB3L2 | PLA | Stomach | Healthy | GLCCI1,TXNDC5,SSR4, etc. | 4.06e-01 |  |
| CREB3L2 | PLA | Stomach | SIM | GLCCI1,TXNDC5,SSR4, etc. | 5.56e-01 |  |
| CREB3L2 | PLA | Stomach | WIM | GLCCI1,TXNDC5,SSR4, etc. | 2.96e-01 |  |
| ∗The dot plots of a searched regulon are shown for all cell subpopulations in each disease state of each tissue based on the regulon specific score inferred using pySCENIC and by calculating the average expression. |
| Page: 1 2 |
Top |
Somatic mutation of malignant transformation related genes |
| Annotation of somatic variants for genes involved in malignant transformation |
| Hugo Symbol | Variant Class | Variant Classification | dbSNP RS | HGVSc | HGVSp | HGVSp Short | SWISSPROT | BIOTYPE | SIFT | PolyPhen | Tumor Sample Barcode | Tissue | Histology | Sex | Age | Stage | Therapy Types | Drugs | Outcome |
| CREB3L2 | SNV | Missense_Mutation | c.375C>G | p.Ile125Met | p.I125M | Q70SY1 | protein_coding | tolerated(0.11) | possibly_damaging(0.797) | TCGA-BH-A0C0-01 | Breast | breast invasive carcinoma | Female | <65 | I/II | Chemotherapy | carboplatin | SD | |
| CREB3L2 | SNV | Missense_Mutation | rs754799812 | c.269G>A | p.Arg90Gln | p.R90Q | Q70SY1 | protein_coding | tolerated(0.05) | benign(0.183) | TCGA-2W-A8YY-01 | Cervix | cervical & endocervical cancer | Female | <65 | I/II | Chemotherapy | cisplatin | CR |
| CREB3L2 | SNV | Missense_Mutation | c.1315N>A | p.Glu439Lys | p.E439K | Q70SY1 | protein_coding | deleterious(0.01) | possibly_damaging(0.907) | TCGA-EK-A2PG-01 | Cervix | cervical & endocervical cancer | Female | >=65 | I/II | Unknown | Unknown | SD | |
| CREB3L2 | SNV | Missense_Mutation | rs778038461 | c.419C>T | p.Pro140Leu | p.P140L | Q70SY1 | protein_coding | tolerated(0.1) | probably_damaging(0.998) | TCGA-AA-3710-01 | Colorectum | colon adenocarcinoma | Female | >=65 | I/II | Unknown | Unknown | SD |
| CREB3L2 | SNV | Missense_Mutation | c.1455N>T | p.Glu485Asp | p.E485D | Q70SY1 | protein_coding | tolerated(0.17) | benign(0.164) | TCGA-AA-A010-01 | Colorectum | colon adenocarcinoma | Female | <65 | I/II | Chemotherapy | folinic | CR | |
| CREB3L2 | SNV | Missense_Mutation | c.1418T>C | p.Leu473Pro | p.L473P | Q70SY1 | protein_coding | tolerated(0.28) | possibly_damaging(0.491) | TCGA-G4-6588-01 | Colorectum | colon adenocarcinoma | Female | <65 | I/II | Unknown | Unknown | SD | |
| CREB3L2 | SNV | Missense_Mutation | novel | c.938G>T | p.Arg313Ile | p.R313I | Q70SY1 | protein_coding | deleterious(0) | probably_damaging(0.998) | TCGA-AG-A002-01 | Colorectum | rectum adenocarcinoma | Male | <65 | I/II | Unknown | Unknown | SD |
| CREB3L2 | insertion | Nonsense_Mutation | novel | c.1441_1442insTATTTGAGAATTTGGCTACTTGCTGATATTTATTTGTCACCCTA | p.Glu481ValfsTer9 | p.E481Vfs*9 | Q70SY1 | protein_coding | TCGA-F5-6465-01 | Colorectum | rectum adenocarcinoma | Female | <65 | I/II | Unknown | Unknown | SD | ||
| CREB3L2 | SNV | Missense_Mutation | c.1455G>T | p.Glu485Asp | p.E485D | Q70SY1 | protein_coding | tolerated(0.17) | benign(0.164) | TCGA-A5-A0G2-01 | Endometrium | uterine corpus endometrioid carcinoma | Female | <65 | III/IV | Unknown | Unknown | SD | |
| CREB3L2 | SNV | Missense_Mutation | novel | c.958G>A | p.Asp320Asn | p.D320N | Q70SY1 | protein_coding | deleterious(0) | possibly_damaging(0.907) | TCGA-A5-A1OF-01 | Endometrium | uterine corpus endometrioid carcinoma | Female | <65 | I/II | Unknown | Unknown | SD |
| Page: 1 2 3 4 5 6 |
Top |
Related drugs of malignant transformation related genes |
| Identification of chemicals and drugs interact with genes involved in malignant transfromation |
| (DGIdb 4.0) |
| Entrez ID | Symbol | Category | Interaction Types | Drug Claim Name | Drug Name | PMIDs |
| Page: 1 |

Copyright 2023-Present -The University of Texas Health Science Center at Houston |