
|
|||||
|
 | |
| |
| |
| |
| |
| |
|
Gene: CREB3 |
Gene summary for CREB3 |
| Gene information | Species | Human | Gene symbol | CREB3 | Gene ID | 10488 |
| Gene name | cAMP responsive element binding protein 3 | |
| Gene Alias | LUMAN | |
| Cytomap | 9p13.3 | |
| Gene Type | protein-coding | GO ID | GO:0002376 | UniProtAcc | O43889 |
Top |
Malignant transformation analysis |
| Identification of the aberrant gene expression in precancerous and cancerous lesions by comparing the gene expression of stem-like cells in diseased tissues with normal stem cells |
| Entrez ID | Symbol | Replicates | Species | Organ | Tissue | Adj P-value | Log2FC | Malignancy |
| 10488 | CREB3 | LZE4T | Human | Esophagus | ESCC | 2.91e-06 | 2.74e-01 | 0.0811 |
| 10488 | CREB3 | LZE5T | Human | Esophagus | ESCC | 1.81e-04 | 2.74e-01 | 0.0514 |
| 10488 | CREB3 | LZE7T | Human | Esophagus | ESCC | 8.53e-09 | 5.18e-01 | 0.0667 |
| 10488 | CREB3 | LZE8T | Human | Esophagus | ESCC | 1.57e-09 | 2.79e-01 | 0.067 |
| 10488 | CREB3 | LZE20T | Human | Esophagus | ESCC | 1.61e-03 | 1.93e-01 | 0.0662 |
| 10488 | CREB3 | LZE22T | Human | Esophagus | ESCC | 1.32e-03 | 2.47e-01 | 0.068 |
| 10488 | CREB3 | LZE24T | Human | Esophagus | ESCC | 9.95e-17 | 6.15e-01 | 0.0596 |
| 10488 | CREB3 | LZE6T | Human | Esophagus | ESCC | 3.10e-02 | 1.16e-01 | 0.0845 |
| 10488 | CREB3 | P1T-E | Human | Esophagus | ESCC | 7.79e-03 | 2.60e-01 | 0.0875 |
| 10488 | CREB3 | P2T-E | Human | Esophagus | ESCC | 1.47e-45 | 7.06e-01 | 0.1177 |
| 10488 | CREB3 | P4T-E | Human | Esophagus | ESCC | 2.32e-18 | 4.41e-01 | 0.1323 |
| 10488 | CREB3 | P5T-E | Human | Esophagus | ESCC | 2.16e-06 | 1.79e-01 | 0.1327 |
| 10488 | CREB3 | P8T-E | Human | Esophagus | ESCC | 1.11e-17 | 3.18e-01 | 0.0889 |
| 10488 | CREB3 | P9T-E | Human | Esophagus | ESCC | 1.82e-10 | 3.47e-01 | 0.1131 |
| 10488 | CREB3 | P10T-E | Human | Esophagus | ESCC | 2.10e-14 | 3.09e-01 | 0.116 |
| 10488 | CREB3 | P11T-E | Human | Esophagus | ESCC | 4.89e-20 | 1.06e+00 | 0.1426 |
| 10488 | CREB3 | P12T-E | Human | Esophagus | ESCC | 4.04e-17 | 3.63e-01 | 0.1122 |
| 10488 | CREB3 | P15T-E | Human | Esophagus | ESCC | 2.09e-12 | 2.83e-01 | 0.1149 |
| 10488 | CREB3 | P16T-E | Human | Esophagus | ESCC | 1.32e-16 | 3.65e-01 | 0.1153 |
| 10488 | CREB3 | P17T-E | Human | Esophagus | ESCC | 4.89e-17 | 6.82e-01 | 0.1278 |
| Page: 1 2 3 4 5 6 |
| Tissue | Expression Dynamics | Abbreviation |
| Esophagus | 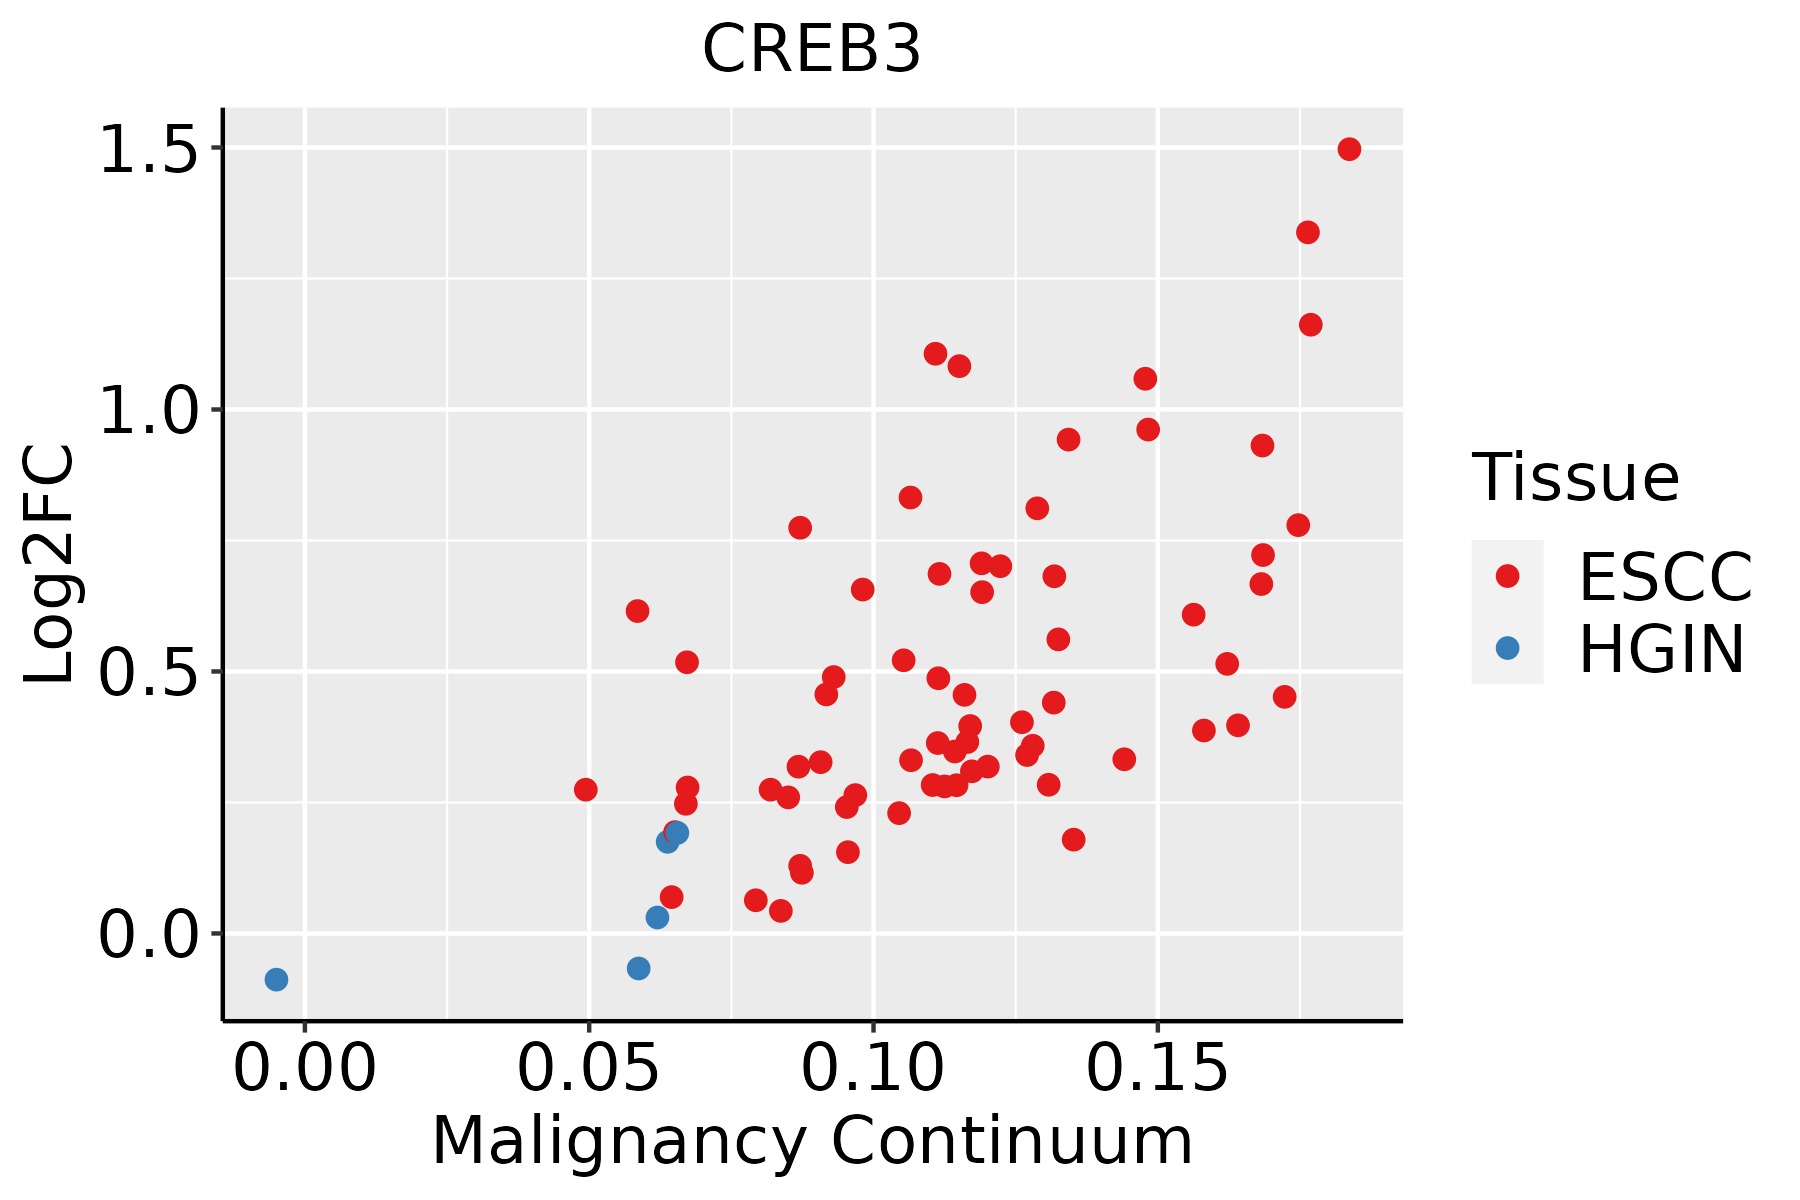 | ESCC: Esophageal squamous cell carcinoma |
| HGIN: High-grade intraepithelial neoplasias | ||
| LGIN: Low-grade intraepithelial neoplasias | ||
| Liver | 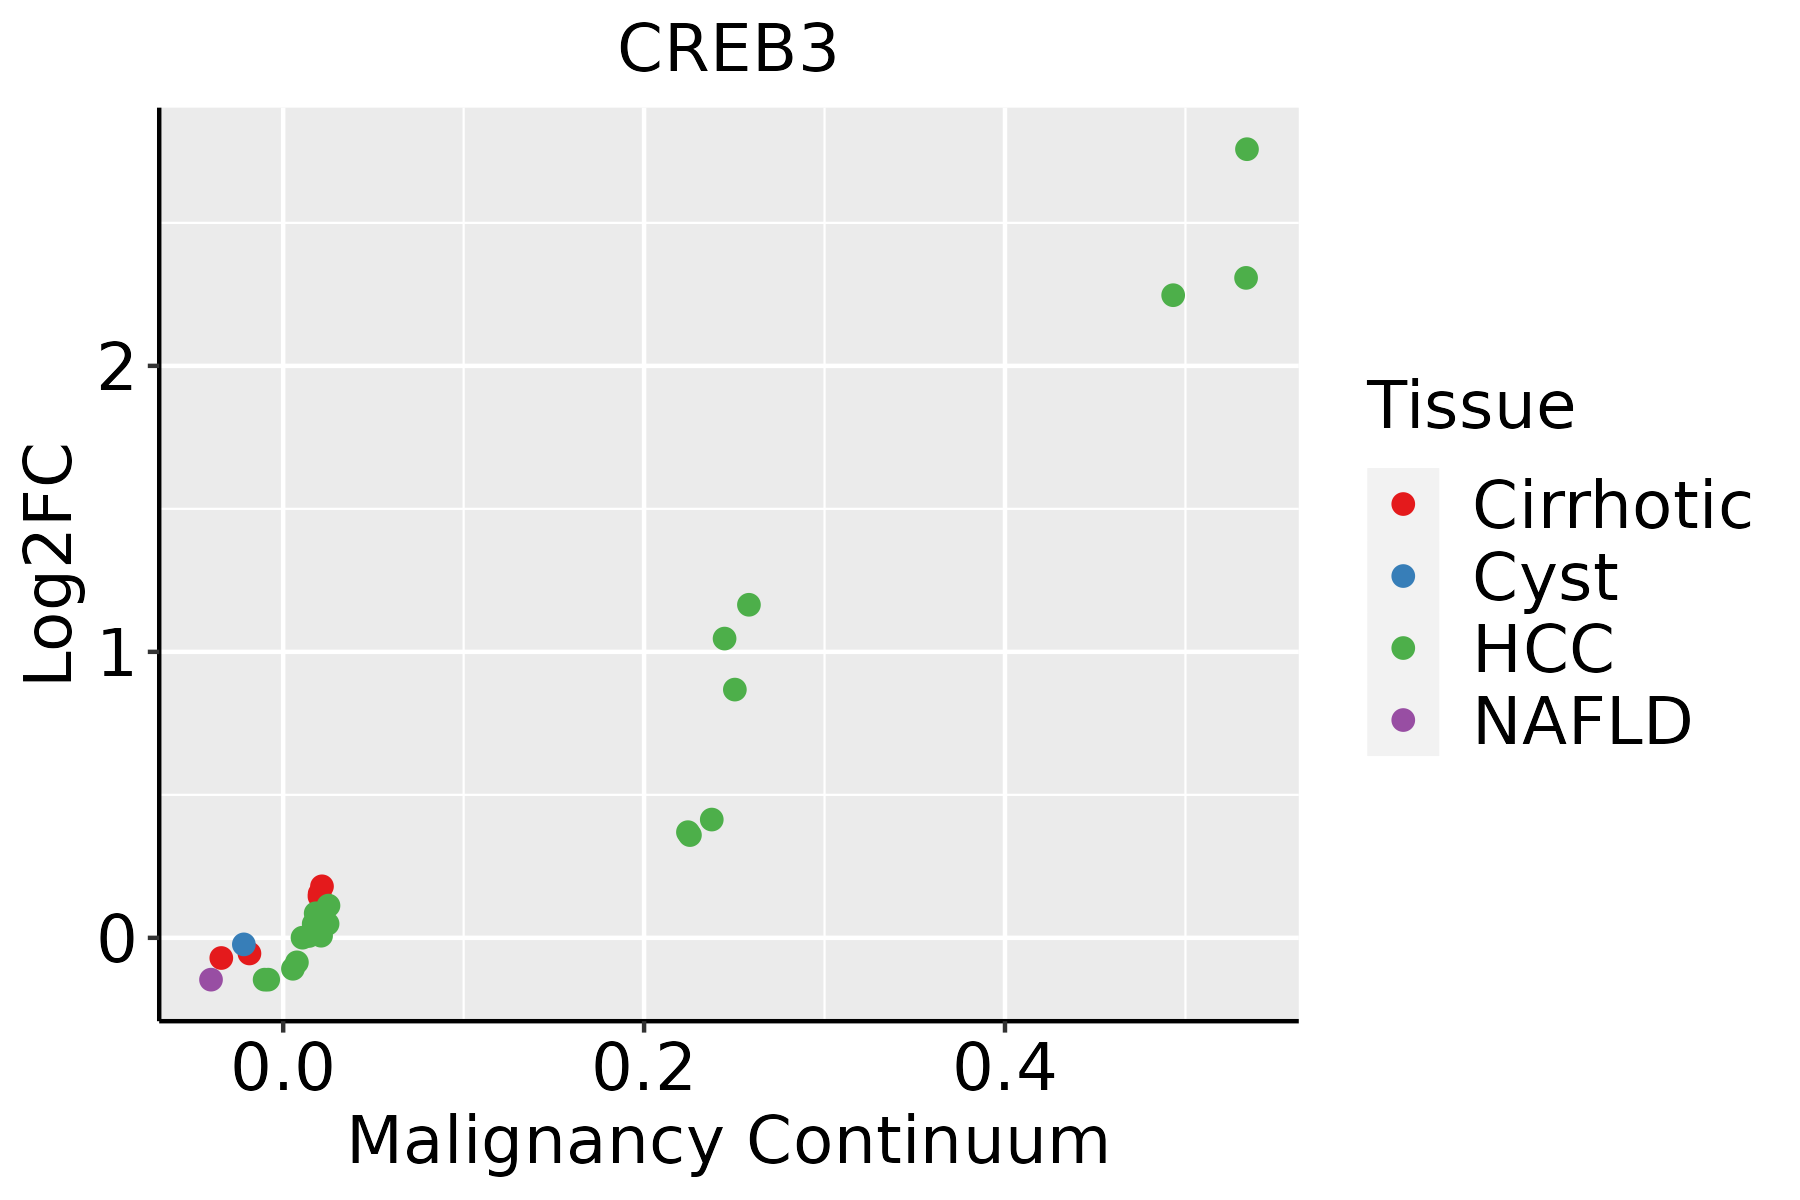 | HCC: Hepatocellular carcinoma |
| NAFLD: Non-alcoholic fatty liver disease | ||
| Oral Cavity |  | EOLP: Erosive Oral lichen planus |
| LP: leukoplakia | ||
| NEOLP: Non-erosive oral lichen planus | ||
| OSCC: Oral squamous cell carcinoma | ||
| Thyroid | 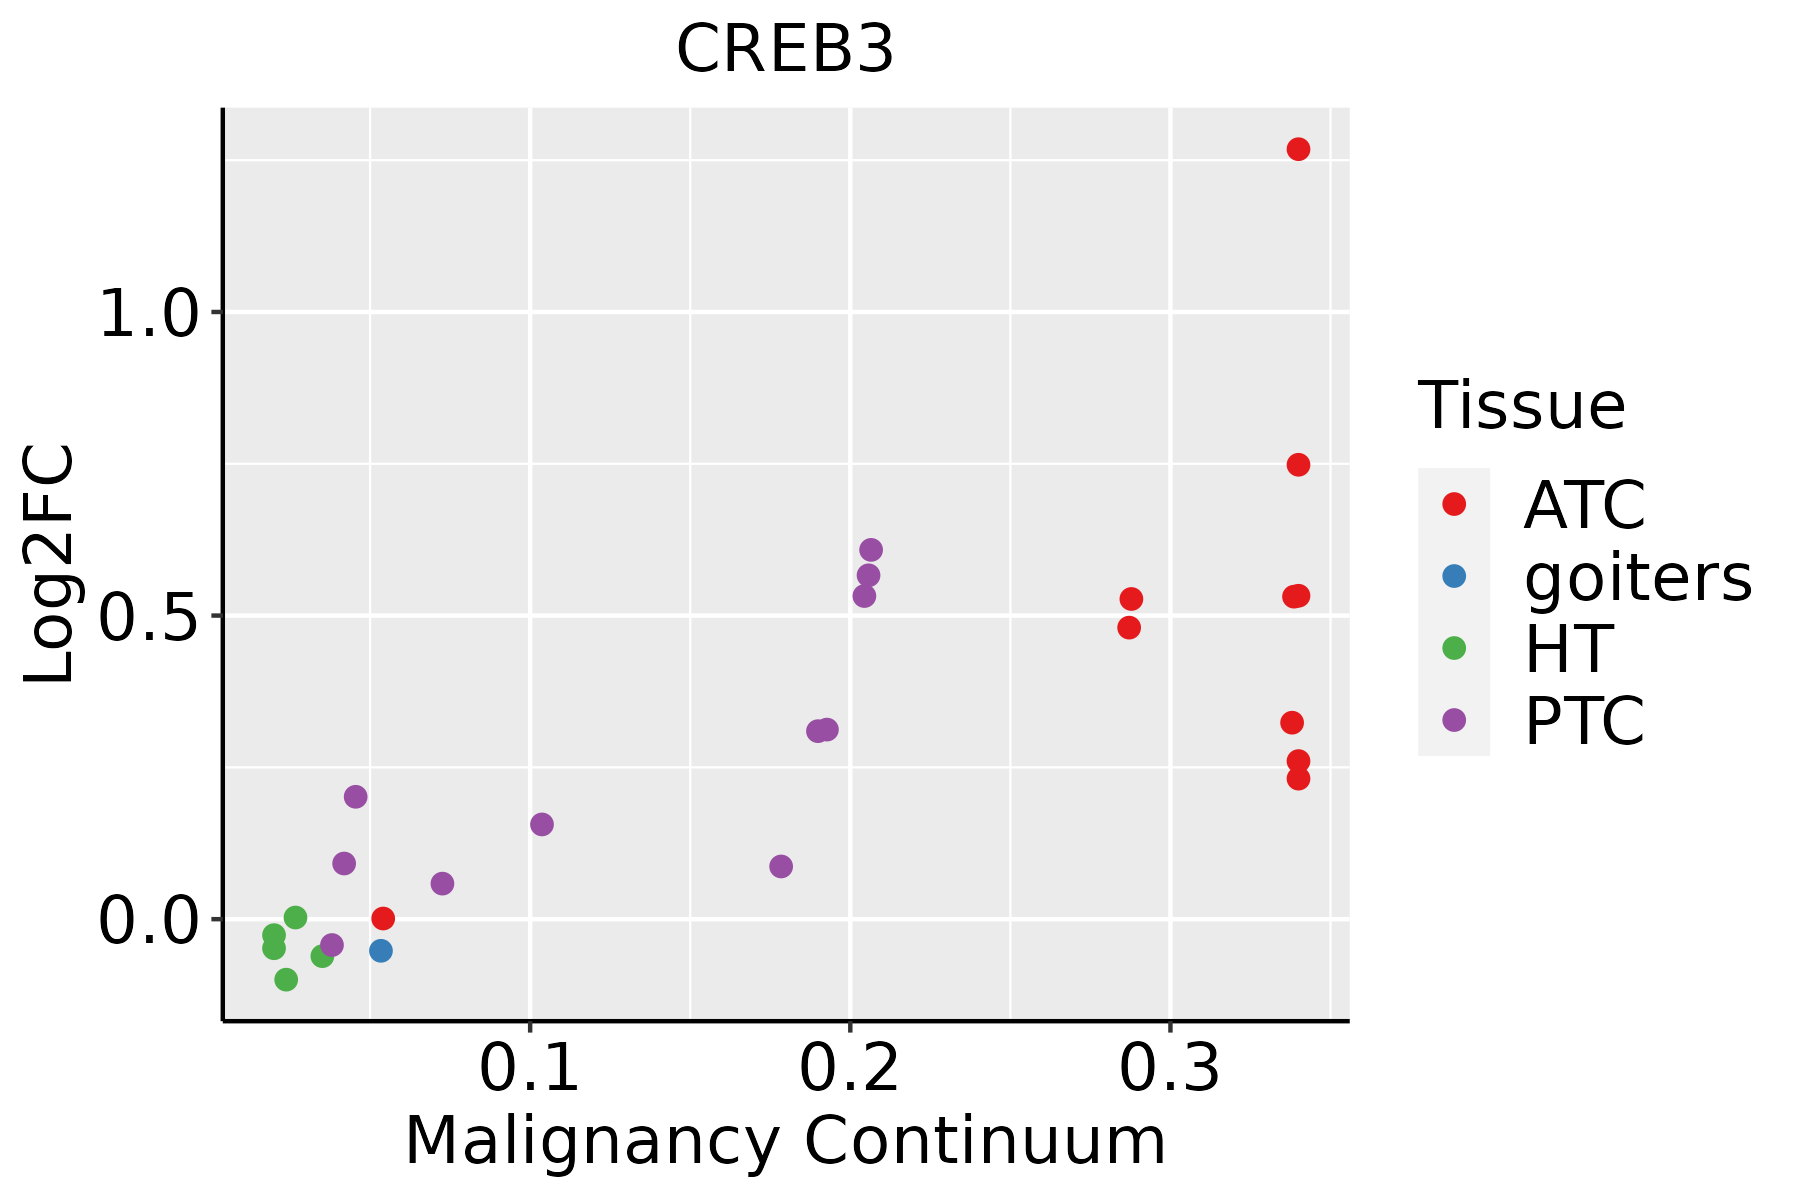 | ATC: Anaplastic thyroid cancer |
| HT: Hashimoto's thyroiditis | ||
| PTC: Papillary thyroid cancer |
| ∗log2FC in expression of this searched gene in stem-like cells from each diseased tissue sample relative to stem-like cells in normal samples in each tissue plotted against the malignancy continuum. Samples are colored based on if they are from different disease stage. |
Top |
Malignant transformation related pathway analysis |
| Find out the enriched GO biological processes and KEGG pathways involved in transition from healthy to precancer to cancer |
| Tissue | Disease Stage | Enriched GO biological Processes |
| Colorectum | AD |  |
| Colorectum | SER |  |
| Colorectum | MSS |  |
| Colorectum | MSI-H |  |
| Colorectum | FAP |  |
| ∗Top 15 enriched GO BP terms are showed in the bar plot of each disease state in each tissue. Each row represents a significant GO biological process which is colored according to the -log10(p.adjust). |
| Page: 1 2 3 4 5 6 7 8 9 |
| GO ID | Tissue | Disease Stage | Description | Gene Ratio | Bg Ratio | pvalue | p.adjust | Count |
| GO:000698614 | Breast | IDC | response to unfolded protein | 30/1434 | 137/18723 | 1.24e-07 | 7.03e-06 | 30 |
| GO:003596614 | Breast | IDC | response to topologically incorrect protein | 32/1434 | 159/18723 | 3.71e-07 | 1.85e-05 | 32 |
| GO:003462013 | Breast | IDC | cellular response to unfolded protein | 23/1434 | 96/18723 | 6.73e-07 | 3.16e-05 | 23 |
| GO:003497614 | Breast | IDC | response to endoplasmic reticulum stress | 43/1434 | 256/18723 | 8.42e-07 | 3.82e-05 | 43 |
| GO:003596714 | Breast | IDC | cellular response to topologically incorrect protein | 24/1434 | 116/18723 | 6.27e-06 | 1.98e-04 | 24 |
| GO:003096812 | Breast | IDC | endoplasmic reticulum unfolded protein response | 17/1434 | 74/18723 | 3.37e-05 | 7.79e-04 | 17 |
| GO:000698622 | Breast | DCIS | response to unfolded protein | 30/1390 | 137/18723 | 6.24e-08 | 3.72e-06 | 30 |
| GO:003596622 | Breast | DCIS | response to topologically incorrect protein | 32/1390 | 159/18723 | 1.84e-07 | 9.15e-06 | 32 |
| GO:003497622 | Breast | DCIS | response to endoplasmic reticulum stress | 43/1390 | 256/18723 | 3.65e-07 | 1.71e-05 | 43 |
| GO:003462022 | Breast | DCIS | cellular response to unfolded protein | 23/1390 | 96/18723 | 3.90e-07 | 1.79e-05 | 23 |
| GO:003596722 | Breast | DCIS | cellular response to topologically incorrect protein | 24/1390 | 116/18723 | 3.68e-06 | 1.16e-04 | 24 |
| GO:003096821 | Breast | DCIS | endoplasmic reticulum unfolded protein response | 17/1390 | 74/18723 | 2.26e-05 | 5.32e-04 | 17 |
| GO:0097193 | Colorectum | AD | intrinsic apoptotic signaling pathway | 108/3918 | 288/18723 | 6.25e-11 | 6.41e-09 | 108 |
| GO:2001242 | Colorectum | AD | regulation of intrinsic apoptotic signaling pathway | 67/3918 | 164/18723 | 4.94e-09 | 3.16e-07 | 67 |
| GO:2001233 | Colorectum | AD | regulation of apoptotic signaling pathway | 119/3918 | 356/18723 | 2.14e-08 | 1.21e-06 | 119 |
| GO:0034976 | Colorectum | AD | response to endoplasmic reticulum stress | 90/3918 | 256/18723 | 8.48e-08 | 4.28e-06 | 90 |
| GO:0070059 | Colorectum | AD | intrinsic apoptotic signaling pathway in response to endoplasmic reticulum stress | 29/3918 | 63/18723 | 7.03e-06 | 1.73e-04 | 29 |
| GO:2001234 | Colorectum | AD | negative regulation of apoptotic signaling pathway | 74/3918 | 224/18723 | 1.49e-05 | 3.18e-04 | 74 |
| GO:2001243 | Colorectum | AD | negative regulation of intrinsic apoptotic signaling pathway | 39/3918 | 98/18723 | 1.58e-05 | 3.34e-04 | 39 |
| GO:0035966 | Colorectum | AD | response to topologically incorrect protein | 54/3918 | 159/18723 | 8.85e-05 | 1.36e-03 | 54 |
| Page: 1 2 3 4 5 6 7 8 9 10 11 12 13 14 15 16 17 18 19 20 |
| Pathway ID | Tissue | Disease Stage | Description | Gene Ratio | Bg Ratio | pvalue | p.adjust | qvalue | Count |
| hsa05016210 | Esophagus | ESCC | Huntington disease | 226/4205 | 306/8465 | 1.38e-18 | 8.72e-17 | 4.46e-17 | 226 |
| hsa05166211 | Esophagus | ESCC | Human T-cell leukemia virus 1 infection | 164/4205 | 222/8465 | 8.13e-14 | 2.09e-12 | 1.07e-12 | 164 |
| hsa05020210 | Esophagus | ESCC | Prion disease | 193/4205 | 273/8465 | 6.42e-13 | 1.34e-11 | 6.89e-12 | 193 |
| hsa04714211 | Esophagus | ESCC | Thermogenesis | 163/4205 | 232/8465 | 9.22e-11 | 1.14e-09 | 5.86e-10 | 163 |
| hsa0466810 | Esophagus | ESCC | TNF signaling pathway | 89/4205 | 114/8465 | 3.36e-10 | 4.01e-09 | 2.06e-09 | 89 |
| hsa0516510 | Esophagus | ESCC | Human papillomavirus infection | 215/4205 | 331/8465 | 7.86e-09 | 7.12e-08 | 3.65e-08 | 215 |
| hsa0520325 | Esophagus | ESCC | Viral carcinogenesis | 137/4205 | 204/8465 | 2.47e-07 | 1.88e-06 | 9.62e-07 | 137 |
| hsa05163210 | Esophagus | ESCC | Human cytomegalovirus infection | 148/4205 | 225/8465 | 5.73e-07 | 4.00e-06 | 2.05e-06 | 148 |
| hsa0521516 | Esophagus | ESCC | Prostate cancer | 72/4205 | 97/8465 | 6.12e-07 | 4.10e-06 | 2.10e-06 | 72 |
| hsa051619 | Esophagus | ESCC | Hepatitis B | 108/4205 | 162/8465 | 7.68e-06 | 4.15e-05 | 2.12e-05 | 108 |
| hsa0415210 | Esophagus | ESCC | AMPK signaling pathway | 80/4205 | 121/8465 | 1.73e-04 | 6.67e-04 | 3.42e-04 | 80 |
| hsa0496223 | Esophagus | ESCC | Vasopressin-regulated water reabsorption | 33/4205 | 44/8465 | 5.27e-04 | 1.78e-03 | 9.13e-04 | 33 |
| hsa049268 | Esophagus | ESCC | Relaxin signaling pathway | 81/4205 | 129/8465 | 1.72e-03 | 5.09e-03 | 2.61e-03 | 81 |
| hsa049318 | Esophagus | ESCC | Insulin resistance | 69/4205 | 108/8465 | 1.92e-03 | 5.54e-03 | 2.84e-03 | 69 |
| hsa0421114 | Esophagus | ESCC | Longevity regulating pathway | 58/4205 | 89/8465 | 2.19e-03 | 6.16e-03 | 3.16e-03 | 58 |
| hsa0492816 | Esophagus | ESCC | Parathyroid hormone synthesis, secretion and action | 66/4205 | 106/8465 | 5.86e-03 | 1.47e-02 | 7.51e-03 | 66 |
| hsa041517 | Esophagus | ESCC | PI3K-Akt signaling pathway | 197/4205 | 354/8465 | 1.24e-02 | 2.83e-02 | 1.45e-02 | 197 |
| hsa0492214 | Esophagus | ESCC | Glucagon signaling pathway | 64/4205 | 107/8465 | 2.18e-02 | 4.80e-02 | 2.46e-02 | 64 |
| hsa0501638 | Esophagus | ESCC | Huntington disease | 226/4205 | 306/8465 | 1.38e-18 | 8.72e-17 | 4.46e-17 | 226 |
| hsa05166310 | Esophagus | ESCC | Human T-cell leukemia virus 1 infection | 164/4205 | 222/8465 | 8.13e-14 | 2.09e-12 | 1.07e-12 | 164 |
| Page: 1 2 3 4 5 6 7 |
Top |
Cell-cell communication analysis |
| Identification of potential cell-cell interactions between two cell types and their ligand-receptor pairs for different disease states |
| Ligand | Receptor | LRpair | Pathway | Tissue | Disease Stage |
| Page: 1 |
Top |
Single-cell gene regulatory network inference analysis |
| Find out the significant the regulons (TFs) and the target genes of each regulon across cell types for different disease states |
| TF | Cell Type | Tissue | Disease Stage | Target Gene | RSS | Regulon Activity |
| CREB3 | PLA | Breast | Healthy | FANCB,ZNF737,EPCAM, etc. | 8.86e-02 |  |
| CREB3 | PLA | Breast | IDC | FANCB,ZNF737,EPCAM, etc. | 1.78e-01 |  |
| CREB3 | PLA | Breast | Precancer | FANCB,ZNF737,EPCAM, etc. | 1.27e-01 |  |
| CREB3 | SEC | Liver | Healthy | RPL22L1,FKBP11,GATA3, etc. | 6.93e-01 |  |
| CREB3 | PLA | Lung | IAC | GBP4,PTCH2,GBP1, etc. | 1.09e-01 |  |
| CREB3 | PLA | Oral cavity | ADJ | PRPF6,RAB38,ARF4, etc. | 1.02e-01 |  |
| CREB3 | PLA | Oral cavity | OSCC | PRPF6,RAB38,ARF4, etc. | 1.62e-01 |  |
| CREB3 | PLA | Stomach | CAG | AQP3,SLC24A1,UST, etc. | 4.72e-01 |  |
| CREB3 | PLA | Stomach | CAG with IM | AQP3,SLC24A1,UST, etc. | 4.89e-01 |  |
| CREB3 | PLA | Stomach | CSG | AQP3,SLC24A1,UST, etc. | 5.54e-01 |  |
| ∗The dot plots of a searched regulon are shown for all cell subpopulations in each disease state of each tissue based on the regulon specific score inferred using pySCENIC and by calculating the average expression. |
| Page: 1 2 |
Top |
Somatic mutation of malignant transformation related genes |
| Annotation of somatic variants for genes involved in malignant transformation |
| Hugo Symbol | Variant Class | Variant Classification | dbSNP RS | HGVSc | HGVSp | HGVSp Short | SWISSPROT | BIOTYPE | SIFT | PolyPhen | Tumor Sample Barcode | Tissue | Histology | Sex | Age | Stage | Therapy Types | Drugs | Outcome |
| CREB3 | SNV | Missense_Mutation | c.46N>A | p.Leu16Met | p.L16M | O43889 | protein_coding | deleterious(0) | probably_damaging(0.999) | TCGA-A2-A04U-01 | Breast | breast invasive carcinoma | Female | <65 | I/II | Chemotherapy | adriamycin | SD | |
| CREB3 | SNV | Missense_Mutation | novel | c.916N>A | p.Gly306Ser | p.G306S | O43889 | protein_coding | tolerated(0.39) | benign(0.041) | TCGA-2W-A8YY-01 | Cervix | cervical & endocervical cancer | Female | <65 | I/II | Chemotherapy | cisplatin | CR |
| CREB3 | SNV | Missense_Mutation | c.710C>T | p.Ser237Phe | p.S237F | O43889 | protein_coding | deleterious(0.01) | probably_damaging(0.999) | TCGA-Q1-A5R1-01 | Cervix | cervical & endocervical cancer | Female | <65 | I/II | Unknown | Unknown | SD | |
| CREB3 | SNV | Missense_Mutation | rs754545426 | c.499N>G | p.Ser167Gly | p.S167G | O43889 | protein_coding | deleterious(0) | probably_damaging(0.998) | TCGA-AD-6965-01 | Colorectum | colon adenocarcinoma | Male | <65 | III/IV | Chemotherapy | oxaliplatin | PD |
| CREB3 | SNV | Missense_Mutation | c.799C>T | p.Arg267Cys | p.R267C | O43889 | protein_coding | deleterious(0) | probably_damaging(0.987) | TCGA-AY-A71X-01 | Colorectum | colon adenocarcinoma | Female | <65 | I/II | Unknown | Unknown | SD | |
| CREB3 | SNV | Missense_Mutation | c.134N>G | p.Pro45Arg | p.P45R | O43889 | protein_coding | tolerated(0.16) | benign(0.32) | TCGA-AG-3894-01 | Colorectum | rectum adenocarcinoma | Male | >=65 | I/II | Chemotherapy | 5-fluorouracil | CR | |
| CREB3 | SNV | Missense_Mutation | c.290N>A | p.Cys97Tyr | p.C97Y | O43889 | protein_coding | tolerated(1) | benign(0) | TCGA-EI-6509-01 | Colorectum | rectum adenocarcinoma | Male | <65 | III/IV | Chemotherapy | folfox | PD | |
| CREB3 | SNV | Missense_Mutation | novel | c.447N>C | p.Gln149His | p.Q149H | O43889 | protein_coding | deleterious(0.03) | benign(0.198) | TCGA-F5-6814-01 | Colorectum | rectum adenocarcinoma | Male | <65 | I/II | Unknown | Unknown | SD |
| CREB3 | deletion | Frame_Shift_Del | c.178delN | p.Pro61GlnfsTer4 | p.P61Qfs*4 | O43889 | protein_coding | TCGA-AA-3672-01 | Colorectum | colon adenocarcinoma | Female | >=65 | III/IV | Unknown | Unknown | SD | |||
| CREB3 | deletion | Frame_Shift_Del | novel | c.282_285delTGAG | p.Ser94ArgfsTer10 | p.S94Rfs*10 | O43889 | protein_coding | TCGA-AA-3845-01 | Colorectum | colon adenocarcinoma | Female | >=65 | I/II | Unknown | Unknown | PD |
| Page: 1 2 3 4 |
Top |
Related drugs of malignant transformation related genes |
| Identification of chemicals and drugs interact with genes involved in malignant transfromation |
| (DGIdb 4.0) |
| Entrez ID | Symbol | Category | Interaction Types | Drug Claim Name | Drug Name | PMIDs |
| Page: 1 |

Copyright 2023-Present -The University of Texas Health Science Center at Houston |