
|
|||||
|
 | |
| |
| |
| |
| |
| |
|
Gene: CRCP |
Gene summary for CRCP |
| Gene information | Species | Human | Gene symbol | CRCP | Gene ID | 27297 |
| Gene name | CGRP receptor component | |
| Gene Alias | C17 | |
| Cytomap | 7q11.21 | |
| Gene Type | protein-coding | GO ID | GO:0002376 | UniProtAcc | O75575 |
Top |
Malignant transformation analysis |
| Identification of the aberrant gene expression in precancerous and cancerous lesions by comparing the gene expression of stem-like cells in diseased tissues with normal stem cells |
| Entrez ID | Symbol | Replicates | Species | Organ | Tissue | Adj P-value | Log2FC | Malignancy |
| 27297 | CRCP | LZE4T | Human | Esophagus | ESCC | 3.07e-05 | 2.45e-01 | 0.0811 |
| 27297 | CRCP | LZE7T | Human | Esophagus | ESCC | 6.56e-03 | 1.60e-01 | 0.0667 |
| 27297 | CRCP | LZE20T | Human | Esophagus | ESCC | 2.00e-03 | 1.11e-01 | 0.0662 |
| 27297 | CRCP | LZE24T | Human | Esophagus | ESCC | 6.13e-10 | 3.38e-01 | 0.0596 |
| 27297 | CRCP | LZE6T | Human | Esophagus | ESCC | 1.99e-02 | 1.02e-01 | 0.0845 |
| 27297 | CRCP | P1T-E | Human | Esophagus | ESCC | 7.15e-10 | 5.02e-01 | 0.0875 |
| 27297 | CRCP | P2T-E | Human | Esophagus | ESCC | 3.41e-36 | 6.22e-01 | 0.1177 |
| 27297 | CRCP | P4T-E | Human | Esophagus | ESCC | 1.79e-28 | 6.14e-01 | 0.1323 |
| 27297 | CRCP | P5T-E | Human | Esophagus | ESCC | 1.06e-17 | 3.85e-01 | 0.1327 |
| 27297 | CRCP | P8T-E | Human | Esophagus | ESCC | 1.13e-25 | 4.39e-01 | 0.0889 |
| 27297 | CRCP | P9T-E | Human | Esophagus | ESCC | 8.12e-15 | 2.37e-01 | 0.1131 |
| 27297 | CRCP | P10T-E | Human | Esophagus | ESCC | 6.69e-29 | 5.01e-01 | 0.116 |
| 27297 | CRCP | P11T-E | Human | Esophagus | ESCC | 7.90e-08 | 3.74e-01 | 0.1426 |
| 27297 | CRCP | P12T-E | Human | Esophagus | ESCC | 1.02e-36 | 6.74e-01 | 0.1122 |
| 27297 | CRCP | P15T-E | Human | Esophagus | ESCC | 5.61e-24 | 5.08e-01 | 0.1149 |
| 27297 | CRCP | P16T-E | Human | Esophagus | ESCC | 5.42e-42 | 7.37e-01 | 0.1153 |
| 27297 | CRCP | P17T-E | Human | Esophagus | ESCC | 1.02e-04 | 2.31e-01 | 0.1278 |
| 27297 | CRCP | P19T-E | Human | Esophagus | ESCC | 3.99e-02 | 4.37e-01 | 0.1662 |
| 27297 | CRCP | P20T-E | Human | Esophagus | ESCC | 3.31e-26 | 5.50e-01 | 0.1124 |
| 27297 | CRCP | P21T-E | Human | Esophagus | ESCC | 3.50e-24 | 5.14e-01 | 0.1617 |
| Page: 1 2 3 4 5 6 |
| Tissue | Expression Dynamics | Abbreviation |
| Esophagus | 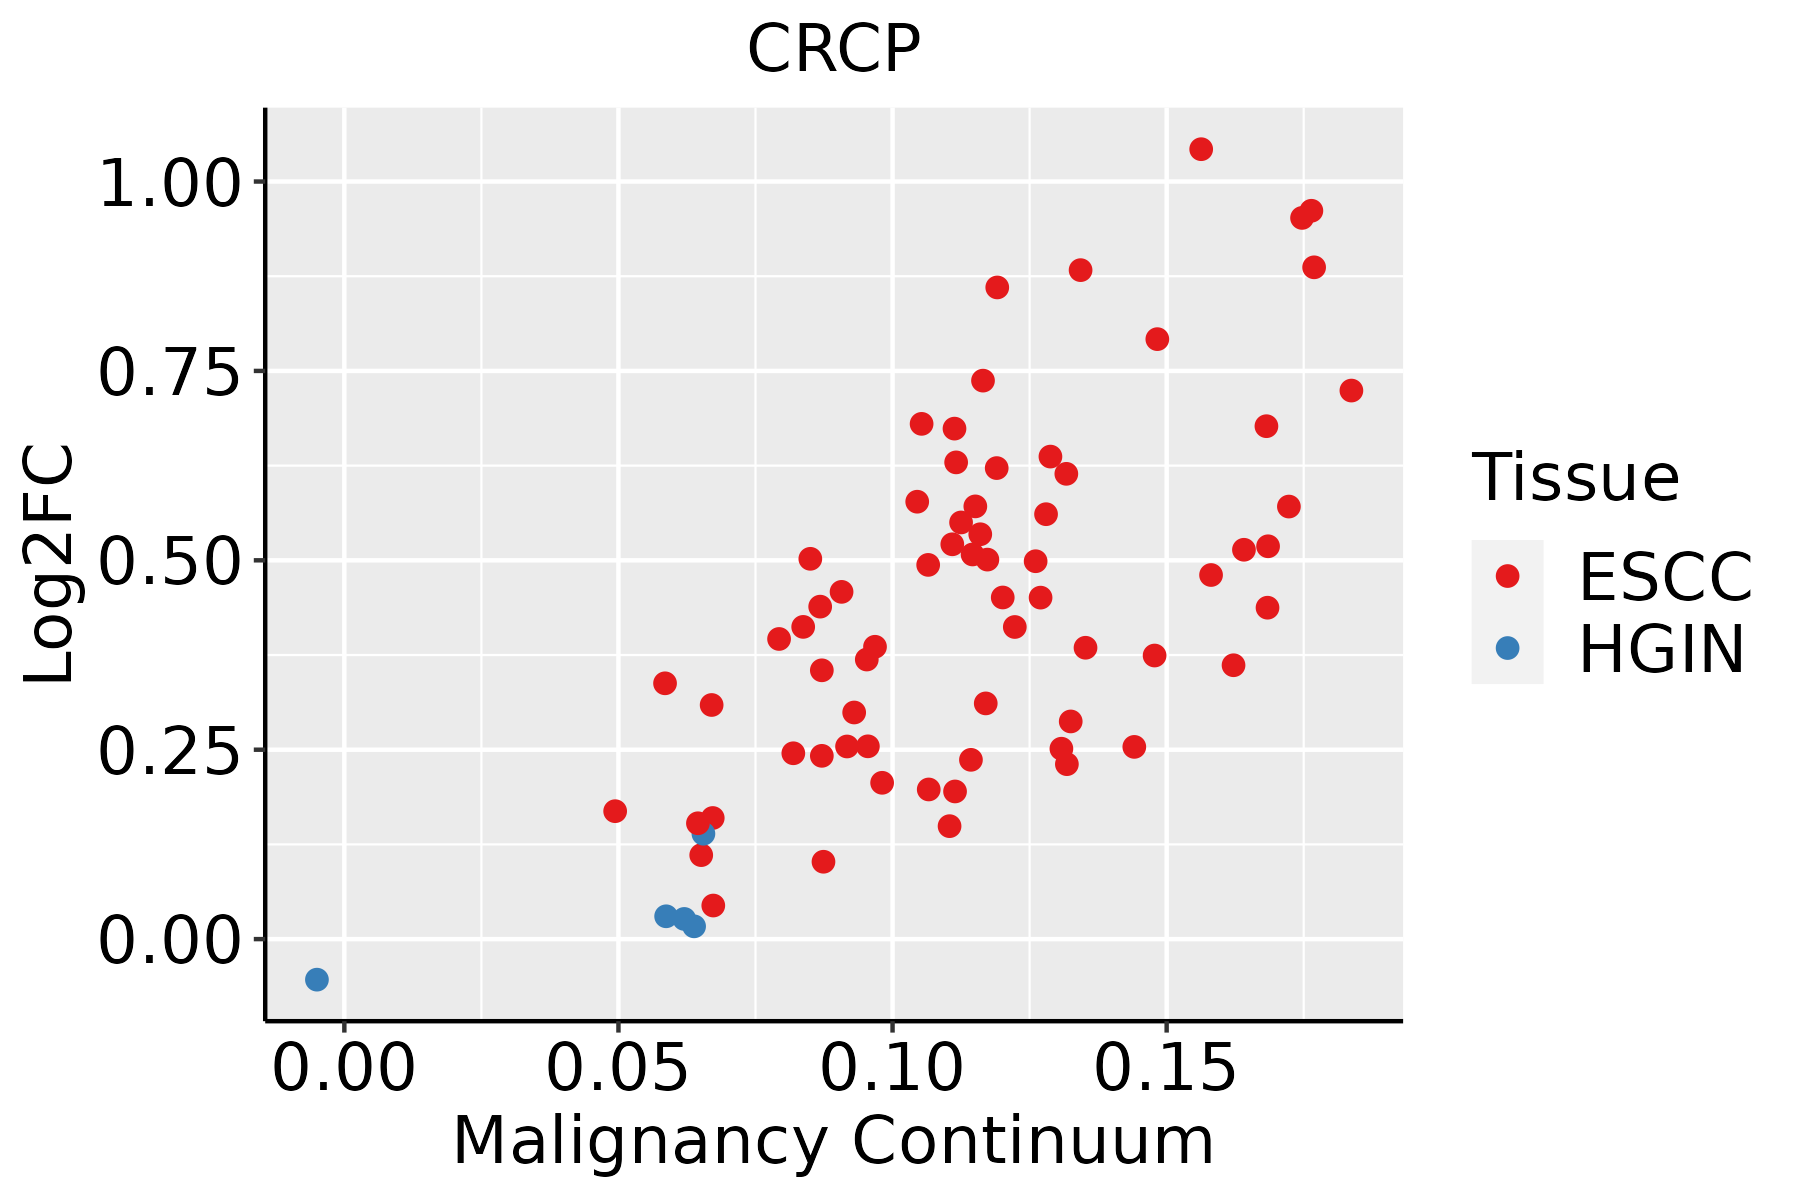 | ESCC: Esophageal squamous cell carcinoma |
| HGIN: High-grade intraepithelial neoplasias | ||
| LGIN: Low-grade intraepithelial neoplasias | ||
| Liver |  | HCC: Hepatocellular carcinoma |
| NAFLD: Non-alcoholic fatty liver disease | ||
| Oral Cavity |  | EOLP: Erosive Oral lichen planus |
| LP: leukoplakia | ||
| NEOLP: Non-erosive oral lichen planus | ||
| OSCC: Oral squamous cell carcinoma | ||
| Skin | 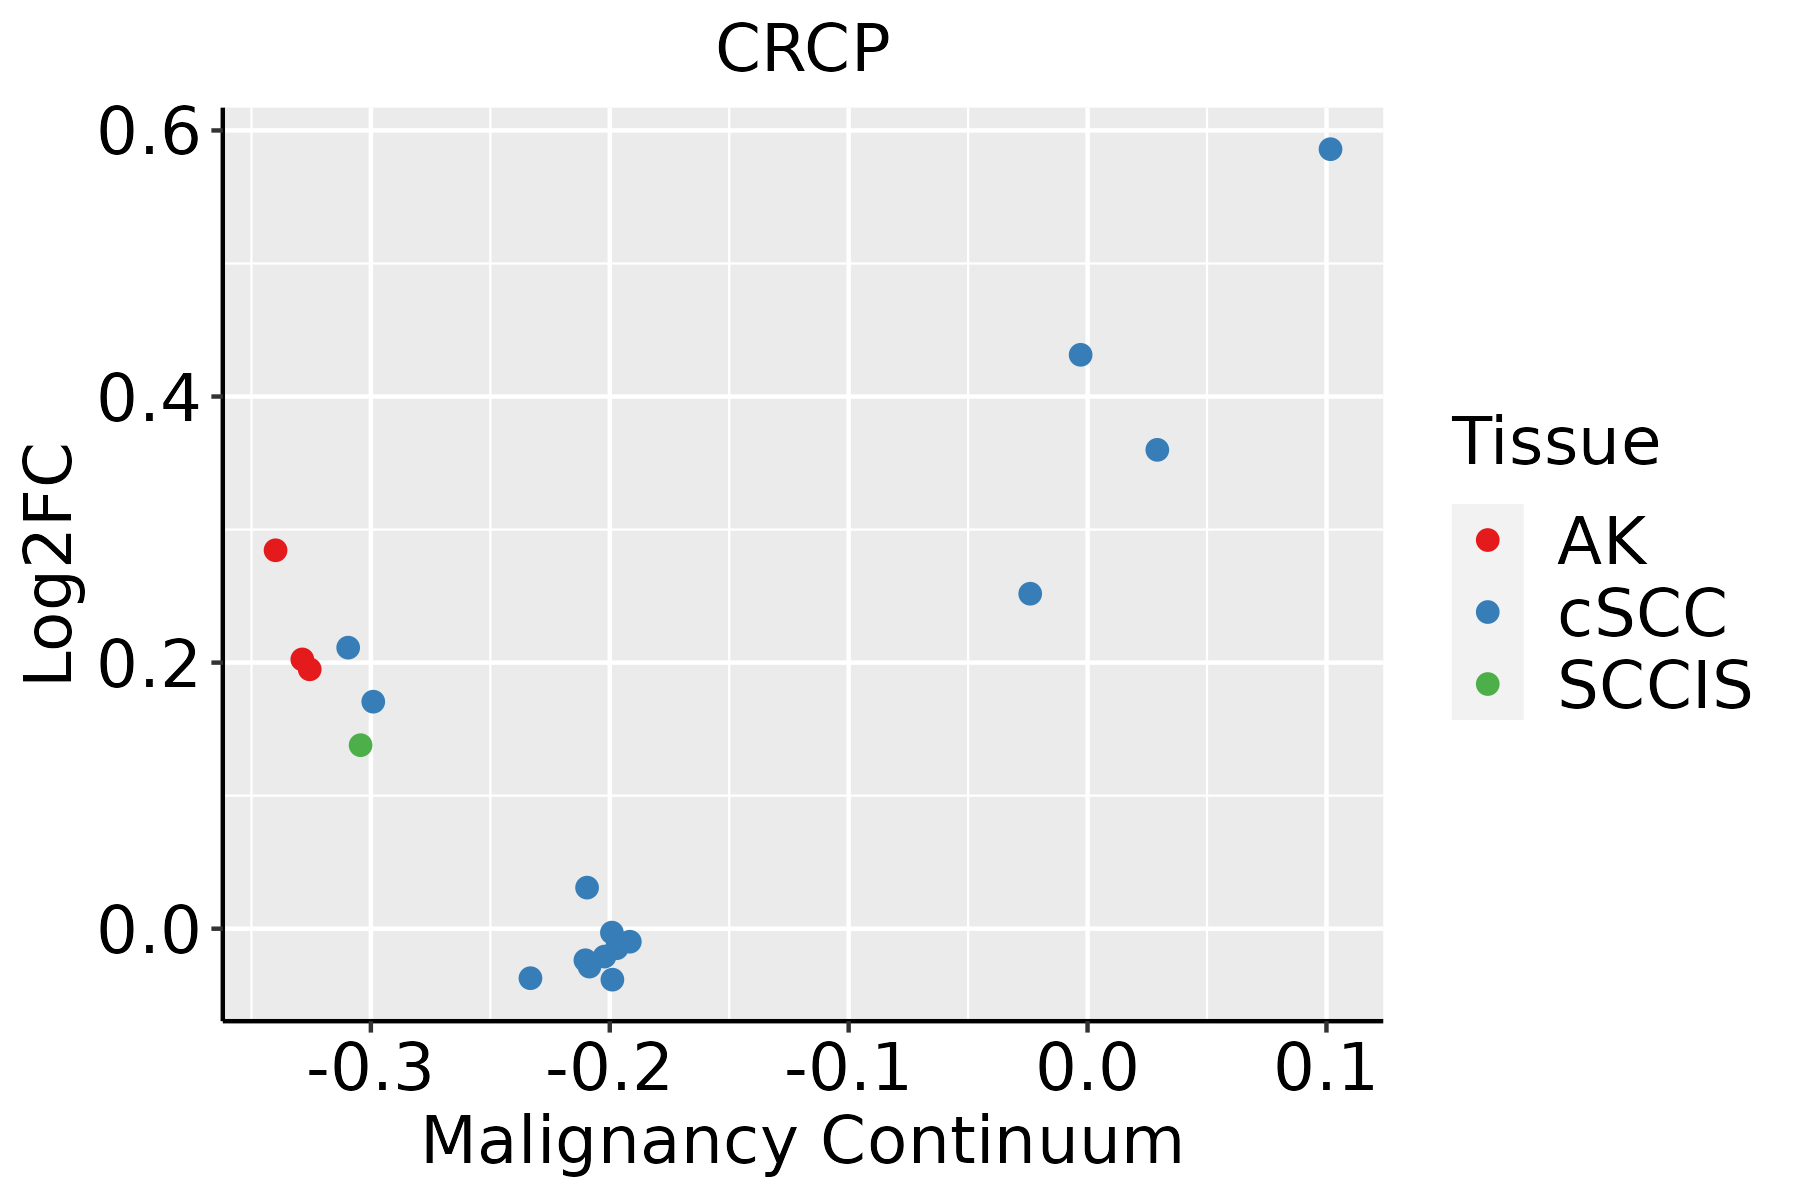 | AK: Actinic keratosis |
| cSCC: Cutaneous squamous cell carcinoma | ||
| SCCIS:squamous cell carcinoma in situ | ||
| Thyroid | 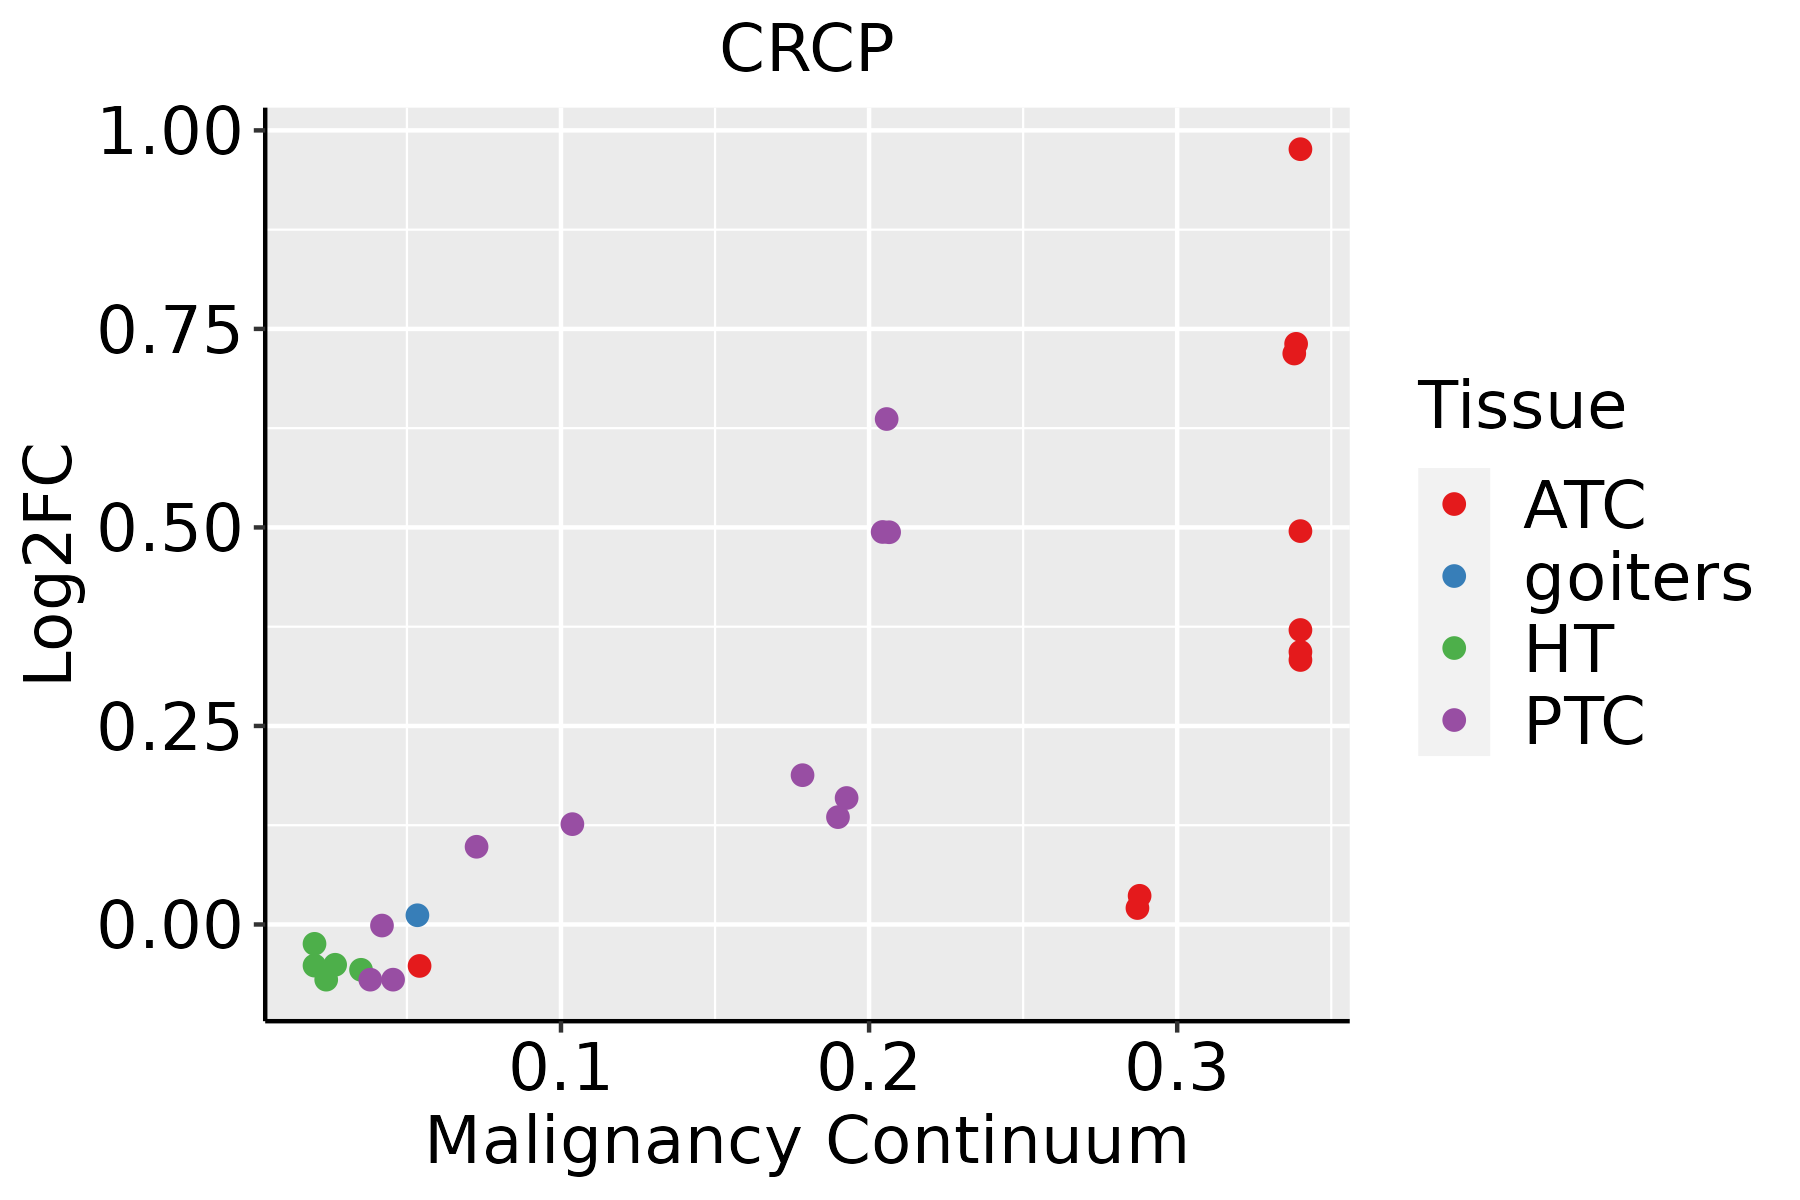 | ATC: Anaplastic thyroid cancer |
| HT: Hashimoto's thyroiditis | ||
| PTC: Papillary thyroid cancer |
| ∗log2FC in expression of this searched gene in stem-like cells from each diseased tissue sample relative to stem-like cells in normal samples in each tissue plotted against the malignancy continuum. Samples are colored based on if they are from different disease stage. |
Top |
Malignant transformation related pathway analysis |
| Find out the enriched GO biological processes and KEGG pathways involved in transition from healthy to precancer to cancer |
| Tissue | Disease Stage | Enriched GO biological Processes |
| Colorectum | AD |  |
| Colorectum | SER |  |
| Colorectum | MSS |  |
| Colorectum | MSI-H |  |
| Colorectum | FAP |  |
| ∗Top 15 enriched GO BP terms are showed in the bar plot of each disease state in each tissue. Each row represents a significant GO biological process which is colored according to the -log10(p.adjust). |
| Page: 1 2 3 4 5 6 7 8 9 |
| GO ID | Tissue | Disease Stage | Description | Gene Ratio | Bg Ratio | pvalue | p.adjust | Count |
| GO:000961518 | Esophagus | ESCC | response to virus | 238/8552 | 367/18723 | 6.65e-14 | 3.32e-12 | 238 |
| GO:00516075 | Esophagus | ESCC | defense response to virus | 171/8552 | 265/18723 | 3.91e-10 | 1.05e-08 | 171 |
| GO:01405465 | Esophagus | ESCC | defense response to symbiont | 171/8552 | 265/18723 | 3.91e-10 | 1.05e-08 | 171 |
| GO:00063833 | Esophagus | ESCC | transcription by RNA polymerase III | 41/8552 | 46/18723 | 7.69e-10 | 1.90e-08 | 41 |
| GO:000635211 | Esophagus | ESCC | DNA-templated transcription, initiation | 86/8552 | 130/18723 | 1.88e-06 | 2.19e-05 | 86 |
| GO:000961511 | Liver | HCC | response to virus | 210/7958 | 367/18723 | 7.32e-09 | 1.86e-07 | 210 |
| GO:00516071 | Liver | HCC | defense response to virus | 151/7958 | 265/18723 | 1.27e-06 | 1.85e-05 | 151 |
| GO:01405461 | Liver | HCC | defense response to symbiont | 151/7958 | 265/18723 | 1.27e-06 | 1.85e-05 | 151 |
| GO:0006352 | Liver | HCC | DNA-templated transcription, initiation | 78/7958 | 130/18723 | 4.19e-05 | 4.11e-04 | 78 |
| GO:0006383 | Liver | HCC | transcription by RNA polymerase III | 31/7958 | 46/18723 | 5.67e-04 | 3.61e-03 | 31 |
| GO:000961515 | Oral cavity | OSCC | response to virus | 215/7305 | 367/18723 | 1.63e-14 | 9.41e-13 | 215 |
| GO:00516074 | Oral cavity | OSCC | defense response to virus | 154/7305 | 265/18723 | 1.96e-10 | 5.63e-09 | 154 |
| GO:01405464 | Oral cavity | OSCC | defense response to symbiont | 154/7305 | 265/18723 | 1.96e-10 | 5.63e-09 | 154 |
| GO:00063832 | Oral cavity | OSCC | transcription by RNA polymerase III | 34/7305 | 46/18723 | 1.61e-06 | 2.11e-05 | 34 |
| GO:00063522 | Oral cavity | OSCC | DNA-templated transcription, initiation | 74/7305 | 130/18723 | 2.56e-05 | 2.39e-04 | 74 |
| GO:000961519 | Skin | AK | response to virus | 63/1910 | 367/18723 | 2.53e-05 | 4.54e-04 | 63 |
| GO:00063524 | Skin | AK | DNA-templated transcription, initiation | 23/1910 | 130/18723 | 6.10e-03 | 3.29e-02 | 23 |
| GO:000961522 | Skin | cSCC | response to virus | 152/4864 | 367/18723 | 5.88e-11 | 2.75e-09 | 152 |
| GO:00516076 | Skin | cSCC | defense response to virus | 107/4864 | 265/18723 | 1.84e-07 | 4.02e-06 | 107 |
| GO:01405466 | Skin | cSCC | defense response to symbiont | 107/4864 | 265/18723 | 1.84e-07 | 4.02e-06 | 107 |
| Page: 1 2 |
| Pathway ID | Tissue | Disease Stage | Description | Gene Ratio | Bg Ratio | pvalue | p.adjust | qvalue | Count |
| hsa0302021 | Esophagus | ESCC | RNA polymerase | 28/4205 | 34/8465 | 8.19e-05 | 3.35e-04 | 1.71e-04 | 28 |
| hsa0302031 | Esophagus | ESCC | RNA polymerase | 28/4205 | 34/8465 | 8.19e-05 | 3.35e-04 | 1.71e-04 | 28 |
| hsa03020 | Liver | HCC | RNA polymerase | 24/4020 | 34/8465 | 5.40e-03 | 1.57e-02 | 8.75e-03 | 24 |
| hsa030201 | Liver | HCC | RNA polymerase | 24/4020 | 34/8465 | 5.40e-03 | 1.57e-02 | 8.75e-03 | 24 |
| hsa030204 | Oral cavity | OSCC | RNA polymerase | 25/3704 | 34/8465 | 4.12e-04 | 1.27e-03 | 6.45e-04 | 25 |
| hsa0302011 | Oral cavity | OSCC | RNA polymerase | 25/3704 | 34/8465 | 4.12e-04 | 1.27e-03 | 6.45e-04 | 25 |
| Page: 1 |
Top |
Cell-cell communication analysis |
| Identification of potential cell-cell interactions between two cell types and their ligand-receptor pairs for different disease states |
| Ligand | Receptor | LRpair | Pathway | Tissue | Disease Stage |
| Page: 1 |
Top |
Single-cell gene regulatory network inference analysis |
| Find out the significant the regulons (TFs) and the target genes of each regulon across cell types for different disease states |
| TF | Cell Type | Tissue | Disease Stage | Target Gene | RSS | Regulon Activity |
| ∗The dot plots of a searched regulon are shown for all cell subpopulations in each disease state of each tissue based on the regulon specific score inferred using pySCENIC and by calculating the average expression. |
| Page: 1 |
Top |
Somatic mutation of malignant transformation related genes |
| Annotation of somatic variants for genes involved in malignant transformation |
| Hugo Symbol | Variant Class | Variant Classification | dbSNP RS | HGVSc | HGVSp | HGVSp Short | SWISSPROT | BIOTYPE | SIFT | PolyPhen | Tumor Sample Barcode | Tissue | Histology | Sex | Age | Stage | Therapy Types | Drugs | Outcome |
| CRCP | SNV | Missense_Mutation | c.281N>T | p.Ala94Val | p.A94V | O75575 | protein_coding | deleterious(0.04) | possibly_damaging(0.871) | TCGA-CK-5916-01 | Colorectum | colon adenocarcinoma | Female | >=65 | I/II | Unknown | Unknown | PD | |
| CRCP | SNV | Missense_Mutation | novel | c.40N>C | p.Tyr14His | p.Y14H | O75575 | protein_coding | deleterious(0.03) | probably_damaging(0.985) | TCGA-AJ-A3EL-01 | Endometrium | uterine corpus endometrioid carcinoma | Female | <65 | I/II | Unknown | Unknown | SD |
| CRCP | SNV | Missense_Mutation | c.68N>C | p.Leu23Pro | p.L23P | O75575 | protein_coding | deleterious(0) | probably_damaging(0.997) | TCGA-B5-A11G-01 | Endometrium | uterine corpus endometrioid carcinoma | Female | >=65 | I/II | Unknown | Unknown | SD | |
| CRCP | SNV | Missense_Mutation | novel | c.178C>T | p.His60Tyr | p.H60Y | O75575 | protein_coding | tolerated(0.72) | benign(0.001) | TCGA-E6-A2P9-01 | Endometrium | uterine corpus endometrioid carcinoma | Female | >=65 | I/II | Unknown | Unknown | SD |
| CRCP | SNV | Missense_Mutation | novel | c.110N>T | p.Ser37Phe | p.S37F | O75575 | protein_coding | tolerated(0.2) | benign(0.153) | TCGA-EO-A22U-01 | Endometrium | uterine corpus endometrioid carcinoma | Female | >=65 | I/II | Unknown | Unknown | SD |
| CRCP | SNV | Missense_Mutation | c.293A>T | p.Gln98Leu | p.Q98L | O75575 | protein_coding | deleterious(0) | probably_damaging(0.934) | TCGA-50-6593-01 | Lung | lung adenocarcinoma | Female | <65 | III/IV | Unknown | Unknown | PD | |
| CRCP | SNV | Missense_Mutation | c.176G>A | p.Arg59Lys | p.R59K | O75575 | protein_coding | tolerated(0.92) | benign(0) | TCGA-37-4135-01 | Lung | lung squamous cell carcinoma | Male | >=65 | I/II | Unknown | Unknown | SD | |
| CRCP | deletion | Frame_Shift_Del | c.177delG | p.Arg59SerfsTer15 | p.R59Sfs*15 | O75575 | protein_coding | TCGA-69-7979-01 | Lung | lung adenocarcinoma | Female | >=65 | I/II | Unknown | Unknown | SD | |||
| CRCP | SNV | Missense_Mutation | c.248A>G | p.Lys83Arg | p.K83R | O75575 | protein_coding | deleterious(0) | probably_damaging(1) | TCGA-BR-8078-01 | Stomach | stomach adenocarcinoma | Female | >=65 | I/II | Unknown | Unknown | SD | |
| CRCP | SNV | Missense_Mutation | c.47T>C | p.Val16Ala | p.V16A | O75575 | protein_coding | deleterious(0.01) | probably_damaging(0.999) | TCGA-CG-5726-01 | Stomach | stomach adenocarcinoma | Male | >=65 | I/II | Unknown | Unknown | SD |
| Page: 1 |
Top |
Related drugs of malignant transformation related genes |
| Identification of chemicals and drugs interact with genes involved in malignant transfromation |
| (DGIdb 4.0) |
| Entrez ID | Symbol | Category | Interaction Types | Drug Claim Name | Drug Name | PMIDs |
| Page: 1 |

Copyright 2023-Present -The University of Texas Health Science Center at Houston |