| Tissue | Expression Dynamics | Abbreviation |
| Esophagus | 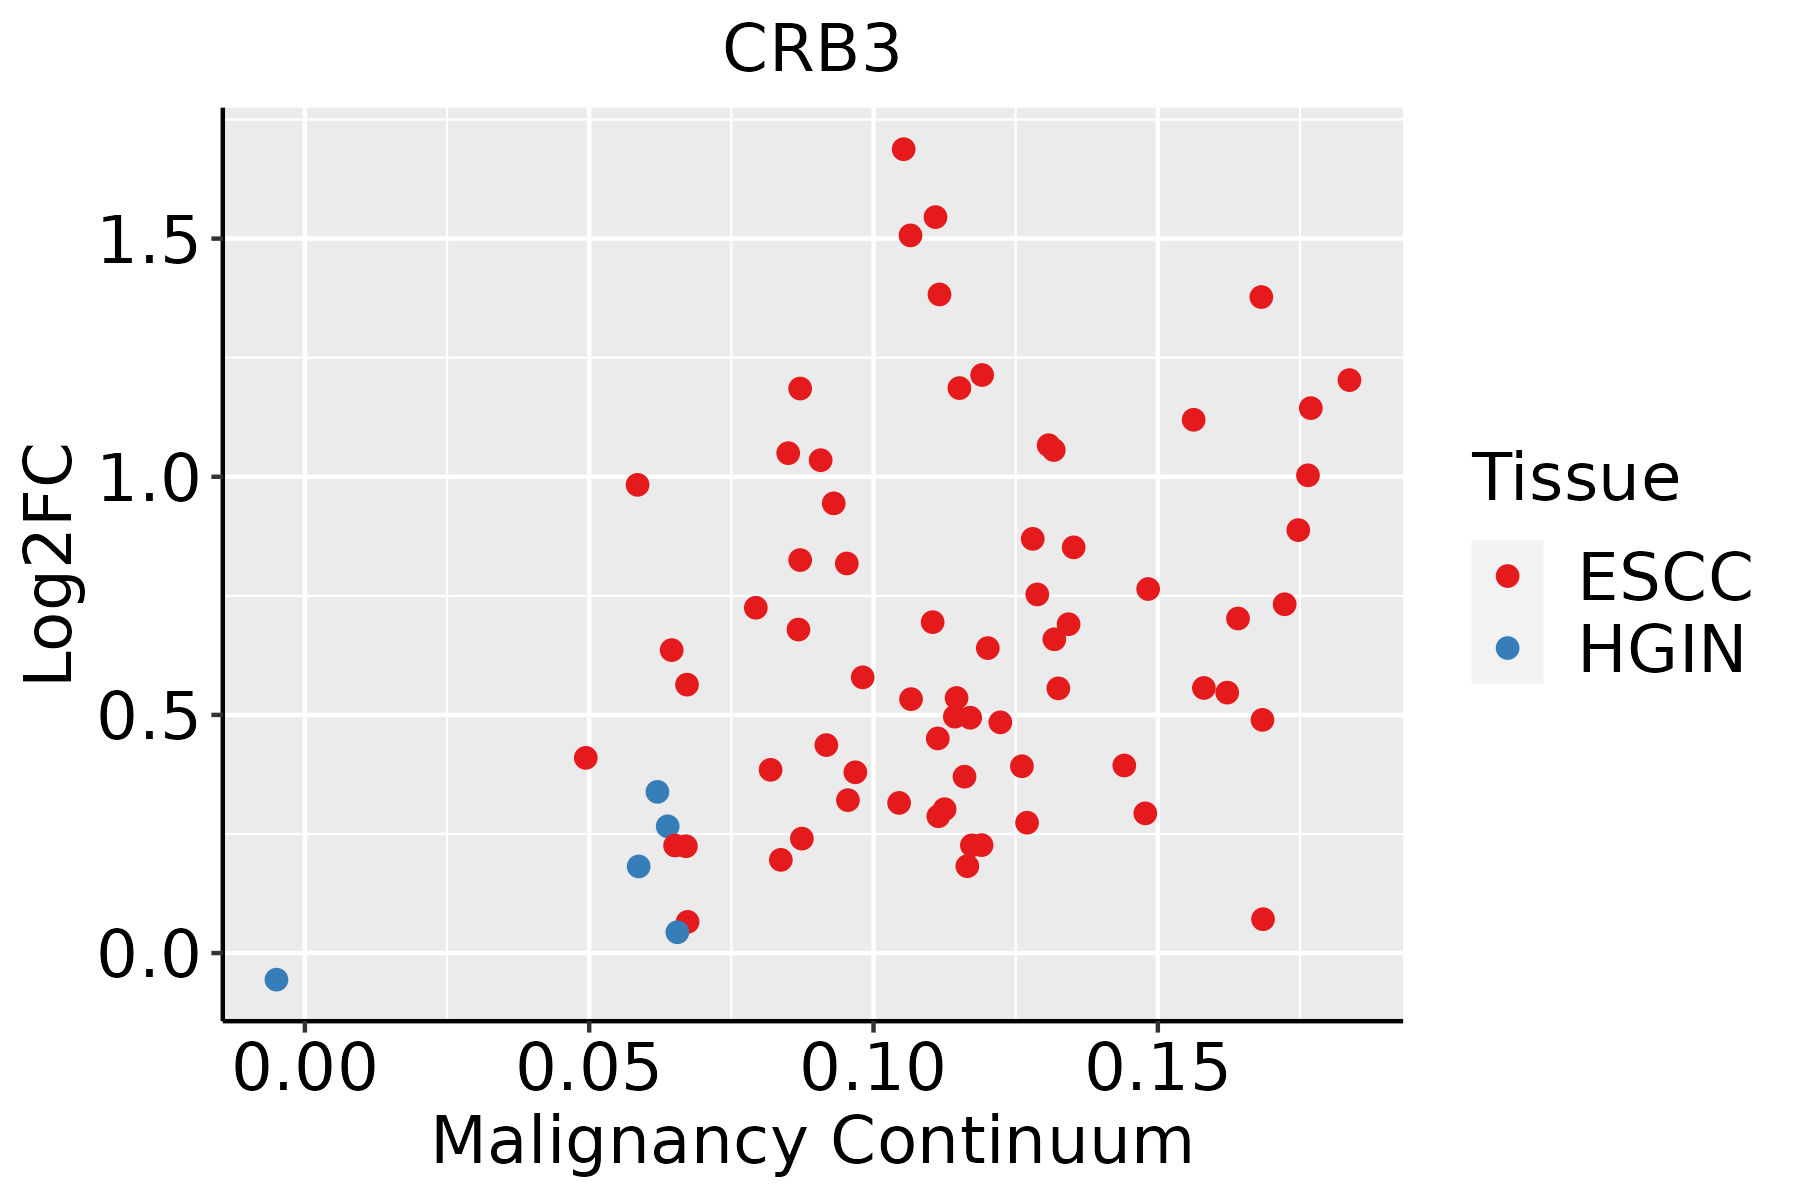 | ESCC: Esophageal squamous cell carcinoma |
| HGIN: High-grade intraepithelial neoplasias |
| LGIN: Low-grade intraepithelial neoplasias |
| Liver | 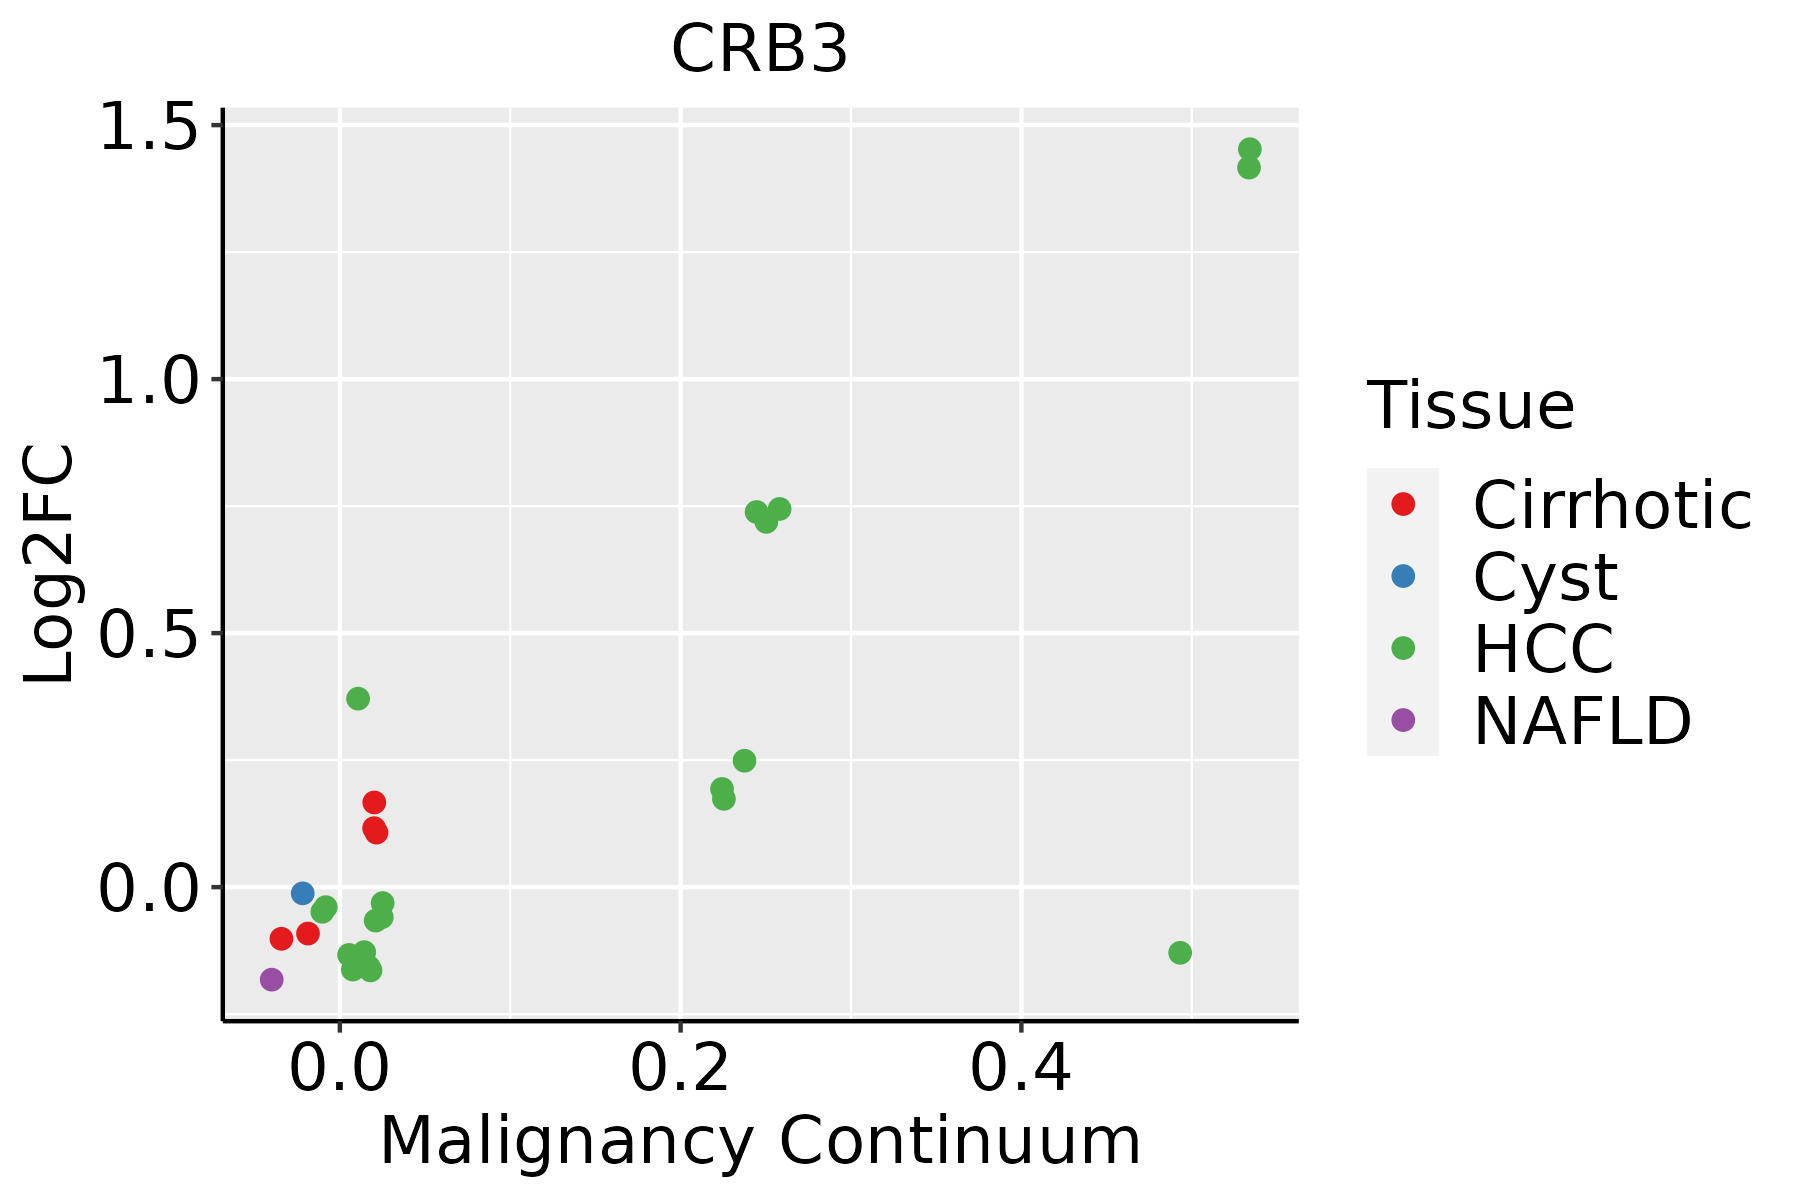 | HCC: Hepatocellular carcinoma |
| NAFLD: Non-alcoholic fatty liver disease |
| Oral Cavity | 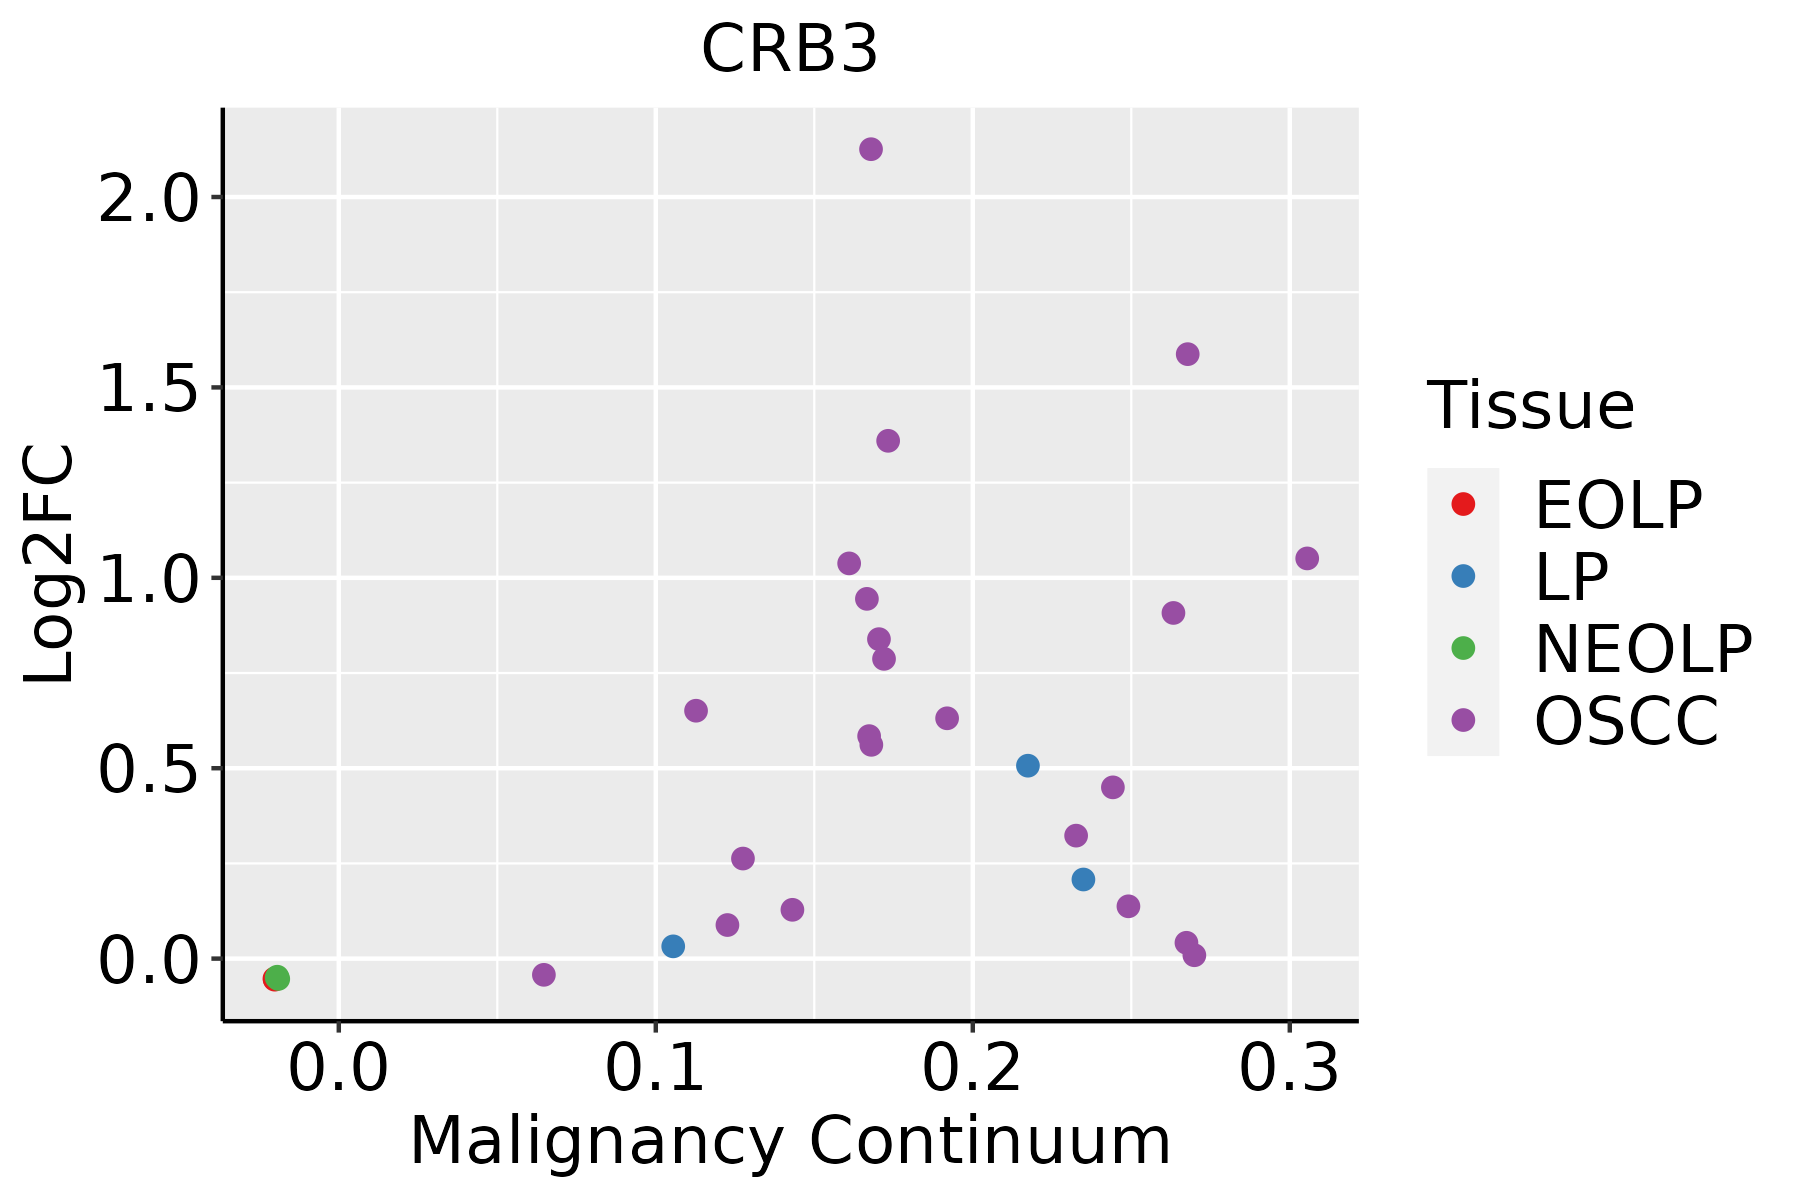 | EOLP: Erosive Oral lichen planus |
| LP: leukoplakia |
| NEOLP: Non-erosive oral lichen planus |
| OSCC: Oral squamous cell carcinoma |
| Prostate | 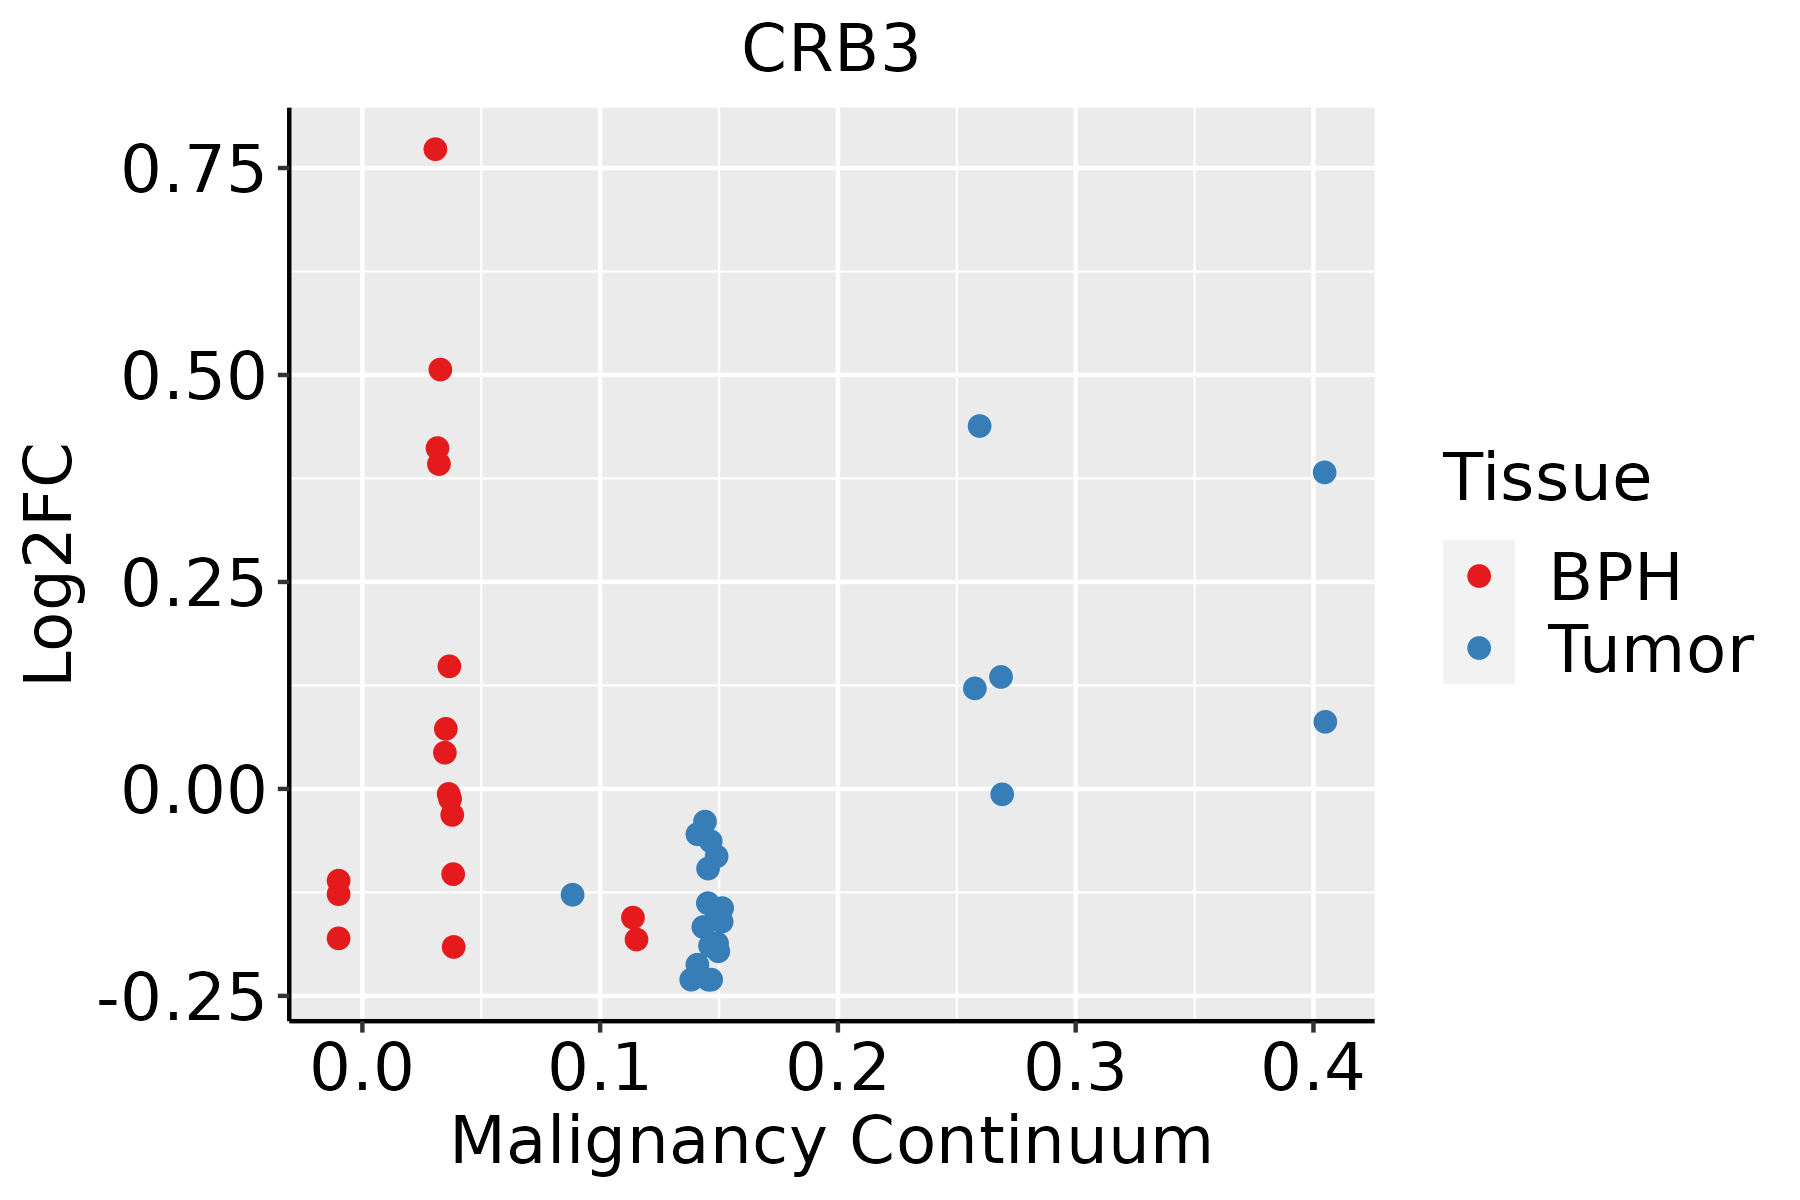 | BPH: Benign Prostatic Hyperplasia |
| Thyroid |  | ATC: Anaplastic thyroid cancer |
| HT: Hashimoto's thyroiditis |
| PTC: Papillary thyroid cancer |
| GO ID | Tissue | Disease Stage | Description | Gene Ratio | Bg Ratio | pvalue | p.adjust | Count |
| GO:007265920 | Esophagus | HGIN | protein localization to plasma membrane | 66/2587 | 284/18723 | 1.11e-05 | 3.18e-04 | 66 |
| GO:199077818 | Esophagus | HGIN | protein localization to cell periphery | 71/2587 | 333/18723 | 1.05e-04 | 2.24e-03 | 71 |
| GO:0072659110 | Esophagus | ESCC | protein localization to plasma membrane | 193/8552 | 284/18723 | 1.95e-14 | 1.03e-12 | 193 |
| GO:199077819 | Esophagus | ESCC | protein localization to cell periphery | 217/8552 | 333/18723 | 4.08e-13 | 1.88e-11 | 217 |
| GO:003432918 | Esophagus | ESCC | cell junction assembly | 227/8552 | 420/18723 | 3.06e-04 | 1.83e-03 | 227 |
| GO:190188810 | Esophagus | ESCC | regulation of cell junction assembly | 109/8552 | 204/18723 | 1.53e-02 | 4.96e-02 | 109 |
| GO:199077811 | Liver | Cirrhotic | protein localization to cell periphery | 135/4634 | 333/18723 | 1.18e-10 | 6.21e-09 | 135 |
| GO:007265911 | Liver | Cirrhotic | protein localization to plasma membrane | 119/4634 | 284/18723 | 1.30e-10 | 6.80e-09 | 119 |
| GO:007265921 | Liver | HCC | protein localization to plasma membrane | 177/7958 | 284/18723 | 1.02e-11 | 4.18e-10 | 177 |
| GO:199077821 | Liver | HCC | protein localization to cell periphery | 200/7958 | 333/18723 | 6.07e-11 | 2.23e-09 | 200 |
| GO:007265918 | Oral cavity | OSCC | protein localization to plasma membrane | 169/7305 | 284/18723 | 1.69e-12 | 7.21e-11 | 169 |
| GO:199077816 | Oral cavity | OSCC | protein localization to cell periphery | 190/7305 | 333/18723 | 1.46e-11 | 5.13e-10 | 190 |
| GO:003432916 | Oral cavity | OSCC | cell junction assembly | 190/7305 | 420/18723 | 4.99e-03 | 1.96e-02 | 190 |
| GO:007265916 | Prostate | BPH | protein localization to plasma membrane | 89/3107 | 284/18723 | 5.00e-10 | 2.56e-08 | 89 |
| GO:003432910 | Prostate | BPH | cell junction assembly | 114/3107 | 420/18723 | 2.52e-08 | 7.49e-07 | 114 |
| GO:199077810 | Prostate | BPH | protein localization to cell periphery | 95/3107 | 333/18723 | 2.78e-08 | 8.13e-07 | 95 |
| GO:19018888 | Prostate | BPH | regulation of cell junction assembly | 62/3107 | 204/18723 | 6.71e-07 | 1.30e-05 | 62 |
| GO:1901890 | Prostate | BPH | positive regulation of cell junction assembly | 28/3107 | 104/18723 | 5.18e-03 | 2.43e-02 | 28 |
| GO:007265917 | Prostate | Tumor | protein localization to plasma membrane | 90/3246 | 284/18723 | 2.07e-09 | 8.99e-08 | 90 |
| GO:199077815 | Prostate | Tumor | protein localization to cell periphery | 97/3246 | 333/18723 | 5.88e-08 | 1.75e-06 | 97 |
| Pathway ID | Tissue | Disease Stage | Description | Gene Ratio | Bg Ratio | pvalue | p.adjust | qvalue | Count |
| hsa0453039 | Esophagus | HGIN | Tight junction | 40/1383 | 169/8465 | 8.18e-03 | 4.71e-02 | 3.74e-02 | 40 |
| hsa04530115 | Esophagus | HGIN | Tight junction | 40/1383 | 169/8465 | 8.18e-03 | 4.71e-02 | 3.74e-02 | 40 |
| hsa0516510 | Esophagus | ESCC | Human papillomavirus infection | 215/4205 | 331/8465 | 7.86e-09 | 7.12e-08 | 3.65e-08 | 215 |
| hsa04530211 | Esophagus | ESCC | Tight junction | 105/4205 | 169/8465 | 6.73e-04 | 2.23e-03 | 1.14e-03 | 105 |
| hsa0516515 | Esophagus | ESCC | Human papillomavirus infection | 215/4205 | 331/8465 | 7.86e-09 | 7.12e-08 | 3.65e-08 | 215 |
| hsa04530310 | Esophagus | ESCC | Tight junction | 105/4205 | 169/8465 | 6.73e-04 | 2.23e-03 | 1.14e-03 | 105 |
| hsa0453022 | Liver | Cirrhotic | Tight junction | 82/2530 | 169/8465 | 2.14e-07 | 2.85e-06 | 1.76e-06 | 82 |
| hsa05165 | Liver | Cirrhotic | Human papillomavirus infection | 124/2530 | 331/8465 | 1.55e-03 | 7.83e-03 | 4.83e-03 | 124 |
| hsa0453032 | Liver | Cirrhotic | Tight junction | 82/2530 | 169/8465 | 2.14e-07 | 2.85e-06 | 1.76e-06 | 82 |
| hsa051651 | Liver | Cirrhotic | Human papillomavirus infection | 124/2530 | 331/8465 | 1.55e-03 | 7.83e-03 | 4.83e-03 | 124 |
| hsa0453042 | Liver | HCC | Tight junction | 110/4020 | 169/8465 | 2.45e-06 | 2.28e-05 | 1.27e-05 | 110 |
| hsa051652 | Liver | HCC | Human papillomavirus infection | 188/4020 | 331/8465 | 3.34e-04 | 1.49e-03 | 8.29e-04 | 188 |
| hsa0453052 | Liver | HCC | Tight junction | 110/4020 | 169/8465 | 2.45e-06 | 2.28e-05 | 1.27e-05 | 110 |
| hsa051653 | Liver | HCC | Human papillomavirus infection | 188/4020 | 331/8465 | 3.34e-04 | 1.49e-03 | 8.29e-04 | 188 |
| hsa051659 | Oral cavity | OSCC | Human papillomavirus infection | 200/3704 | 331/8465 | 3.83e-10 | 4.93e-09 | 2.51e-09 | 200 |
| hsa0453030 | Oral cavity | OSCC | Tight junction | 102/3704 | 169/8465 | 8.68e-06 | 3.93e-05 | 2.00e-05 | 102 |
| hsa0516514 | Oral cavity | OSCC | Human papillomavirus infection | 200/3704 | 331/8465 | 3.83e-10 | 4.93e-09 | 2.51e-09 | 200 |
| hsa04530114 | Oral cavity | OSCC | Tight junction | 102/3704 | 169/8465 | 8.68e-06 | 3.93e-05 | 2.00e-05 | 102 |
| hsa0453028 | Prostate | BPH | Tight junction | 68/1718 | 169/8465 | 1.70e-09 | 2.55e-08 | 1.58e-08 | 68 |
| hsa051658 | Prostate | BPH | Human papillomavirus infection | 111/1718 | 331/8465 | 6.15e-09 | 7.81e-08 | 4.83e-08 | 111 |
| Hugo Symbol | Variant Class | Variant Classification | dbSNP RS | HGVSc | HGVSp | HGVSp Short | SWISSPROT | BIOTYPE | SIFT | PolyPhen | Tumor Sample Barcode | Tissue | Histology | Sex | Age | Stage | Therapy Types | Drugs | Outcome |
| CRB3 | SNV | Missense_Mutation | | c.84N>G | p.Ile28Met | p.I28M | Q9BUF7 | protein_coding | tolerated_low_confidence(0.14) | benign(0) | TCGA-D5-6540-01 | Colorectum | colon adenocarcinoma | Male | >=65 | I/II | Unknown | Unknown | SD |
| CRB3 | SNV | Missense_Mutation | | c.220N>A | p.Val74Met | p.V74M | Q9BUF7 | protein_coding | tolerated(0.1) | benign(0.316) | TCGA-WS-AB45-01 | Colorectum | colon adenocarcinoma | Female | <65 | I/II | Unknown | Unknown | SD |
| CRB3 | SNV | Missense_Mutation | novel | c.131C>T | p.Thr44Ile | p.T44I | Q9BUF7 | protein_coding | deleterious(0.03) | benign(0.082) | TCGA-AJ-A3EK-01 | Endometrium | uterine corpus endometrioid carcinoma | Female | <65 | I/II | Chemotherapy | carboplatin | CR |
| CRB3 | SNV | Missense_Mutation | rs369374366 | c.266N>T | p.Thr89Met | p.T89M | Q9BUF7 | protein_coding | deleterious(0) | possibly_damaging(0.883) | TCGA-AX-A3FS-01 | Endometrium | uterine corpus endometrioid carcinoma | Female | >=65 | I/II | Unknown | Unknown | SD |
| CRB3 | SNV | Missense_Mutation | rs748268475 | c.316G>A | p.Glu106Lys | p.E106K | Q9BUF7 | protein_coding | deleterious_low_confidence(0.01) | probably_damaging(0.963) | TCGA-BK-A0C9-01 | Endometrium | uterine corpus endometrioid carcinoma | Female | <65 | I/II | Unknown | Unknown | SD |
| CRB3 | SNV | Missense_Mutation | novel | c.188N>C | p.Val63Ala | p.V63A | Q9BUF7 | protein_coding | deleterious(0.03) | probably_damaging(0.979) | TCGA-D1-A175-01 | Endometrium | uterine corpus endometrioid carcinoma | Female | <65 | I/II | Chemotherapy | paclitaxel | SD |
| CRB3 | SNV | Missense_Mutation | novel | c.58N>G | p.Arg20Gly | p.R20G | Q9BUF7 | protein_coding | tolerated_low_confidence(0.28) | benign(0.005) | TCGA-DD-AADC-01 | Liver | liver hepatocellular carcinoma | Male | <65 | I/II | Unknown | Unknown | PD |
| CRB3 | SNV | Missense_Mutation | rs754598571 | c.241C>T | p.Arg81Trp | p.R81W | Q9BUF7 | protein_coding | deleterious(0.04) | benign(0.007) | TCGA-63-A5MM-01 | Lung | lung squamous cell carcinoma | Female | >=65 | I/II | Chemotherapy | cisplatin | PD |
| CRB3 | SNV | Missense_Mutation | rs751295212 | c.292G>A | p.Glu98Lys | p.E98K | Q9BUF7 | protein_coding | deleterious(0) | probably_damaging(0.974) | TCGA-CN-4734-01 | Oral cavity | head & neck squamous cell carcinoma | Male | >=65 | I/II | Unknown | Unknown | SD |
| CRB3 | SNV | Missense_Mutation | novel | c.143N>G | p.Ser48Cys | p.S48C | Q9BUF7 | protein_coding | deleterious(0) | possibly_damaging(0.634) | TCGA-CR-7388-01 | Oral cavity | head & neck squamous cell carcinoma | Female | >=65 | I/II | Chemotherapy | carboplatin | PD |


