
|
|||||
|
 | |
| |
| |
| |
| |
| |
|
Gene: CRACR2B |
Gene summary for CRACR2B |
| Gene information | Species | Human | Gene symbol | CRACR2B | Gene ID | 283229 |
| Gene name | calcium release activated channel regulator 2B | |
| Gene Alias | EFCAB4A | |
| Cytomap | 11p15.5 | |
| Gene Type | protein-coding | GO ID | GO:0002115 | UniProtAcc | Q8N4Y2 |
Top |
Malignant transformation analysis |
| Identification of the aberrant gene expression in precancerous and cancerous lesions by comparing the gene expression of stem-like cells in diseased tissues with normal stem cells |
| Entrez ID | Symbol | Replicates | Species | Organ | Tissue | Adj P-value | Log2FC | Malignancy |
| 283229 | CRACR2B | GSM4909282 | Human | Breast | IDC | 2.02e-08 | -2.79e-01 | -0.0288 |
| 283229 | CRACR2B | GSM4909285 | Human | Breast | IDC | 4.00e-02 | -4.95e-02 | 0.21 |
| 283229 | CRACR2B | GSM4909286 | Human | Breast | IDC | 1.41e-02 | -1.29e-01 | 0.1081 |
| 283229 | CRACR2B | GSM4909293 | Human | Breast | IDC | 1.46e-14 | 4.00e-01 | 0.1581 |
| 283229 | CRACR2B | GSM4909296 | Human | Breast | IDC | 1.54e-04 | -1.61e-01 | 0.1524 |
| 283229 | CRACR2B | GSM4909297 | Human | Breast | IDC | 2.98e-04 | -2.03e-01 | 0.1517 |
| 283229 | CRACR2B | GSM4909302 | Human | Breast | IDC | 3.16e-08 | 4.06e-01 | 0.1545 |
| 283229 | CRACR2B | GSM4909305 | Human | Breast | IDC | 1.27e-03 | 2.32e-01 | 0.0436 |
| 283229 | CRACR2B | GSM4909311 | Human | Breast | IDC | 6.31e-15 | -2.59e-01 | 0.1534 |
| 283229 | CRACR2B | GSM4909312 | Human | Breast | IDC | 1.45e-05 | -1.69e-01 | 0.1552 |
| 283229 | CRACR2B | GSM4909315 | Human | Breast | IDC | 4.44e-13 | 6.03e-01 | 0.21 |
| 283229 | CRACR2B | GSM4909316 | Human | Breast | IDC | 5.17e-06 | 5.15e-01 | 0.21 |
| 283229 | CRACR2B | GSM4909317 | Human | Breast | IDC | 1.22e-10 | 4.04e-01 | 0.1355 |
| 283229 | CRACR2B | GSM4909318 | Human | Breast | IDC | 3.35e-04 | 5.13e-01 | 0.2031 |
| 283229 | CRACR2B | GSM4909319 | Human | Breast | IDC | 9.97e-36 | 3.53e-01 | 0.1563 |
| 283229 | CRACR2B | GSM4909321 | Human | Breast | IDC | 2.11e-27 | 6.49e-01 | 0.1559 |
| 283229 | CRACR2B | brca1 | Human | Breast | Precancer | 1.89e-06 | -3.31e-01 | -0.0338 |
| 283229 | CRACR2B | brca3 | Human | Breast | Precancer | 9.22e-03 | -1.99e-01 | -0.0263 |
| 283229 | CRACR2B | brca10 | Human | Breast | Precancer | 3.24e-02 | -2.96e-01 | -0.0029 |
| 283229 | CRACR2B | NCCBC14 | Human | Breast | DCIS | 2.31e-03 | -1.45e-01 | 0.2021 |
| Page: 1 2 3 4 |
| Tissue | Expression Dynamics | Abbreviation |
| Breast |  | IDC: Invasive ductal carcinoma |
| DCIS: Ductal carcinoma in situ | ||
| Precancer(BRCA1-mut): Precancerous lesion from BRCA1 mutation carriers | ||
| Colorectum (GSE201348) |  | FAP: Familial adenomatous polyposis |
| CRC: Colorectal cancer | ||
| Colorectum (HTA11) |  | AD: Adenomas |
| SER: Sessile serrated lesions | ||
| MSI-H: Microsatellite-high colorectal cancer | ||
| MSS: Microsatellite stable colorectal cancer | ||
| Esophagus |  | ESCC: Esophageal squamous cell carcinoma |
| HGIN: High-grade intraepithelial neoplasias | ||
| LGIN: Low-grade intraepithelial neoplasias | ||
| Oral Cavity | 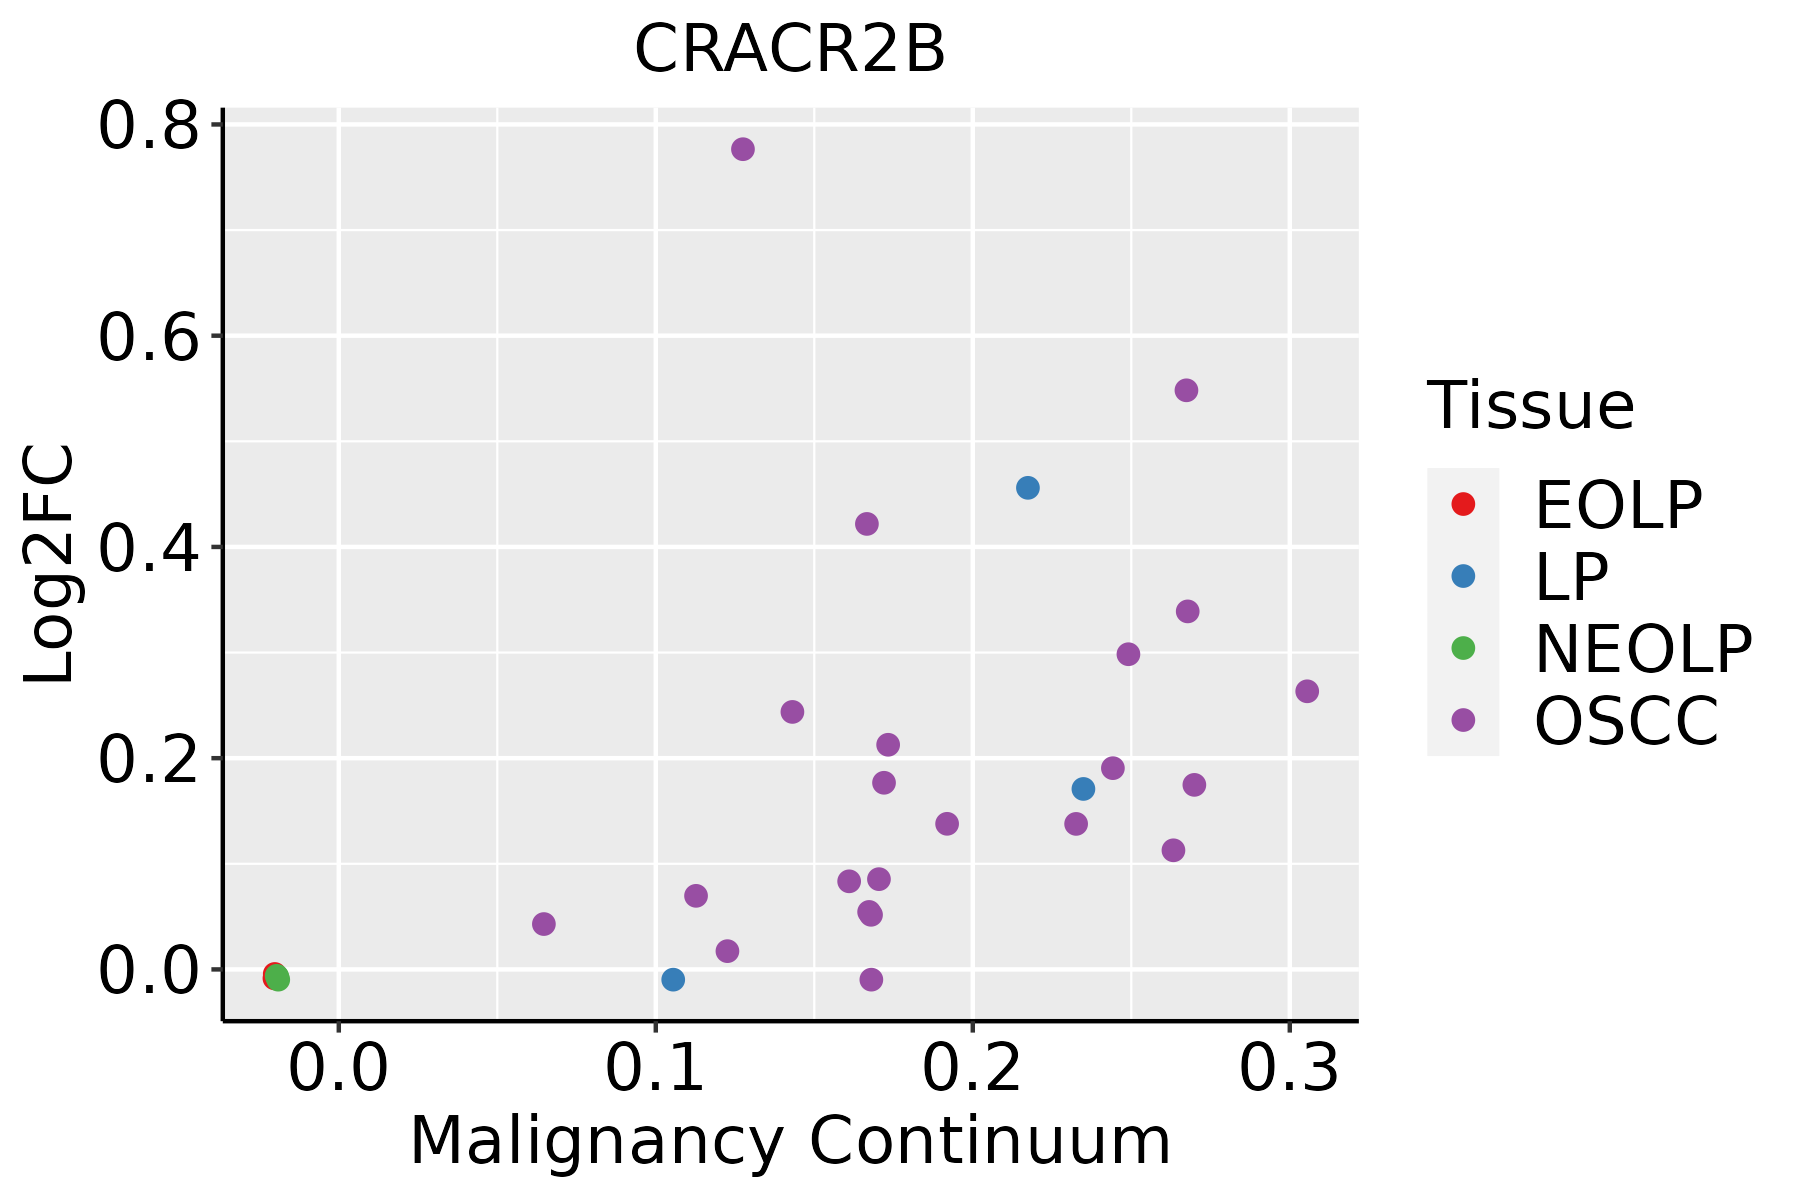 | EOLP: Erosive Oral lichen planus |
| LP: leukoplakia | ||
| NEOLP: Non-erosive oral lichen planus | ||
| OSCC: Oral squamous cell carcinoma | ||
| Prostate |  | BPH: Benign Prostatic Hyperplasia |
| ∗log2FC in expression of this searched gene in stem-like cells from each diseased tissue sample relative to stem-like cells in normal samples in each tissue plotted against the malignancy continuum. Samples are colored based on if they are from different disease stage. |
Top |
Malignant transformation related pathway analysis |
| Find out the enriched GO biological processes and KEGG pathways involved in transition from healthy to precancer to cancer |
| Tissue | Disease Stage | Enriched GO biological Processes |
| Colorectum | AD |  |
| Colorectum | SER |  |
| Colorectum | MSS |  |
| Colorectum | MSI-H |  |
| Colorectum | FAP |  |
| ∗Top 15 enriched GO BP terms are showed in the bar plot of each disease state in each tissue. Each row represents a significant GO biological process which is colored according to the -log10(p.adjust). |
| Page: 1 2 3 4 5 6 7 8 9 |
| GO ID | Tissue | Disease Stage | Description | Gene Ratio | Bg Ratio | pvalue | p.adjust | Count |
| GO:00109596 | Breast | Precancer | regulation of metal ion transport | 37/1080 | 406/18723 | 4.07e-03 | 3.22e-02 | 37 |
| GO:001095913 | Breast | IDC | regulation of metal ion transport | 52/1434 | 406/18723 | 1.76e-04 | 2.97e-03 | 52 |
| GO:0051924 | Breast | IDC | regulation of calcium ion transport | 32/1434 | 255/18723 | 3.94e-03 | 3.22e-02 | 32 |
| GO:001095921 | Breast | DCIS | regulation of metal ion transport | 50/1390 | 406/18723 | 2.86e-04 | 4.22e-03 | 50 |
| GO:0010959 | Colorectum | FAP | regulation of metal ion transport | 83/2622 | 406/18723 | 2.06e-04 | 2.96e-03 | 83 |
| Page: 1 |
| Pathway ID | Tissue | Disease Stage | Description | Gene Ratio | Bg Ratio | pvalue | p.adjust | qvalue | Count |
| Page: 1 |
Top |
Cell-cell communication analysis |
| Identification of potential cell-cell interactions between two cell types and their ligand-receptor pairs for different disease states |
| Ligand | Receptor | LRpair | Pathway | Tissue | Disease Stage |
| Page: 1 |
Top |
Single-cell gene regulatory network inference analysis |
| Find out the significant the regulons (TFs) and the target genes of each regulon across cell types for different disease states |
| TF | Cell Type | Tissue | Disease Stage | Target Gene | RSS | Regulon Activity |
| ∗The dot plots of a searched regulon are shown for all cell subpopulations in each disease state of each tissue based on the regulon specific score inferred using pySCENIC and by calculating the average expression. |
| Page: 1 |
Top |
Somatic mutation of malignant transformation related genes |
| Annotation of somatic variants for genes involved in malignant transformation |
| Hugo Symbol | Variant Class | Variant Classification | dbSNP RS | HGVSc | HGVSp | HGVSp Short | SWISSPROT | BIOTYPE | SIFT | PolyPhen | Tumor Sample Barcode | Tissue | Histology | Sex | Age | Stage | Therapy Types | Drugs | Outcome |
| CRACR2B | SNV | Missense_Mutation | c.328N>T | p.Pro110Ser | p.P110S | Q8N4Y2 | protein_coding | tolerated(0.42) | benign(0.003) | TCGA-D8-A1JA-01 | Breast | breast invasive carcinoma | Female | <65 | III/IV | Chemotherapy | adriamycin | PD | |
| CRACR2B | insertion | Frame_Shift_Ins | novel | c.539_540insA | p.Arg181ThrfsTer171 | p.R181Tfs*171 | Q8N4Y2 | protein_coding | TCGA-AO-A128-01 | Breast | breast invasive carcinoma | Female | <65 | I/II | Chemotherapy | doxorubicin | SD | ||
| CRACR2B | SNV | Missense_Mutation | c.229C>T | p.Arg77Trp | p.R77W | Q8N4Y2 | protein_coding | deleterious(0) | benign(0.406) | TCGA-EK-A2RB-01 | Cervix | cervical & endocervical cancer | Female | <65 | I/II | Unknown | Unknown | SD | |
| CRACR2B | SNV | Missense_Mutation | c.775C>T | p.Arg259Trp | p.R259W | Q8N4Y2 | protein_coding | deleterious(0) | probably_damaging(0.995) | TCGA-A6-2686-01 | Colorectum | colon adenocarcinoma | Female | >=65 | I/II | Unknown | Unknown | SD | |
| CRACR2B | SNV | Missense_Mutation | c.496C>T | p.Arg166Cys | p.R166C | Q8N4Y2 | protein_coding | deleterious(0) | possibly_damaging(0.855) | TCGA-A6-5661-01 | Colorectum | colon adenocarcinoma | Female | >=65 | I/II | Unknown | Unknown | SD | |
| CRACR2B | SNV | Missense_Mutation | c.101N>T | p.Ala34Val | p.A34V | Q8N4Y2 | protein_coding | deleterious(0) | possibly_damaging(0.789) | TCGA-AA-3510-01 | Colorectum | colon adenocarcinoma | Male | >=65 | I/II | Unknown | Unknown | SD | |
| CRACR2B | SNV | Missense_Mutation | c.184C>T | p.Pro62Ser | p.P62S | Q8N4Y2 | protein_coding | deleterious(0) | possibly_damaging(0.553) | TCGA-AA-3864-01 | Colorectum | colon adenocarcinoma | Male | >=65 | I/II | Unknown | Unknown | SD | |
| CRACR2B | SNV | Missense_Mutation | c.292G>A | p.Val98Met | p.V98M | Q8N4Y2 | protein_coding | deleterious(0.01) | benign(0.164) | TCGA-CK-4951-01 | Colorectum | colon adenocarcinoma | Female | >=65 | I/II | Unknown | Unknown | PD | |
| CRACR2B | SNV | Missense_Mutation | c.635N>A | p.Arg212His | p.R212H | Q8N4Y2 | protein_coding | deleterious(0) | probably_damaging(0.995) | TCGA-D5-6540-01 | Colorectum | colon adenocarcinoma | Male | >=65 | I/II | Unknown | Unknown | SD | |
| CRACR2B | deletion | Frame_Shift_Del | c.439delG | p.Val147TrpfsTer11 | p.V147Wfs*11 | Q8N4Y2 | protein_coding | TCGA-A6-2686-01 | Colorectum | colon adenocarcinoma | Female | >=65 | I/II | Unknown | Unknown | SD |
| Page: 1 2 3 |
Top |
Related drugs of malignant transformation related genes |
| Identification of chemicals and drugs interact with genes involved in malignant transfromation |
| (DGIdb 4.0) |
| Entrez ID | Symbol | Category | Interaction Types | Drug Claim Name | Drug Name | PMIDs |
| Page: 1 |

Copyright 2023-Present -The University of Texas Health Science Center at Houston |