
|
|||||
|
 | |
| |
| |
| |
| |
| |
|
Gene: CRABP1 |
Gene summary for CRABP1 |
| Gene information | Species | Human | Gene symbol | CRABP1 | Gene ID | 1381 |
| Gene name | cellular retinoic acid binding protein 1 | |
| Gene Alias | CRABP | |
| Cytomap | 15q25.1 | |
| Gene Type | protein-coding | GO ID | GO:0001523 | UniProtAcc | F1T0F7 |
Top |
Malignant transformation analysis |
| Identification of the aberrant gene expression in precancerous and cancerous lesions by comparing the gene expression of stem-like cells in diseased tissues with normal stem cells |
| Entrez ID | Symbol | Replicates | Species | Organ | Tissue | Adj P-value | Log2FC | Malignancy |
| 1381 | CRABP1 | GSM4909281 | Human | Breast | IDC | 2.30e-29 | 7.17e-01 | 0.21 |
| 1381 | CRABP1 | GSM4909285 | Human | Breast | IDC | 1.04e-16 | 5.10e-01 | 0.21 |
| 1381 | CRABP1 | GSM4909286 | Human | Breast | IDC | 7.27e-12 | -2.72e-01 | 0.1081 |
| 1381 | CRABP1 | GSM4909290 | Human | Breast | IDC | 6.35e-08 | -2.72e-01 | 0.2096 |
| 1381 | CRABP1 | GSM4909291 | Human | Breast | IDC | 3.98e-21 | 7.83e-01 | 0.1753 |
| 1381 | CRABP1 | GSM4909293 | Human | Breast | IDC | 3.52e-07 | -2.46e-01 | 0.1581 |
| 1381 | CRABP1 | GSM4909294 | Human | Breast | IDC | 8.19e-11 | -2.68e-01 | 0.2022 |
| 1381 | CRABP1 | GSM4909296 | Human | Breast | IDC | 9.21e-07 | -2.58e-01 | 0.1524 |
| 1381 | CRABP1 | GSM4909297 | Human | Breast | IDC | 9.37e-07 | -2.54e-01 | 0.1517 |
| 1381 | CRABP1 | GSM4909298 | Human | Breast | IDC | 3.45e-15 | 5.37e-01 | 0.1551 |
| 1381 | CRABP1 | GSM4909301 | Human | Breast | IDC | 1.49e-12 | -2.72e-01 | 0.1577 |
| 1381 | CRABP1 | GSM4909302 | Human | Breast | IDC | 1.83e-11 | -2.72e-01 | 0.1545 |
| 1381 | CRABP1 | GSM4909304 | Human | Breast | IDC | 1.47e-09 | -2.63e-01 | 0.1636 |
| 1381 | CRABP1 | GSM4909308 | Human | Breast | IDC | 6.96e-08 | -2.68e-01 | 0.158 |
| 1381 | CRABP1 | GSM4909311 | Human | Breast | IDC | 1.01e-07 | -3.11e-02 | 0.1534 |
| 1381 | CRABP1 | GSM4909312 | Human | Breast | IDC | 2.43e-02 | -2.01e-01 | 0.1552 |
| 1381 | CRABP1 | GSM4909315 | Human | Breast | IDC | 8.54e-09 | 5.15e-01 | 0.21 |
| 1381 | CRABP1 | GSM4909316 | Human | Breast | IDC | 1.26e-02 | 4.45e-01 | 0.21 |
| 1381 | CRABP1 | GSM4909319 | Human | Breast | IDC | 6.74e-13 | -2.72e-01 | 0.1563 |
| 1381 | CRABP1 | GSM4909320 | Human | Breast | IDC | 8.65e-03 | -2.72e-01 | 0.1575 |
| Page: 1 2 3 |
| Tissue | Expression Dynamics | Abbreviation |
| Breast | 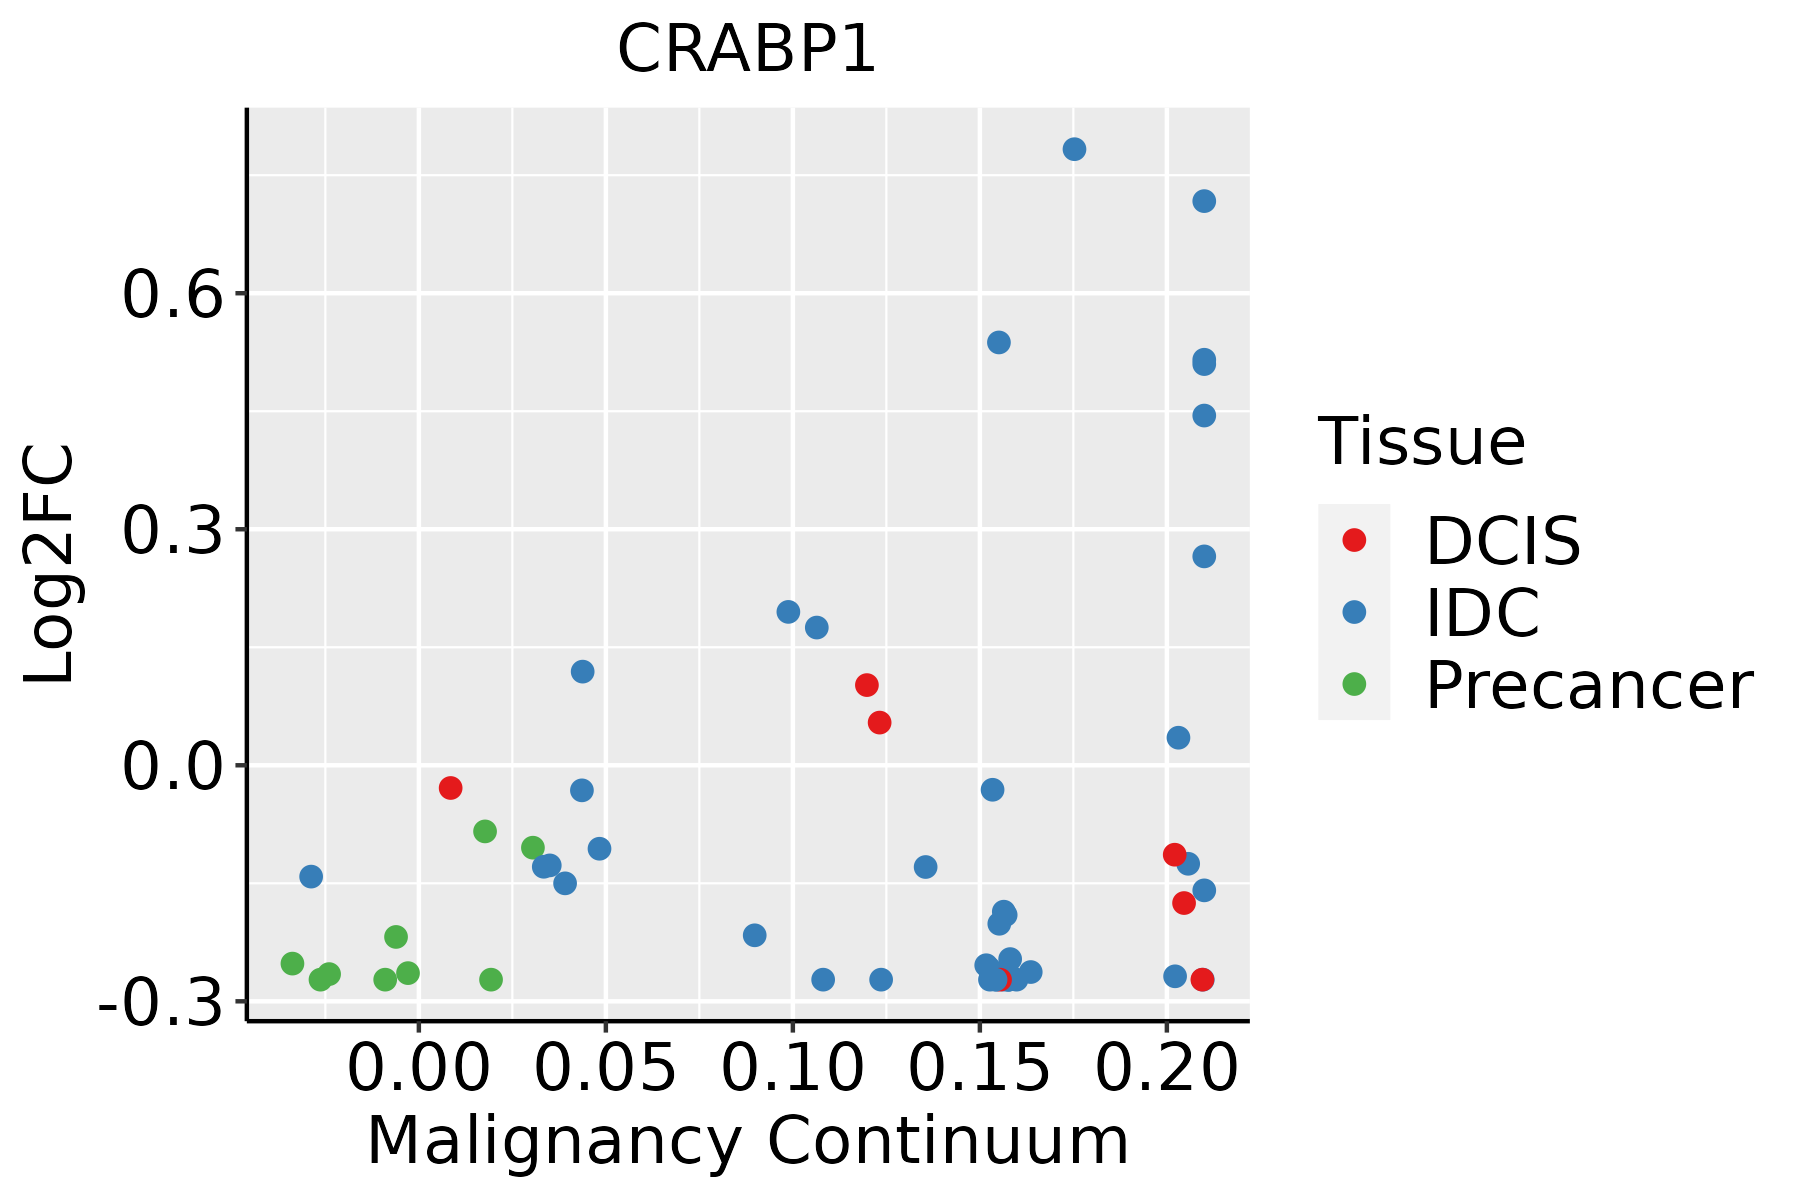 | IDC: Invasive ductal carcinoma |
| DCIS: Ductal carcinoma in situ | ||
| Precancer(BRCA1-mut): Precancerous lesion from BRCA1 mutation carriers | ||
| Esophagus | 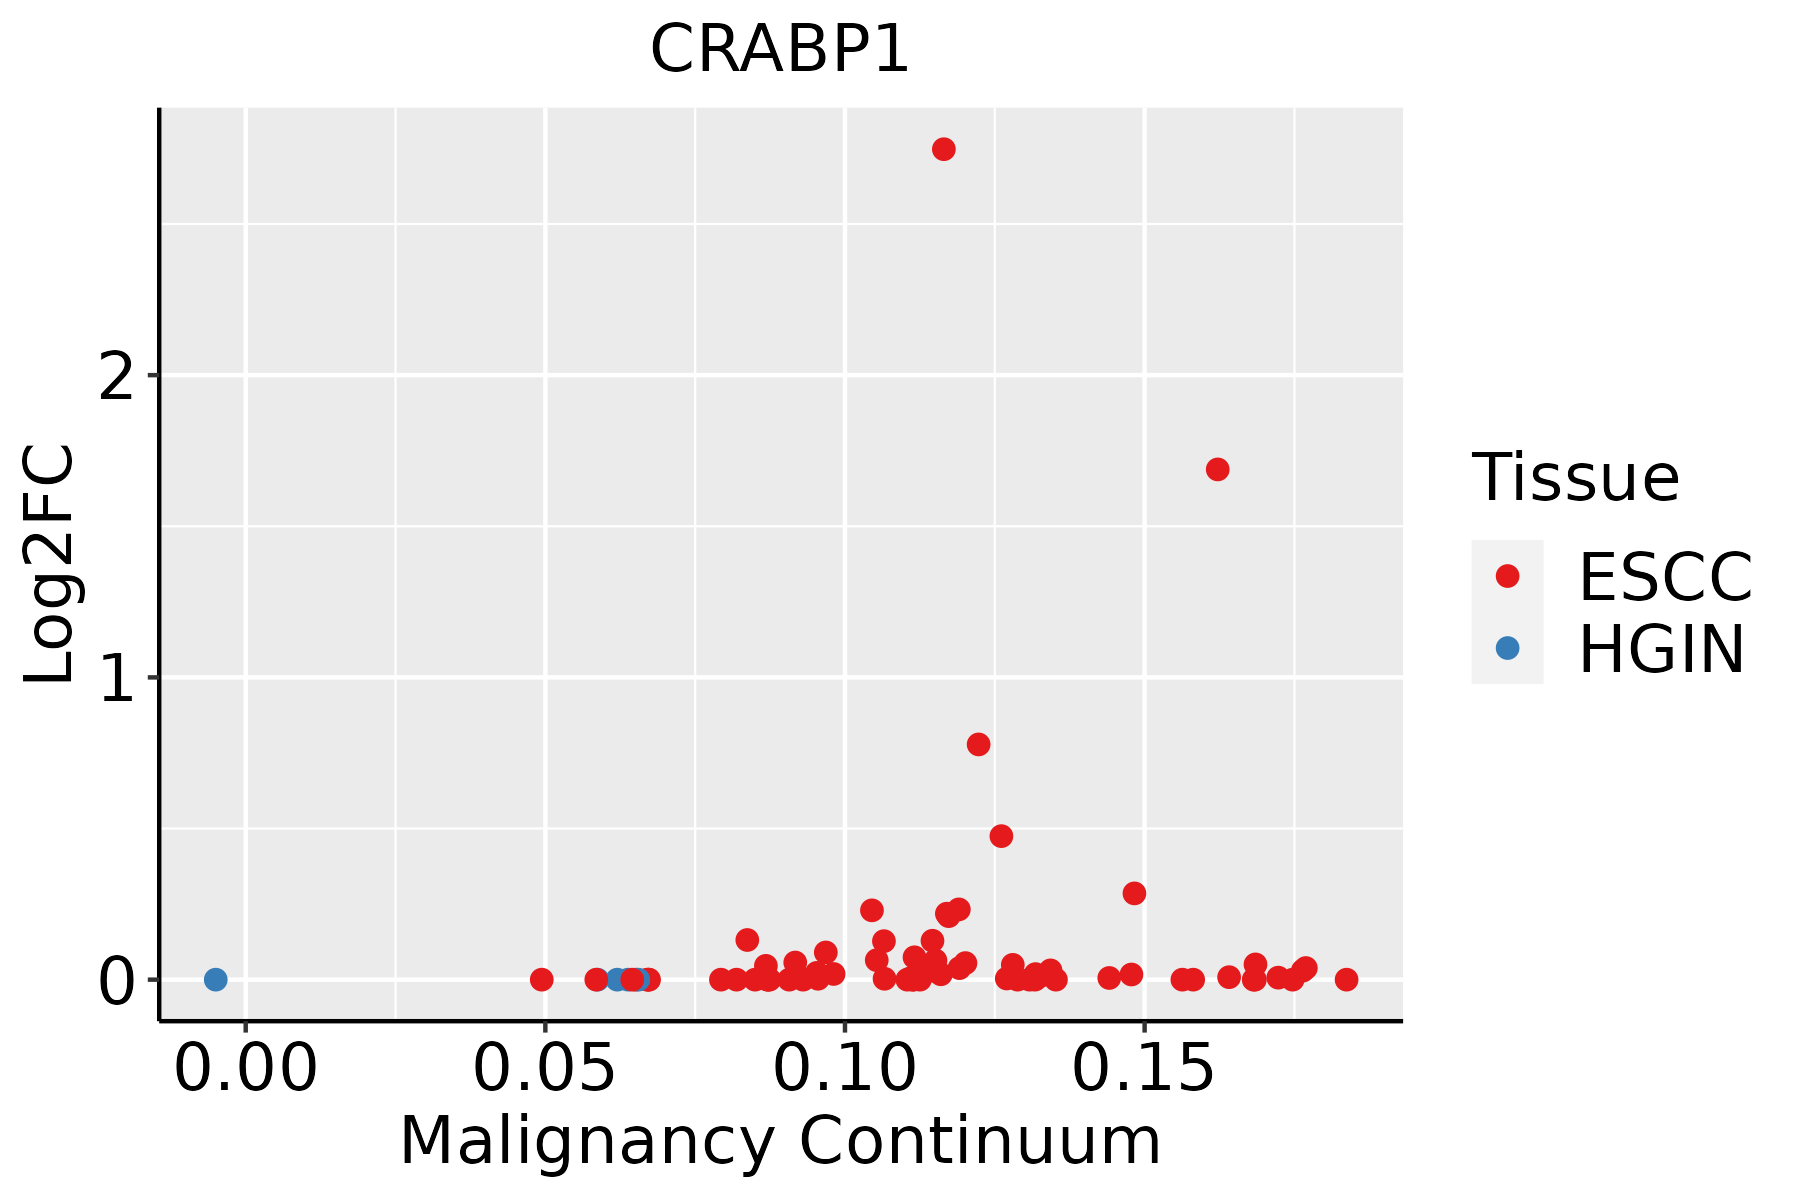 | ESCC: Esophageal squamous cell carcinoma |
| HGIN: High-grade intraepithelial neoplasias | ||
| LGIN: Low-grade intraepithelial neoplasias | ||
| Thyroid | 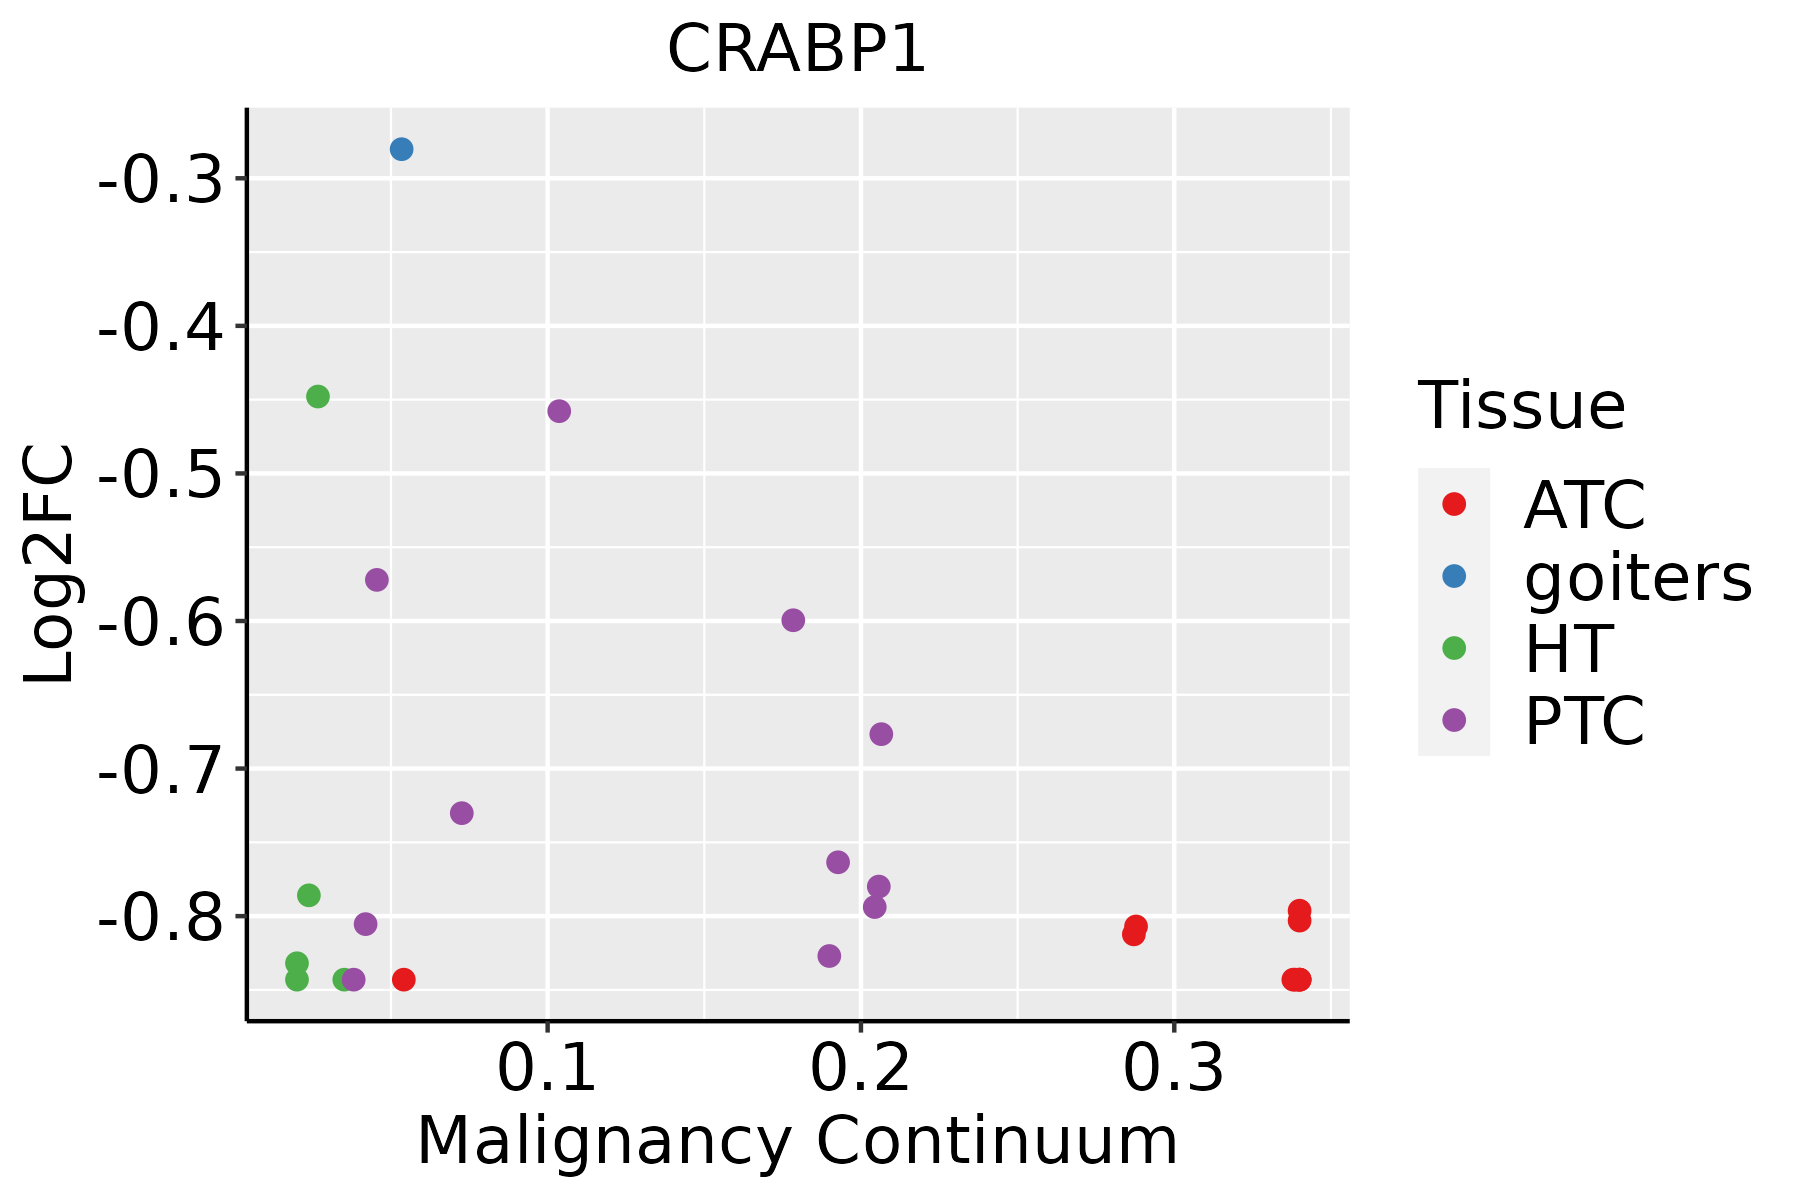 | ATC: Anaplastic thyroid cancer |
| HT: Hashimoto's thyroiditis | ||
| PTC: Papillary thyroid cancer |
| ∗log2FC in expression of this searched gene in stem-like cells from each diseased tissue sample relative to stem-like cells in normal samples in each tissue plotted against the malignancy continuum. Samples are colored based on if they are from different disease stage. |
Top |
Malignant transformation related pathway analysis |
| Find out the enriched GO biological processes and KEGG pathways involved in transition from healthy to precancer to cancer |
| Tissue | Disease Stage | Enriched GO biological Processes |
| Colorectum | AD |  |
| Colorectum | SER |  |
| Colorectum | MSS |  |
| Colorectum | MSI-H |  |
| Colorectum | FAP |  |
| ∗Top 15 enriched GO BP terms are showed in the bar plot of each disease state in each tissue. Each row represents a significant GO biological process which is colored according to the -log10(p.adjust). |
| Page: 1 2 3 4 5 6 7 8 9 |
| GO ID | Tissue | Disease Stage | Description | Gene Ratio | Bg Ratio | pvalue | p.adjust | Count |
| GO:00067661 | Esophagus | ESCC | vitamin metabolic process | 67/8552 | 106/18723 | 2.03e-04 | 1.28e-03 | 67 |
| GO:00723297 | Esophagus | ESCC | monocarboxylic acid catabolic process | 74/8552 | 122/18723 | 6.03e-04 | 3.27e-03 | 74 |
| GO:00442427 | Esophagus | ESCC | cellular lipid catabolic process | 121/8552 | 214/18723 | 8.63e-04 | 4.43e-03 | 121 |
| GO:00442827 | Esophagus | ESCC | small molecule catabolic process | 201/8552 | 376/18723 | 1.35e-03 | 6.41e-03 | 201 |
| GO:00160427 | Esophagus | ESCC | lipid catabolic process | 168/8552 | 320/18723 | 7.97e-03 | 2.84e-02 | 168 |
| Page: 1 |
| Pathway ID | Tissue | Disease Stage | Description | Gene Ratio | Bg Ratio | pvalue | p.adjust | qvalue | Count |
| Page: 1 |
Top |
Cell-cell communication analysis |
| Identification of potential cell-cell interactions between two cell types and their ligand-receptor pairs for different disease states |
| Ligand | Receptor | LRpair | Pathway | Tissue | Disease Stage |
| Page: 1 |
Top |
Single-cell gene regulatory network inference analysis |
| Find out the significant the regulons (TFs) and the target genes of each regulon across cell types for different disease states |
| TF | Cell Type | Tissue | Disease Stage | Target Gene | RSS | Regulon Activity |
| ∗The dot plots of a searched regulon are shown for all cell subpopulations in each disease state of each tissue based on the regulon specific score inferred using pySCENIC and by calculating the average expression. |
| Page: 1 |
Top |
Somatic mutation of malignant transformation related genes |
| Annotation of somatic variants for genes involved in malignant transformation |
| Hugo Symbol | Variant Class | Variant Classification | dbSNP RS | HGVSc | HGVSp | HGVSp Short | SWISSPROT | BIOTYPE | SIFT | PolyPhen | Tumor Sample Barcode | Tissue | Histology | Sex | Age | Stage | Therapy Types | Drugs | Outcome |
| CRABP1 | SNV | Missense_Mutation | c.248N>C | p.Arg83Thr | p.R83T | P29762 | protein_coding | tolerated(0.28) | benign(0.003) | TCGA-AR-A0TY-01 | Breast | breast invasive carcinoma | Female | <65 | I/II | Unspecific | Paclitaxel | PD | |
| CRABP1 | SNV | Missense_Mutation | novel | c.169N>G | p.Thr57Ala | p.T57A | P29762 | protein_coding | deleterious(0.01) | probably_damaging(0.997) | TCGA-2W-A8YY-01 | Cervix | cervical & endocervical cancer | Female | <65 | I/II | Chemotherapy | cisplatin | CR |
| CRABP1 | SNV | Missense_Mutation | rs771972939 | c.349G>A | p.Asp117Asn | p.D117N | P29762 | protein_coding | deleterious(0.02) | benign(0.149) | TCGA-AA-3510-01 | Colorectum | colon adenocarcinoma | Male | >=65 | I/II | Unknown | Unknown | SD |
| CRABP1 | SNV | Missense_Mutation | novel | c.194N>G | p.Asn65Ser | p.N65S | P29762 | protein_coding | tolerated(0.35) | benign(0.009) | TCGA-AZ-4315-01 | Colorectum | colon adenocarcinoma | Male | <65 | I/II | Unknown | Unknown | SD |
| CRABP1 | SNV | Missense_Mutation | novel | c.145G>A | p.Asp49Asn | p.D49N | P29762 | protein_coding | tolerated(0.08) | possibly_damaging(0.625) | TCGA-EI-6917-01 | Colorectum | rectum adenocarcinoma | Male | <65 | III/IV | Chemotherapy | 5fluorouracil+oxaciplatina+l-folinian | SD |
| CRABP1 | SNV | Missense_Mutation | c.179G>A | p.Arg60His | p.R60H | P29762 | protein_coding | tolerated(0.08) | probably_damaging(0.961) | TCGA-AP-A0LM-01 | Endometrium | uterine corpus endometrioid carcinoma | Female | <65 | III/IV | Chemotherapy | cisplatin | SD | |
| CRABP1 | SNV | Missense_Mutation | c.241A>G | p.Lys81Glu | p.K81E | P29762 | protein_coding | tolerated(0.3) | benign(0.129) | TCGA-BS-A0UF-01 | Endometrium | uterine corpus endometrioid carcinoma | Female | >=65 | I/II | Unknown | Unknown | SD | |
| CRABP1 | SNV | Missense_Mutation | c.376N>A | p.Asp126Asn | p.D126N | P29762 | protein_coding | deleterious(0.05) | probably_damaging(0.943) | TCGA-EO-A22U-01 | Endometrium | uterine corpus endometrioid carcinoma | Female | >=65 | I/II | Unknown | Unknown | SD | |
| CRABP1 | SNV | Missense_Mutation | c.314G>T | p.Gly105Val | p.G105V | P29762 | protein_coding | deleterious(0) | probably_damaging(1) | TCGA-05-4250-01 | Lung | lung adenocarcinoma | Female | >=65 | III/IV | Unknown | Unknown | SD | |
| CRABP1 | SNV | Missense_Mutation | rs778328549 | c.290C>T | p.Thr97Met | p.T97M | P29762 | protein_coding | tolerated(0.08) | benign(0.325) | TCGA-55-8506-01 | Lung | lung adenocarcinoma | Female | <65 | I/II | Unknown | Unknown | SD |
| Page: 1 2 |
Top |
Related drugs of malignant transformation related genes |
| Identification of chemicals and drugs interact with genes involved in malignant transfromation |
| (DGIdb 4.0) |
| Entrez ID | Symbol | Category | Interaction Types | Drug Claim Name | Drug Name | PMIDs |
| Page: 1 |

Copyright 2023-Present -The University of Texas Health Science Center at Houston |