
|
|||||
|
 | |
| |
| |
| |
| |
| |
|
Gene: CPXM1 |
Gene summary for CPXM1 |
| Gene information | Species | Human | Gene symbol | CPXM1 | Gene ID | 56265 |
| Gene name | carboxypeptidase X, M14 family member 1 | |
| Gene Alias | CPX1 | |
| Cytomap | 20p13 | |
| Gene Type | protein-coding | GO ID | GO:0006508 | UniProtAcc | Q96SM3 |
Top |
Malignant transformation analysis |
| Identification of the aberrant gene expression in precancerous and cancerous lesions by comparing the gene expression of stem-like cells in diseased tissues with normal stem cells |
| Entrez ID | Symbol | Replicates | Species | Organ | Tissue | Adj P-value | Log2FC | Malignancy |
| 56265 | CPXM1 | AEH-subject1 | Human | Endometrium | AEH | 7.18e-27 | -5.98e-01 | -0.3059 |
| 56265 | CPXM1 | AEH-subject2 | Human | Endometrium | AEH | 3.88e-43 | -6.46e-01 | -0.2525 |
| 56265 | CPXM1 | AEH-subject3 | Human | Endometrium | AEH | 3.36e-25 | -5.95e-01 | -0.2576 |
| 56265 | CPXM1 | AEH-subject4 | Human | Endometrium | AEH | 3.71e-14 | -5.31e-01 | -0.2657 |
| 56265 | CPXM1 | AEH-subject5 | Human | Endometrium | AEH | 5.13e-39 | -6.75e-01 | -0.2953 |
| 56265 | CPXM1 | EEC-subject1 | Human | Endometrium | EEC | 5.58e-35 | -6.69e-01 | -0.2682 |
| 56265 | CPXM1 | EEC-subject2 | Human | Endometrium | EEC | 3.33e-41 | -6.74e-01 | -0.2607 |
| 56265 | CPXM1 | EEC-subject3 | Human | Endometrium | EEC | 5.57e-41 | -6.63e-01 | -0.2525 |
| 56265 | CPXM1 | EEC-subject4 | Human | Endometrium | EEC | 2.22e-30 | -6.25e-01 | -0.2571 |
| 56265 | CPXM1 | EEC-subject5 | Human | Endometrium | EEC | 1.87e-39 | -6.74e-01 | -0.249 |
| 56265 | CPXM1 | GSM5276935 | Human | Endometrium | EEC | 9.25e-41 | -6.76e-01 | -0.123 |
| 56265 | CPXM1 | GSM6177620_NYU_UCEC1_lib1_lib1 | Human | Endometrium | EEC | 1.15e-33 | -6.82e-01 | -0.1869 |
| 56265 | CPXM1 | GSM6177620_NYU_UCEC1_lib2_lib2 | Human | Endometrium | EEC | 3.70e-30 | -6.82e-01 | -0.1875 |
| 56265 | CPXM1 | GSM6177620_NYU_UCEC1_lib3_lib3 | Human | Endometrium | EEC | 1.11e-31 | -6.70e-01 | -0.1883 |
| 56265 | CPXM1 | GSM6177621_NYU_UCEC2_lib1_lib1 | Human | Endometrium | EEC | 3.75e-43 | -6.82e-01 | -0.1934 |
| 56265 | CPXM1 | GSM6177622_NYU_UCEC3_lib1_lib1 | Human | Endometrium | EEC | 4.92e-44 | -6.82e-01 | -0.1917 |
| 56265 | CPXM1 | GSM6177622_NYU_UCEC3_lib2_lib2 | Human | Endometrium | EEC | 2.11e-44 | -6.82e-01 | -0.1916 |
| 56265 | CPXM1 | GSM6177623_NYU_UCEC3_Vis | Human | Endometrium | EEC | 6.15e-12 | -4.93e-01 | -0.1269 |
| 56265 | CPXM1 | P2T-E | Human | Esophagus | ESCC | 4.91e-22 | 5.78e-01 | 0.1177 |
| 56265 | CPXM1 | P4T-E | Human | Esophagus | ESCC | 3.53e-08 | 2.20e-01 | 0.1323 |
| Page: 1 2 |
| Tissue | Expression Dynamics | Abbreviation |
| Endometrium | 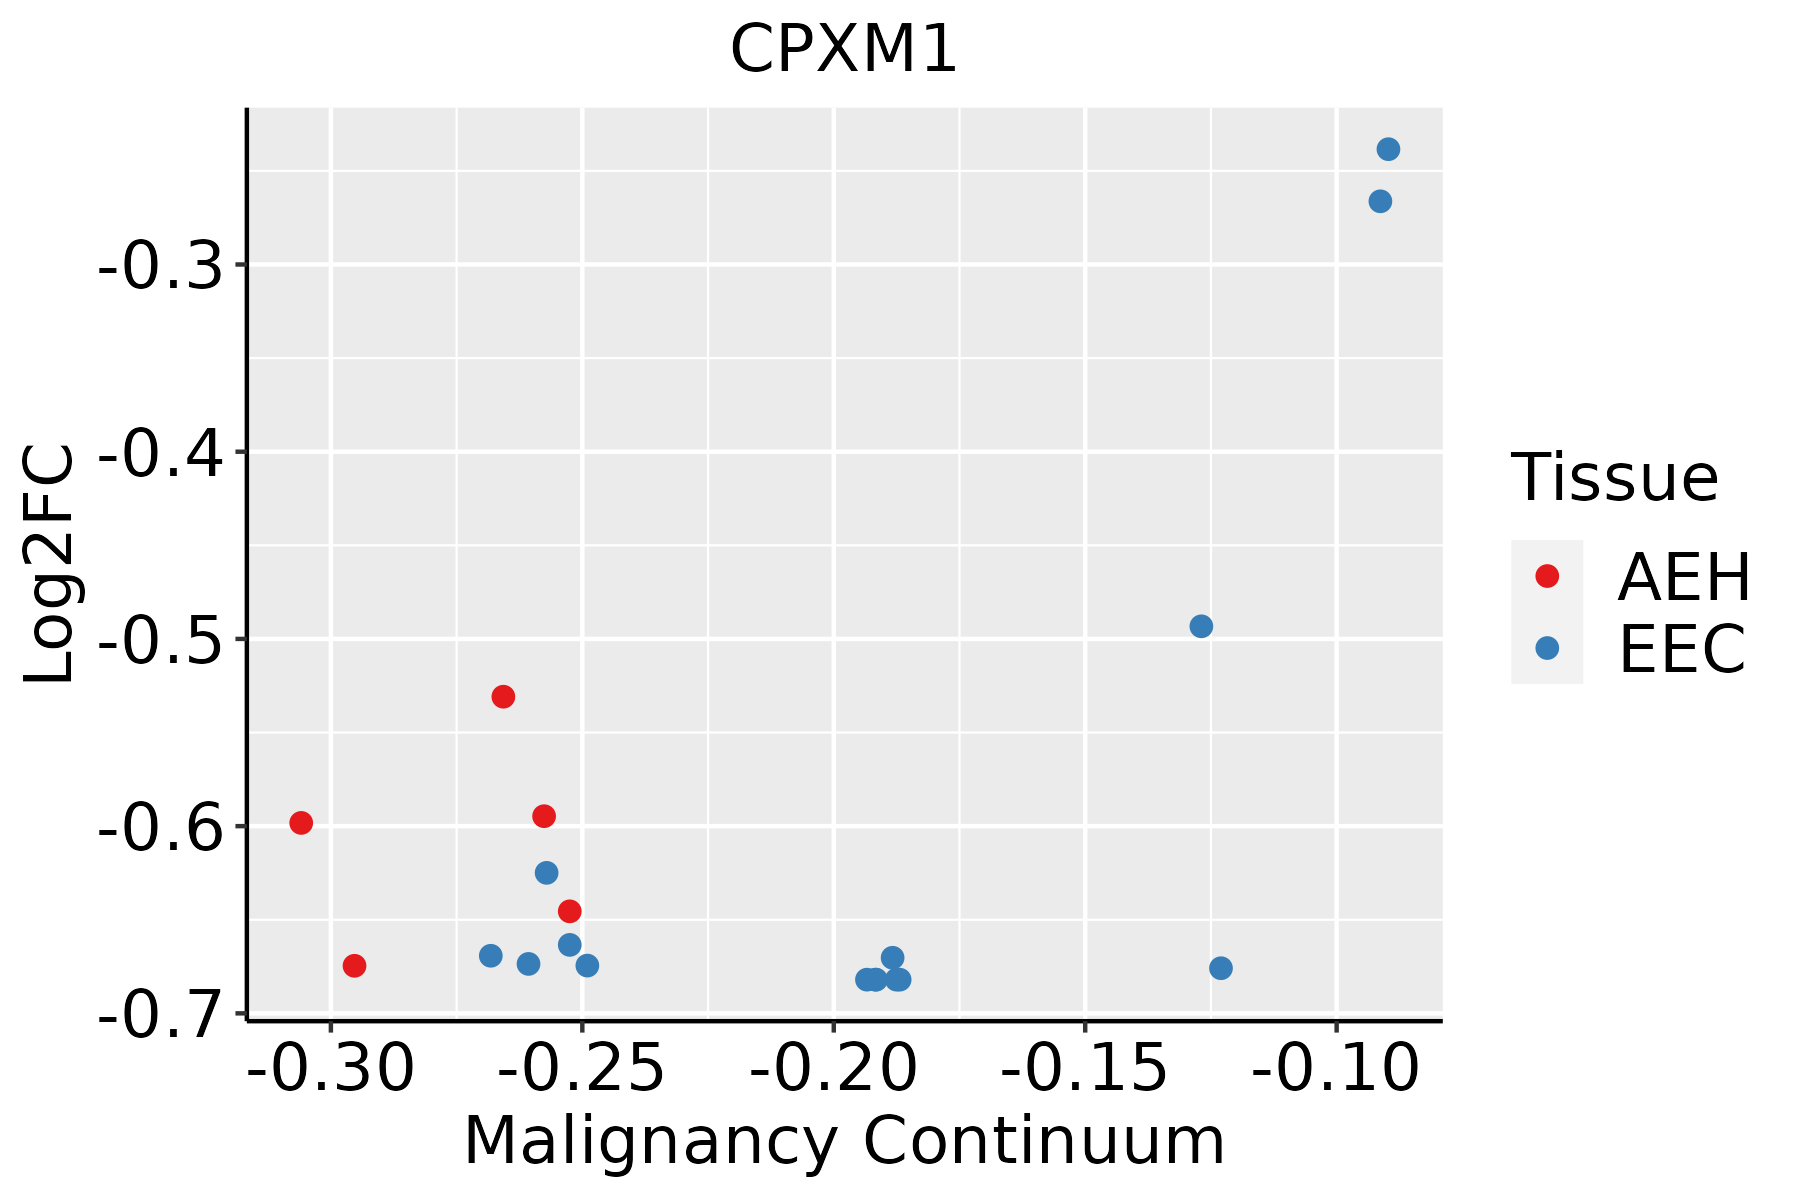 | AEH: Atypical endometrial hyperplasia |
| EEC: Endometrioid Cancer | ||
| Esophagus | 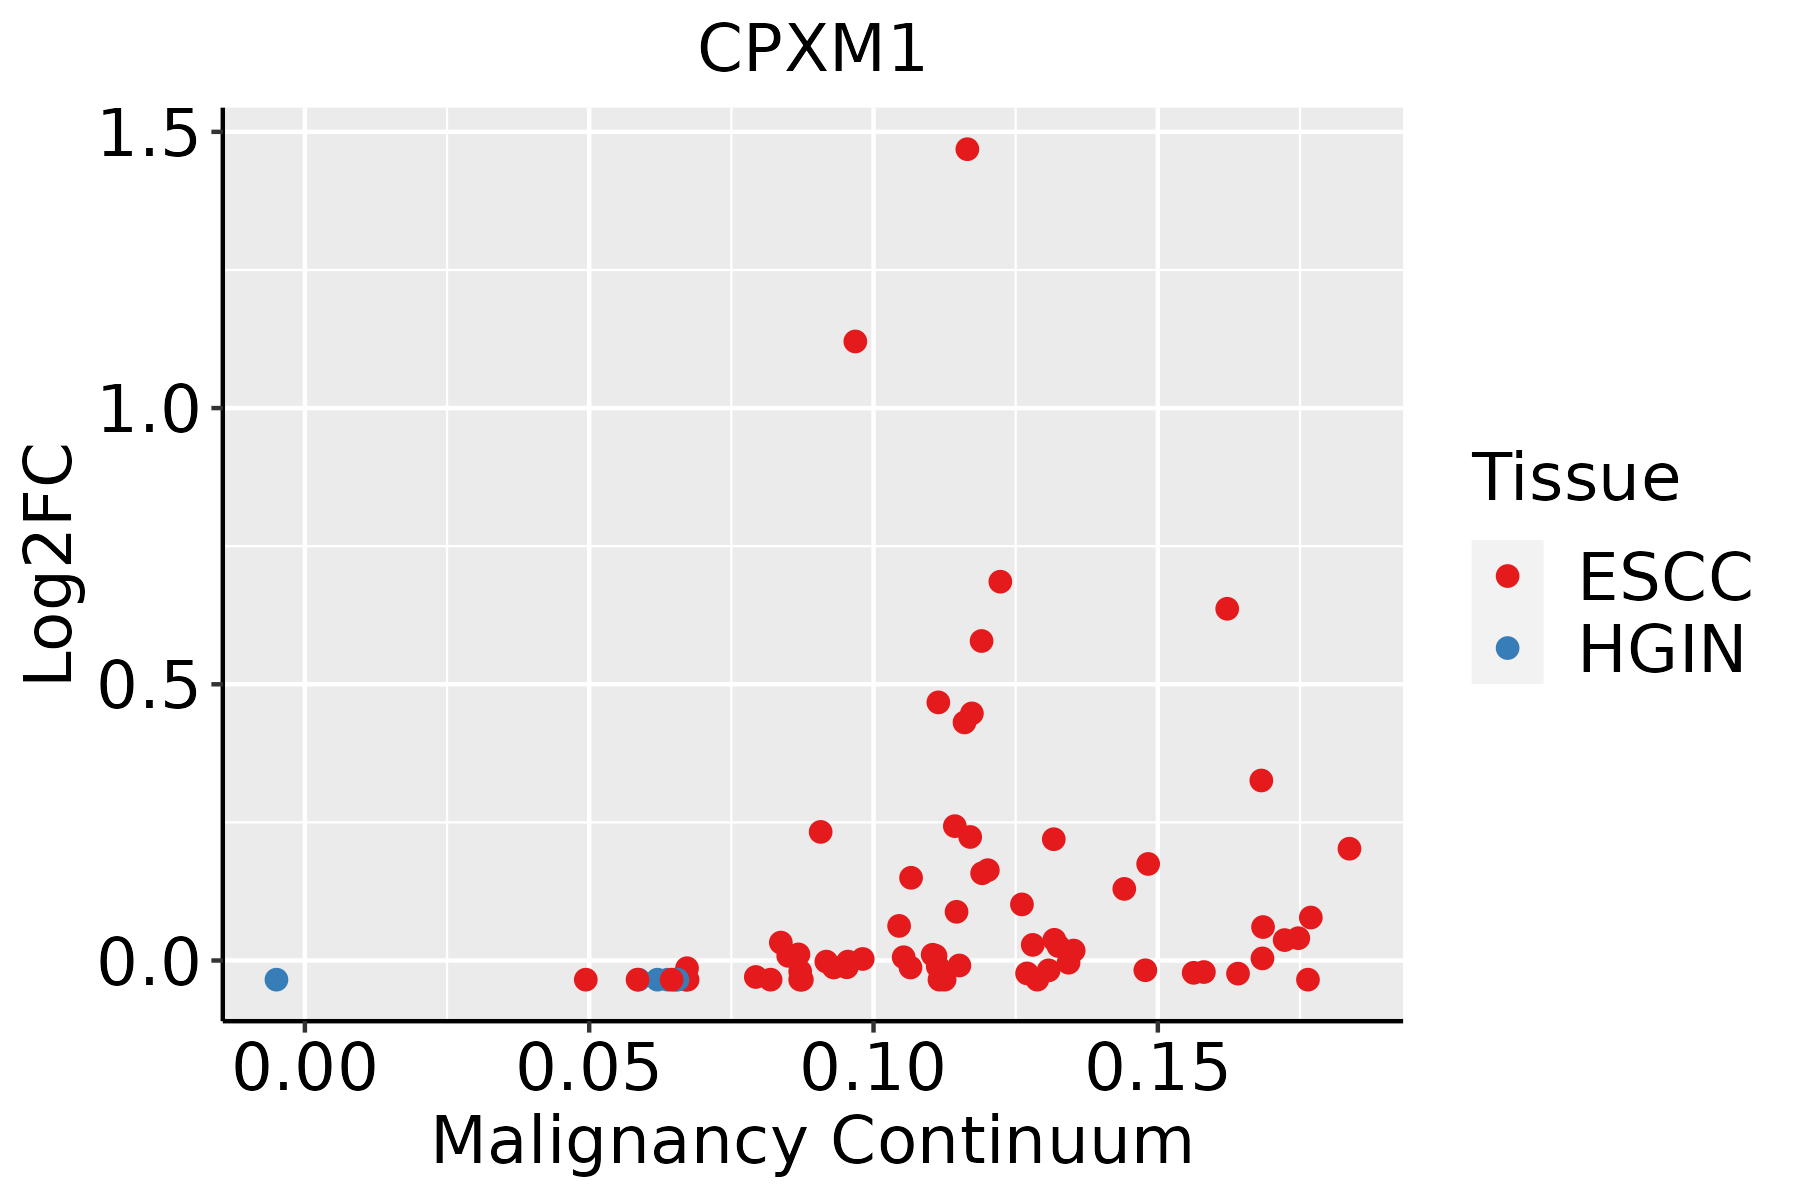 | ESCC: Esophageal squamous cell carcinoma |
| HGIN: High-grade intraepithelial neoplasias | ||
| LGIN: Low-grade intraepithelial neoplasias | ||
| Liver | 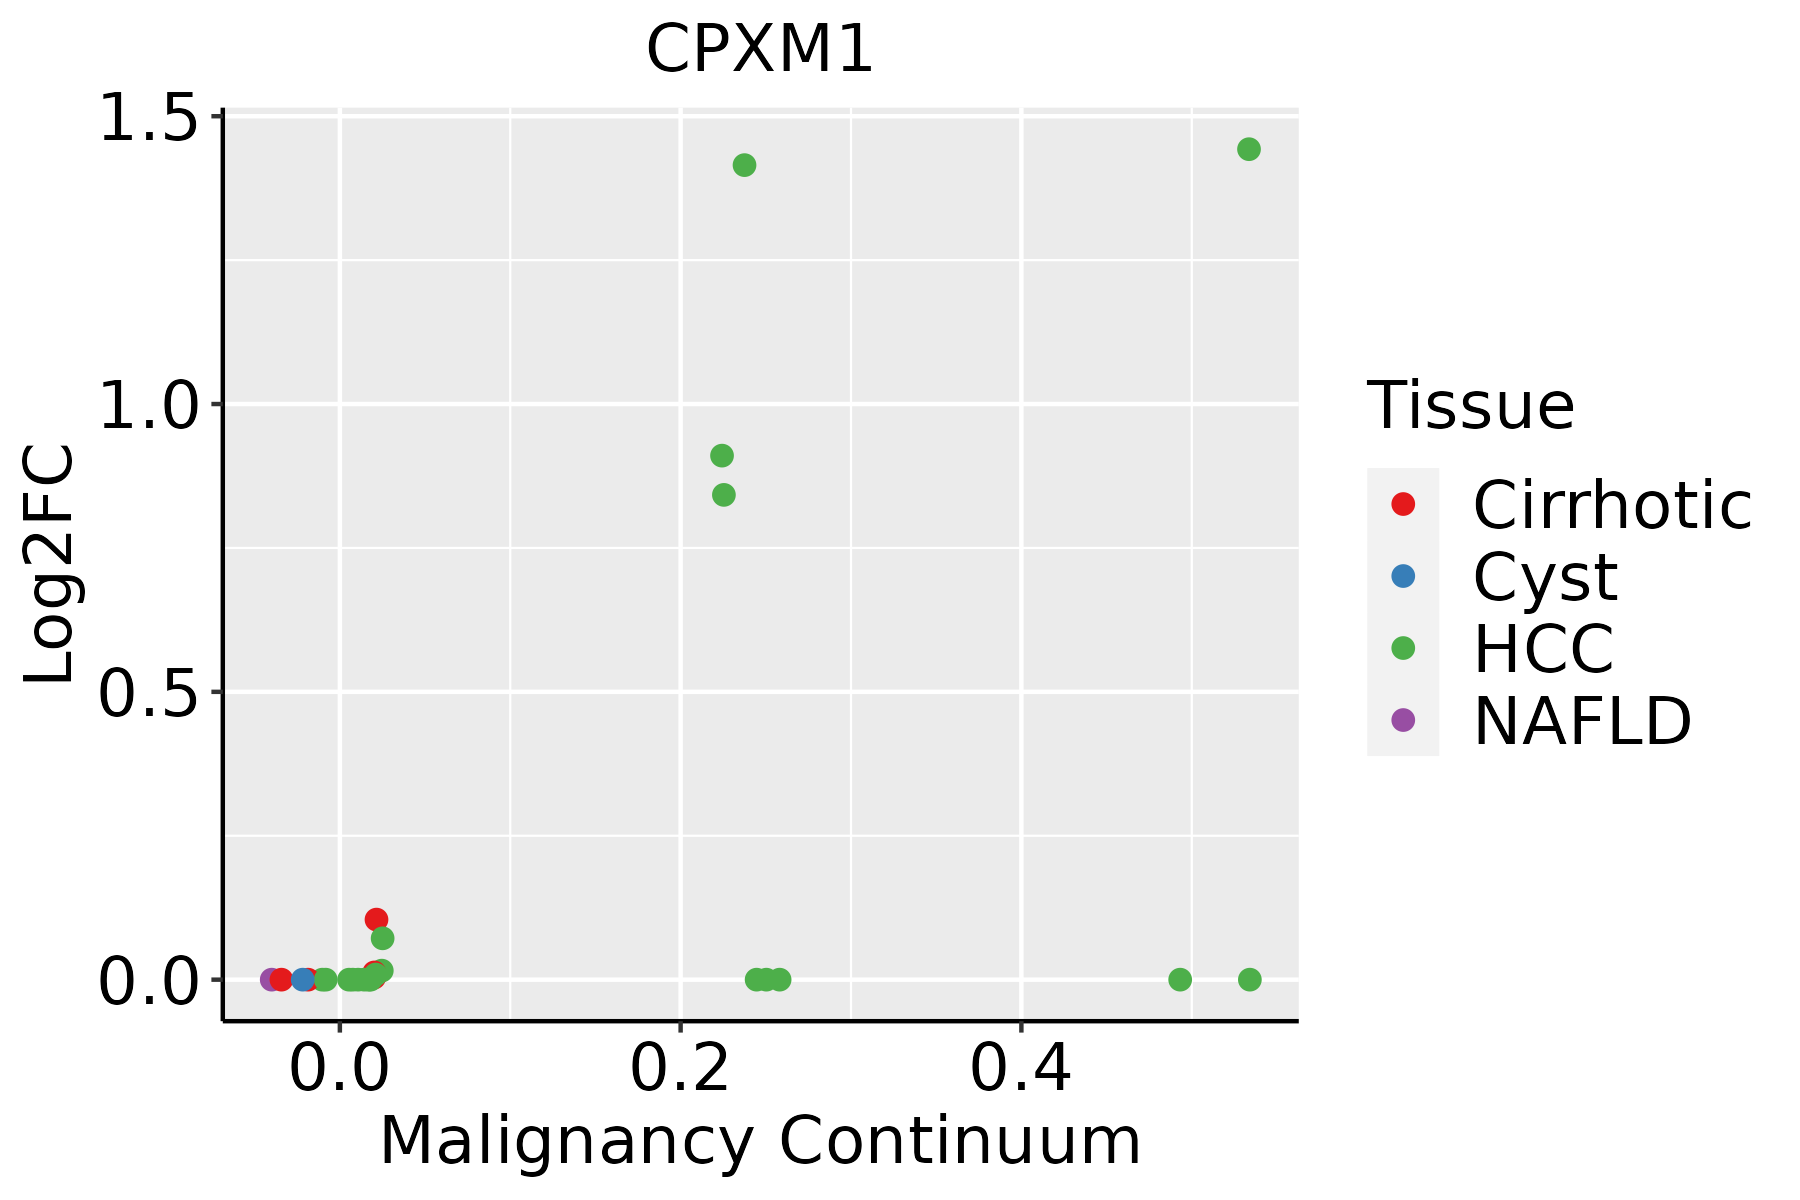 | HCC: Hepatocellular carcinoma |
| NAFLD: Non-alcoholic fatty liver disease |
| ∗log2FC in expression of this searched gene in stem-like cells from each diseased tissue sample relative to stem-like cells in normal samples in each tissue plotted against the malignancy continuum. Samples are colored based on if they are from different disease stage. |
Top |
Malignant transformation related pathway analysis |
| Find out the enriched GO biological processes and KEGG pathways involved in transition from healthy to precancer to cancer |
| Tissue | Disease Stage | Enriched GO biological Processes |
| Colorectum | AD |  |
| Colorectum | SER |  |
| Colorectum | MSS |  |
| Colorectum | MSI-H |  |
| Colorectum | FAP |  |
| ∗Top 15 enriched GO BP terms are showed in the bar plot of each disease state in each tissue. Each row represents a significant GO biological process which is colored according to the -log10(p.adjust). |
| Page: 1 2 3 4 5 6 7 8 9 |
| GO ID | Tissue | Disease Stage | Description | Gene Ratio | Bg Ratio | pvalue | p.adjust | Count |
| GO:005160418 | Esophagus | ESCC | protein maturation | 189/8552 | 294/18723 | 7.64e-11 | 2.39e-09 | 189 |
| GO:001648514 | Esophagus | ESCC | protein processing | 134/8552 | 225/18723 | 1.81e-05 | 1.60e-04 | 134 |
| GO:00516046 | Liver | Cirrhotic | protein maturation | 121/4634 | 294/18723 | 3.54e-10 | 1.68e-08 | 121 |
| GO:00164853 | Liver | Cirrhotic | protein processing | 85/4634 | 225/18723 | 9.01e-06 | 1.32e-04 | 85 |
| GO:005160412 | Liver | HCC | protein maturation | 171/7958 | 294/18723 | 3.80e-08 | 8.30e-07 | 171 |
| GO:001648511 | Liver | HCC | protein processing | 121/7958 | 225/18723 | 4.01e-04 | 2.71e-03 | 121 |
| Page: 1 |
| Pathway ID | Tissue | Disease Stage | Description | Gene Ratio | Bg Ratio | pvalue | p.adjust | qvalue | Count |
| Page: 1 |
Top |
Cell-cell communication analysis |
| Identification of potential cell-cell interactions between two cell types and their ligand-receptor pairs for different disease states |
| Ligand | Receptor | LRpair | Pathway | Tissue | Disease Stage |
| Page: 1 |
Top |
Single-cell gene regulatory network inference analysis |
| Find out the significant the regulons (TFs) and the target genes of each regulon across cell types for different disease states |
| TF | Cell Type | Tissue | Disease Stage | Target Gene | RSS | Regulon Activity |
| ∗The dot plots of a searched regulon are shown for all cell subpopulations in each disease state of each tissue based on the regulon specific score inferred using pySCENIC and by calculating the average expression. |
| Page: 1 |
Top |
Somatic mutation of malignant transformation related genes |
| Annotation of somatic variants for genes involved in malignant transformation |
| Hugo Symbol | Variant Class | Variant Classification | dbSNP RS | HGVSc | HGVSp | HGVSp Short | SWISSPROT | BIOTYPE | SIFT | PolyPhen | Tumor Sample Barcode | Tissue | Histology | Sex | Age | Stage | Therapy Types | Drugs | Outcome |
| CPXM1 | SNV | Missense_Mutation | c.1267N>C | p.Glu423Gln | p.E423Q | Q96SM3 | protein_coding | tolerated(0.14) | possibly_damaging(0.745) | TCGA-A8-A09G-01 | Breast | breast invasive carcinoma | Female | >=65 | III/IV | Unknown | Unknown | SD | |
| CPXM1 | SNV | Missense_Mutation | rs868174784 | c.872N>T | p.Ser291Phe | p.S291F | Q96SM3 | protein_coding | deleterious(0) | possibly_damaging(0.853) | TCGA-AN-A046-01 | Breast | breast invasive carcinoma | Female | >=65 | I/II | Unknown | Unknown | SD |
| CPXM1 | SNV | Missense_Mutation | c.1489C>T | p.Leu497Phe | p.L497F | Q96SM3 | protein_coding | tolerated(0.09) | probably_damaging(0.977) | TCGA-BH-A0GZ-01 | Breast | breast invasive carcinoma | Female | <65 | I/II | Hormone Therapy | arimidex | SD | |
| CPXM1 | SNV | Missense_Mutation | c.1399N>C | p.Tyr467His | p.Y467H | Q96SM3 | protein_coding | tolerated(0.46) | possibly_damaging(0.855) | TCGA-BH-A18V-01 | Breast | breast invasive carcinoma | Female | <65 | I/II | Unknown | Unknown | SD | |
| CPXM1 | SNV | Missense_Mutation | c.830C>T | p.Ser277Leu | p.S277L | Q96SM3 | protein_coding | deleterious(0) | benign(0.053) | TCGA-C8-A12P-01 | Breast | breast invasive carcinoma | Female | <65 | I/II | Unknown | Unknown | SD | |
| CPXM1 | SNV | Missense_Mutation | rs773155636 | c.962N>A | p.Arg321His | p.R321H | Q96SM3 | protein_coding | deleterious(0.02) | benign(0.206) | TCGA-C8-A1HK-01 | Breast | breast invasive carcinoma | Female | <65 | I/II | Unknown | Unknown | SD |
| CPXM1 | SNV | Missense_Mutation | rs769164265 | c.1267N>A | p.Glu423Lys | p.E423K | Q96SM3 | protein_coding | tolerated(0.14) | benign(0.44) | TCGA-C8-A26Y-01 | Breast | breast invasive carcinoma | Female | >=65 | I/II | Unknown | Unknown | SD |
| CPXM1 | SNV | Missense_Mutation | rs756881556 | c.1984C>T | p.Arg662Cys | p.R662C | Q96SM3 | protein_coding | deleterious(0) | probably_damaging(1) | TCGA-E2-A158-01 | Breast | breast invasive carcinoma | Female | <65 | I/II | Chemotherapy | arimidex | SD |
| CPXM1 | insertion | Nonsense_Mutation | novel | c.1095_1096insTCAAGACGGGAAGGGGAAGAGTAGAGAGGGAGGGACAAAGTGAGGA | p.Gly366SerfsTer8 | p.G366Sfs*8 | Q96SM3 | protein_coding | TCGA-A2-A0CU-01 | Breast | breast invasive carcinoma | Female | >=65 | I/II | Hormone Therapy | tamoxiphen | SD | ||
| CPXM1 | insertion | Frame_Shift_Ins | novel | c.1151_1152insTGGGCAGGGTGTGGAGTATGGACAGGGAT | p.Asn385GlyfsTer10 | p.N385Gfs*10 | Q96SM3 | protein_coding | TCGA-AN-A0FX-01 | Breast | breast invasive carcinoma | Female | <65 | I/II | Unknown | Unknown | SD |
| Page: 1 2 3 4 5 6 7 8 9 10 11 |
Top |
Related drugs of malignant transformation related genes |
| Identification of chemicals and drugs interact with genes involved in malignant transfromation |
| (DGIdb 4.0) |
| Entrez ID | Symbol | Category | Interaction Types | Drug Claim Name | Drug Name | PMIDs |
| Page: 1 |

Copyright 2023-Present -The University of Texas Health Science Center at Houston |