
|
|||||
|
 | |
| |
| |
| |
| |
| |
|
Gene: CPVL |
Gene summary for CPVL |
| Gene information | Species | Human | Gene symbol | CPVL | Gene ID | 54504 |
| Gene name | carboxypeptidase vitellogenic like | |
| Gene Alias | HVLP | |
| Cytomap | 7p14.3 | |
| Gene Type | protein-coding | GO ID | GO:0006508 | UniProtAcc | A0A024RA40 |
Top |
Malignant transformation analysis |
| Identification of the aberrant gene expression in precancerous and cancerous lesions by comparing the gene expression of stem-like cells in diseased tissues with normal stem cells |
| Entrez ID | Symbol | Replicates | Species | Organ | Tissue | Adj P-value | Log2FC | Malignancy |
| 54504 | CPVL | LZE20T | Human | Esophagus | ESCC | 4.83e-07 | 3.48e-01 | 0.0662 |
| 54504 | CPVL | LZE22T | Human | Esophagus | ESCC | 1.11e-08 | 5.66e-01 | 0.068 |
| 54504 | CPVL | LZE24T | Human | Esophagus | ESCC | 1.33e-11 | 2.88e-01 | 0.0596 |
| 54504 | CPVL | P1T-E | Human | Esophagus | ESCC | 1.06e-02 | 3.56e-01 | 0.0875 |
| 54504 | CPVL | P2T-E | Human | Esophagus | ESCC | 6.61e-16 | 4.20e-01 | 0.1177 |
| 54504 | CPVL | P4T-E | Human | Esophagus | ESCC | 6.64e-43 | 1.03e+00 | 0.1323 |
| 54504 | CPVL | P8T-E | Human | Esophagus | ESCC | 4.87e-29 | 8.80e-01 | 0.0889 |
| 54504 | CPVL | P10T-E | Human | Esophagus | ESCC | 3.27e-19 | 4.92e-01 | 0.116 |
| 54504 | CPVL | P11T-E | Human | Esophagus | ESCC | 3.10e-17 | 9.49e-01 | 0.1426 |
| 54504 | CPVL | P12T-E | Human | Esophagus | ESCC | 1.89e-15 | 3.19e-01 | 0.1122 |
| 54504 | CPVL | P16T-E | Human | Esophagus | ESCC | 4.73e-50 | 1.09e+00 | 0.1153 |
| 54504 | CPVL | P20T-E | Human | Esophagus | ESCC | 5.35e-20 | 5.00e-01 | 0.1124 |
| 54504 | CPVL | P22T-E | Human | Esophagus | ESCC | 1.88e-14 | 1.36e-01 | 0.1236 |
| 54504 | CPVL | P26T-E | Human | Esophagus | ESCC | 2.54e-30 | 6.27e-01 | 0.1276 |
| 54504 | CPVL | P27T-E | Human | Esophagus | ESCC | 8.17e-21 | 5.20e-01 | 0.1055 |
| 54504 | CPVL | P37T-E | Human | Esophagus | ESCC | 9.22e-04 | 1.12e-01 | 0.1371 |
| 54504 | CPVL | P39T-E | Human | Esophagus | ESCC | 2.09e-07 | 1.15e-01 | 0.0894 |
| 54504 | CPVL | P52T-E | Human | Esophagus | ESCC | 1.28e-04 | 1.98e-01 | 0.1555 |
| 54504 | CPVL | P56T-E | Human | Esophagus | ESCC | 4.54e-13 | 1.27e+00 | 0.1613 |
| 54504 | CPVL | P61T-E | Human | Esophagus | ESCC | 2.87e-24 | 6.91e-01 | 0.099 |
| Page: 1 2 3 4 |
| Tissue | Expression Dynamics | Abbreviation |
| Esophagus |  | ESCC: Esophageal squamous cell carcinoma |
| HGIN: High-grade intraepithelial neoplasias | ||
| LGIN: Low-grade intraepithelial neoplasias | ||
| Liver | 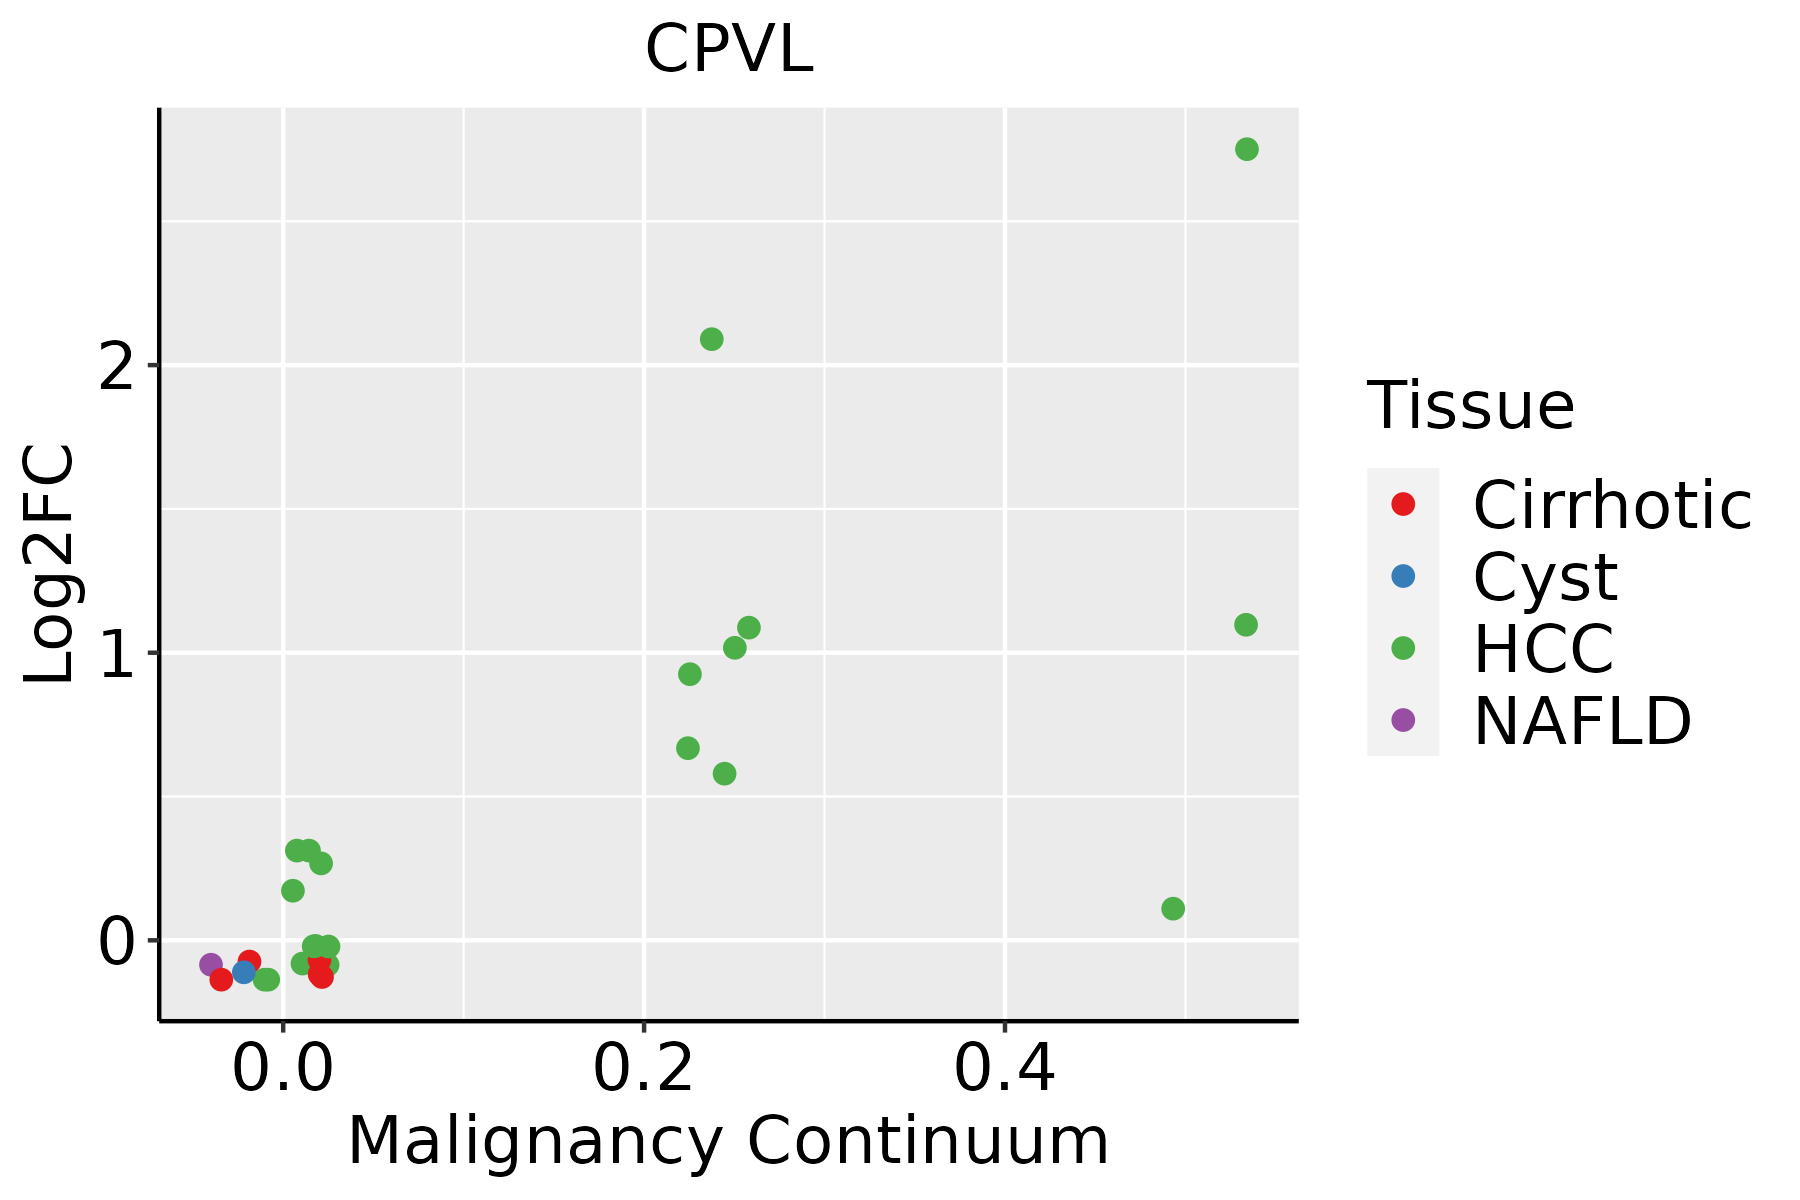 | HCC: Hepatocellular carcinoma |
| NAFLD: Non-alcoholic fatty liver disease | ||
| Oral Cavity | 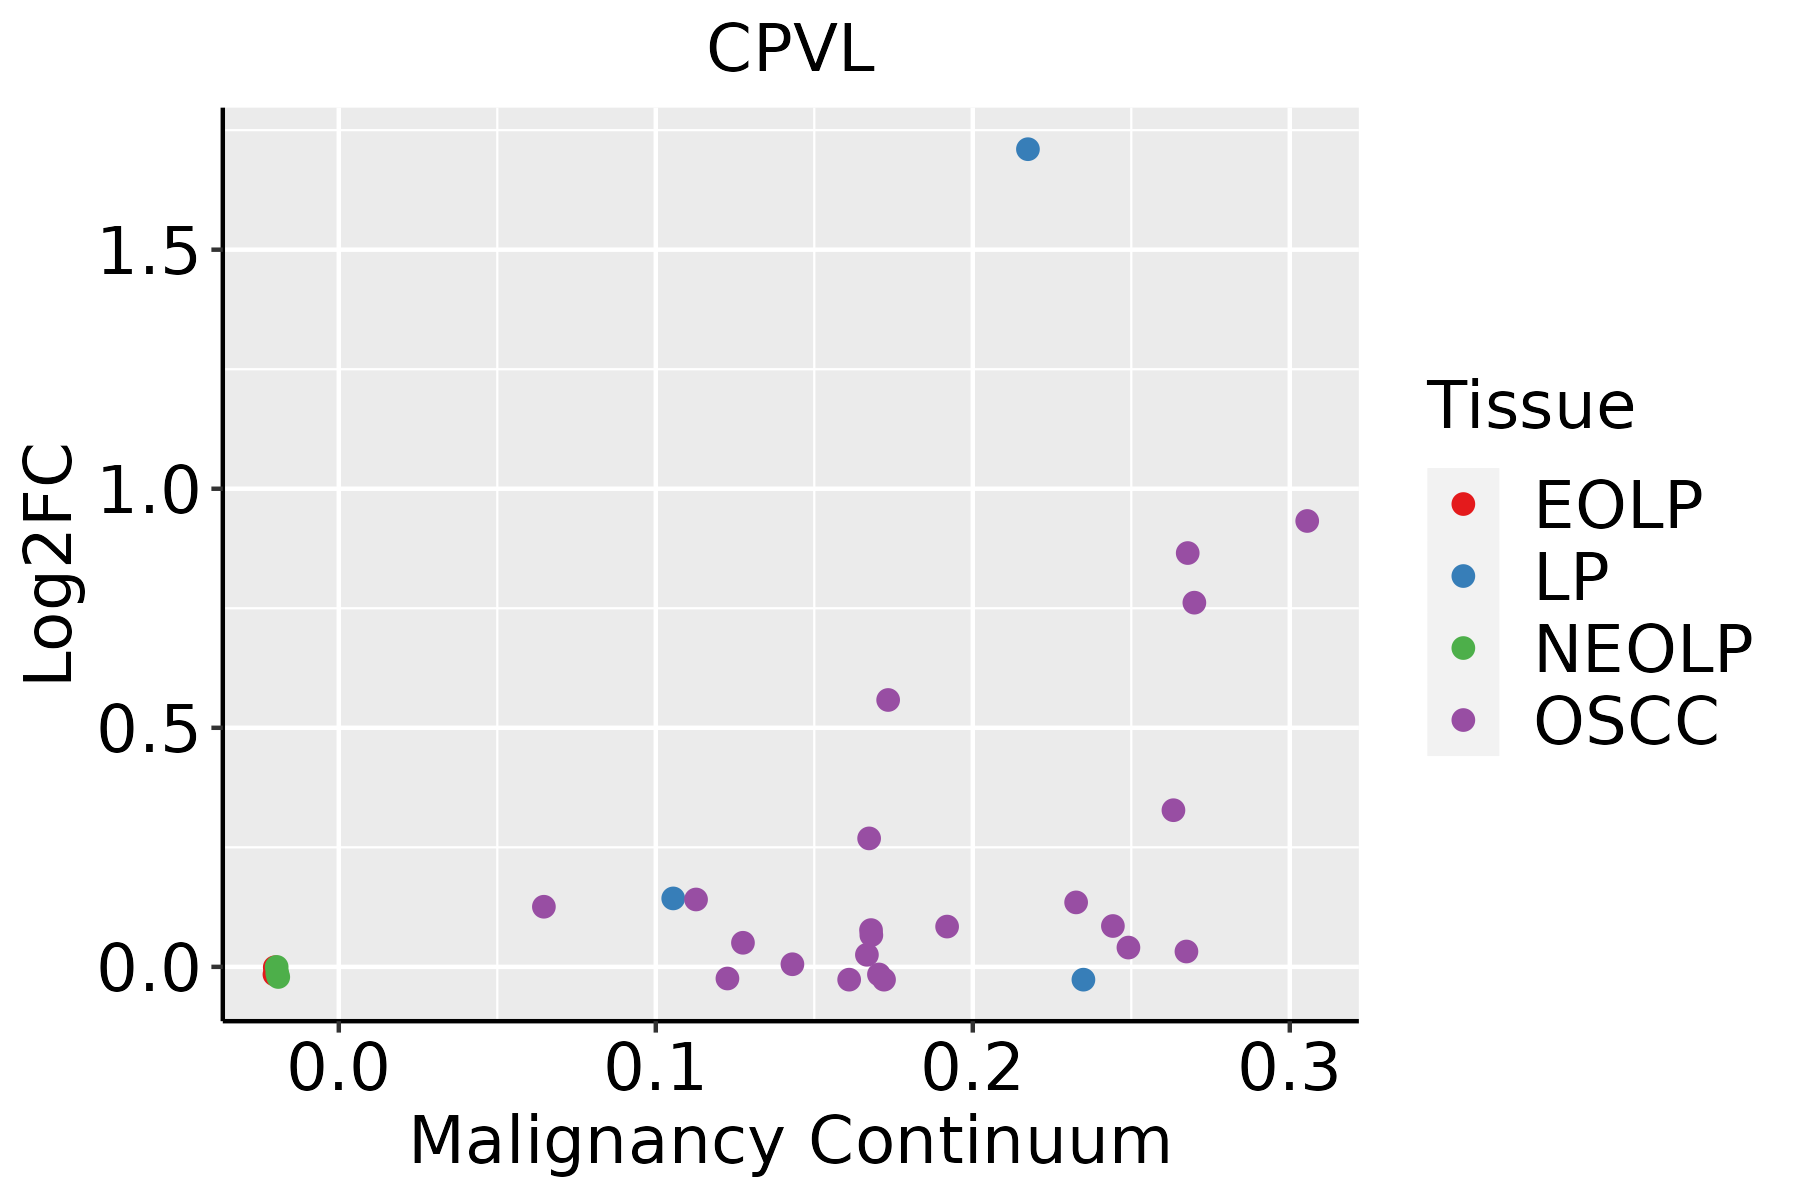 | EOLP: Erosive Oral lichen planus |
| LP: leukoplakia | ||
| NEOLP: Non-erosive oral lichen planus | ||
| OSCC: Oral squamous cell carcinoma | ||
| Thyroid | 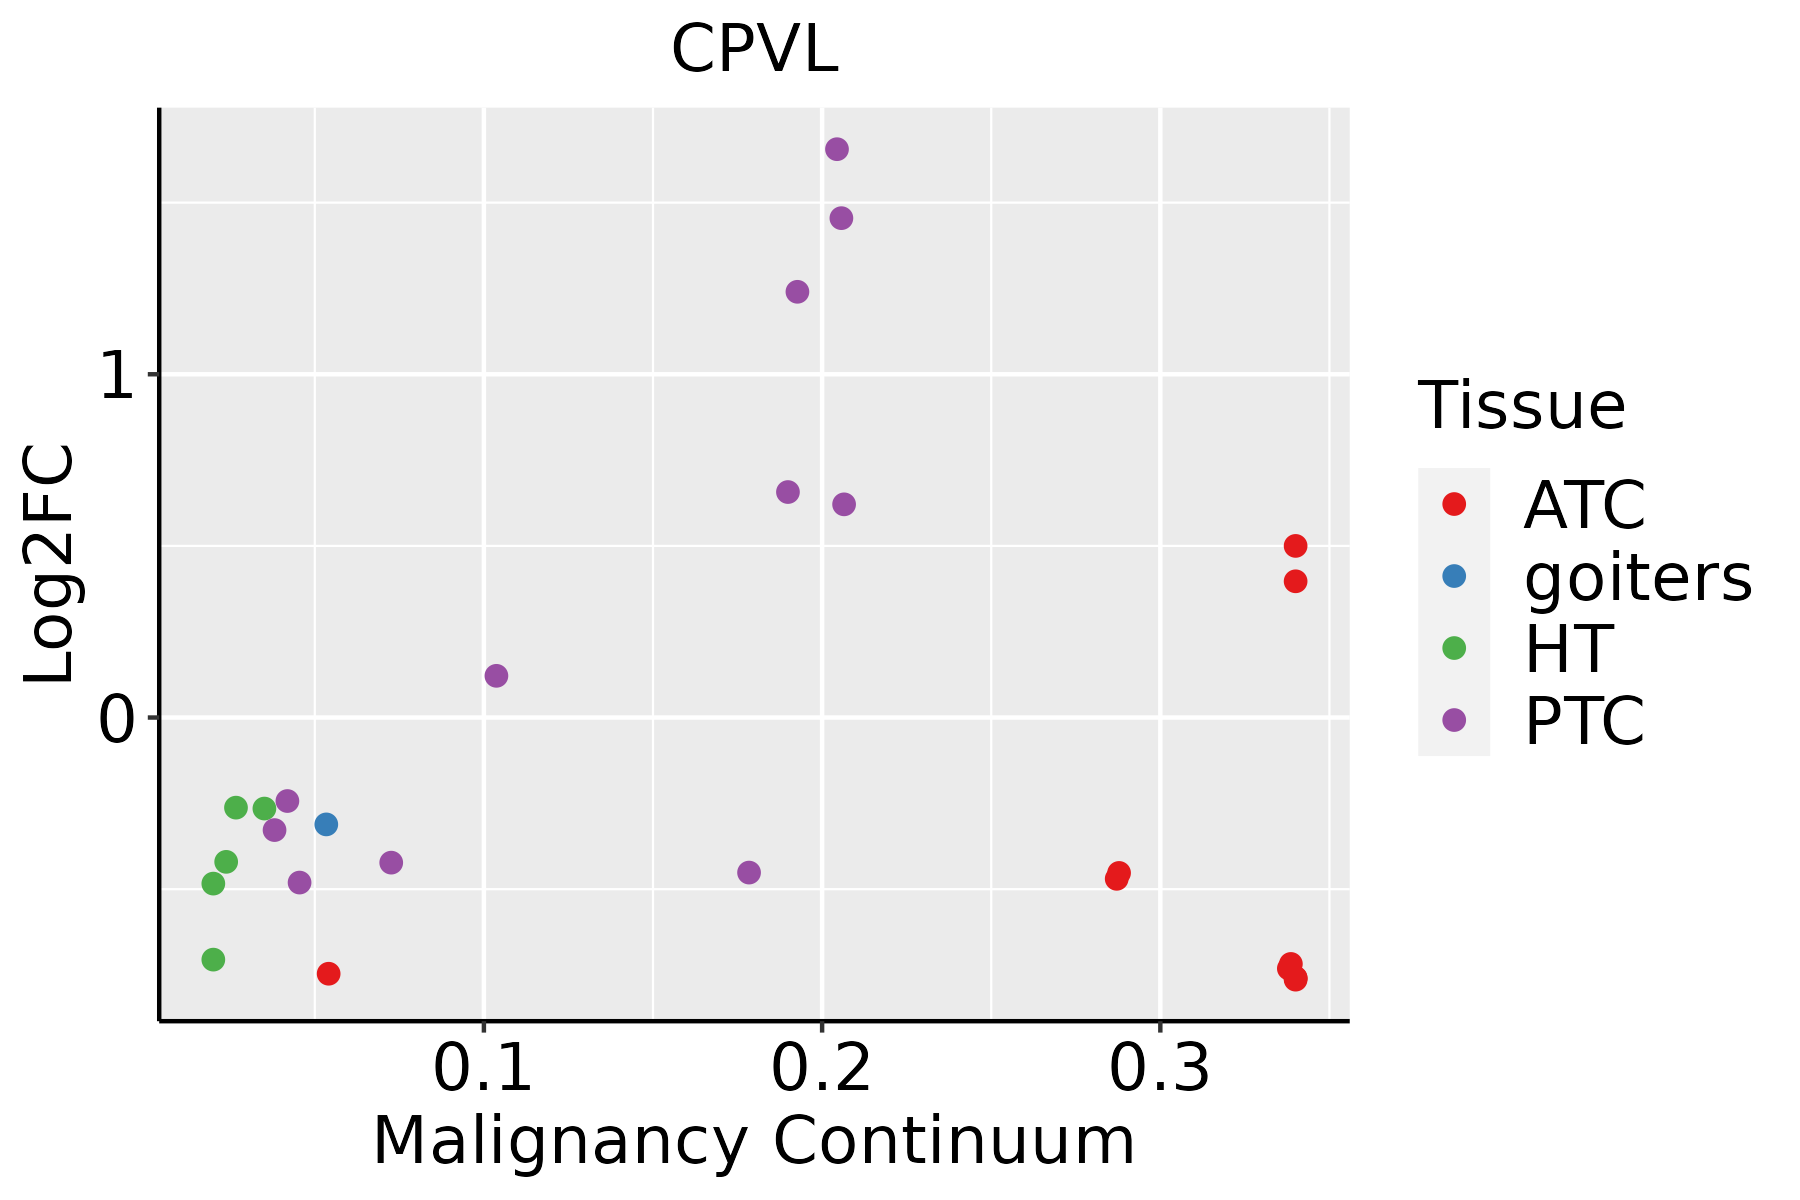 | ATC: Anaplastic thyroid cancer |
| HT: Hashimoto's thyroiditis | ||
| PTC: Papillary thyroid cancer |
| ∗log2FC in expression of this searched gene in stem-like cells from each diseased tissue sample relative to stem-like cells in normal samples in each tissue plotted against the malignancy continuum. Samples are colored based on if they are from different disease stage. |
Top |
Malignant transformation related pathway analysis |
| Find out the enriched GO biological processes and KEGG pathways involved in transition from healthy to precancer to cancer |
| Tissue | Disease Stage | Enriched GO biological Processes |
| Colorectum | AD |  |
| Colorectum | SER |  |
| Colorectum | MSS |  |
| Colorectum | MSI-H |  |
| Colorectum | FAP |  |
| ∗Top 15 enriched GO BP terms are showed in the bar plot of each disease state in each tissue. Each row represents a significant GO biological process which is colored according to the -log10(p.adjust). |
| Page: 1 2 3 4 5 6 7 8 9 |
| GO ID | Tissue | Disease Stage | Description | Gene Ratio | Bg Ratio | pvalue | p.adjust | Count |
| Page: 1 |
| Pathway ID | Tissue | Disease Stage | Description | Gene Ratio | Bg Ratio | pvalue | p.adjust | qvalue | Count |
| Page: 1 |
Top |
Cell-cell communication analysis |
| Identification of potential cell-cell interactions between two cell types and their ligand-receptor pairs for different disease states |
| Ligand | Receptor | LRpair | Pathway | Tissue | Disease Stage |
| Page: 1 |
Top |
Single-cell gene regulatory network inference analysis |
| Find out the significant the regulons (TFs) and the target genes of each regulon across cell types for different disease states |
| TF | Cell Type | Tissue | Disease Stage | Target Gene | RSS | Regulon Activity |
| ∗The dot plots of a searched regulon are shown for all cell subpopulations in each disease state of each tissue based on the regulon specific score inferred using pySCENIC and by calculating the average expression. |
| Page: 1 |
Top |
Somatic mutation of malignant transformation related genes |
| Annotation of somatic variants for genes involved in malignant transformation |
| Hugo Symbol | Variant Class | Variant Classification | dbSNP RS | HGVSc | HGVSp | HGVSp Short | SWISSPROT | BIOTYPE | SIFT | PolyPhen | Tumor Sample Barcode | Tissue | Histology | Sex | Age | Stage | Therapy Types | Drugs | Outcome |
| CPVL | SNV | Missense_Mutation | rs775870649 | c.694G>A | p.Gly232Arg | p.G232R | Q9H3G5 | protein_coding | deleterious(0) | probably_damaging(1) | TCGA-AN-A046-01 | Breast | breast invasive carcinoma | Female | >=65 | I/II | Unknown | Unknown | SD |
| CPVL | SNV | Missense_Mutation | novel | c.533N>T | p.Asp178Val | p.D178V | Q9H3G5 | protein_coding | deleterious(0) | probably_damaging(0.969) | TCGA-BH-A209-01 | Breast | breast invasive carcinoma | Female | >=65 | I/II | Unknown | Unknown | SD |
| CPVL | SNV | Missense_Mutation | c.385G>T | p.Val129Phe | p.V129F | Q9H3G5 | protein_coding | deleterious(0.04) | probably_damaging(0.938) | TCGA-D8-A1JL-01 | Breast | breast invasive carcinoma | Female | >=65 | I/II | Unknown | Unknown | SD | |
| CPVL | SNV | Missense_Mutation | c.279N>A | p.Phe93Leu | p.F93L | Q9H3G5 | protein_coding | deleterious(0) | possibly_damaging(0.841) | TCGA-D8-A27G-01 | Breast | breast invasive carcinoma | Female | >=65 | I/II | Unknown | Unknown | SD | |
| CPVL | deletion | Frame_Shift_Del | novel | c.726delN | p.Glu243AsnfsTer4 | p.E243Nfs*4 | Q9H3G5 | protein_coding | TCGA-D8-A27V-01 | Breast | breast invasive carcinoma | Female | <65 | I/II | Hormone Therapy | tamoxiphen | SD | ||
| CPVL | deletion | Frame_Shift_Del | novel | c.94delN | p.Ser32ProfsTer29 | p.S32Pfs*29 | Q9H3G5 | protein_coding | TCGA-EW-A2FV-01 | Breast | breast invasive carcinoma | Female | <65 | III/IV | Chemotherapy | docetaxel | SD | ||
| CPVL | SNV | Missense_Mutation | c.574G>A | p.Glu192Lys | p.E192K | Q9H3G5 | protein_coding | tolerated(0.1) | benign(0.281) | TCGA-JX-A3Q0-01 | Cervix | cervical & endocervical cancer | Female | <65 | III/IV | Unknown | Unknown | SD | |
| CPVL | deletion | Frame_Shift_Del | c.794delN | p.Lys265SerfsTer11 | p.K265Sfs*11 | Q9H3G5 | protein_coding | TCGA-EA-A410-01 | Cervix | cervical & endocervical cancer | Female | <65 | I/II | Unknown | Unknown | SD | |||
| CPVL | SNV | Missense_Mutation | c.23N>C | p.Val8Ala | p.V8A | Q9H3G5 | protein_coding | tolerated(0.54) | benign(0) | TCGA-AA-3663-01 | Colorectum | colon adenocarcinoma | Male | <65 | I/II | Unknown | Unknown | SD | |
| CPVL | SNV | Missense_Mutation | c.949N>G | p.Phe317Val | p.F317V | Q9H3G5 | protein_coding | deleterious(0.01) | benign(0.1) | TCGA-AA-3818-01 | Colorectum | colon adenocarcinoma | Female | >=65 | I/II | Unknown | Unknown | PD |
| Page: 1 2 3 4 5 6 7 |
Top |
Related drugs of malignant transformation related genes |
| Identification of chemicals and drugs interact with genes involved in malignant transfromation |
| (DGIdb 4.0) |
| Entrez ID | Symbol | Category | Interaction Types | Drug Claim Name | Drug Name | PMIDs |
| Page: 1 |

Copyright 2023-Present -The University of Texas Health Science Center at Houston |