
|
|||||
|
 | |
| |
| |
| |
| |
| |
|
Gene: CPTP |
Gene summary for CPTP |
| Gene information | Species | Human | Gene symbol | CPTP | Gene ID | 80772 |
| Gene name | ceramide-1-phosphate transfer protein | |
| Gene Alias | GLTPD1 | |
| Cytomap | 1p36.33 | |
| Gene Type | protein-coding | GO ID | GO:0001816 | UniProtAcc | Q5TA50 |
Top |
Malignant transformation analysis |
| Identification of the aberrant gene expression in precancerous and cancerous lesions by comparing the gene expression of stem-like cells in diseased tissues with normal stem cells |
| Entrez ID | Symbol | Replicates | Species | Organ | Tissue | Adj P-value | Log2FC | Malignancy |
| 80772 | CPTP | LZE20T | Human | Esophagus | ESCC | 2.77e-10 | 3.09e-01 | 0.0662 |
| 80772 | CPTP | LZE22T | Human | Esophagus | ESCC | 1.69e-07 | 3.83e-01 | 0.068 |
| 80772 | CPTP | LZE24T | Human | Esophagus | ESCC | 1.98e-22 | 5.50e-01 | 0.0596 |
| 80772 | CPTP | LZE21T | Human | Esophagus | ESCC | 9.27e-05 | 2.44e-01 | 0.0655 |
| 80772 | CPTP | P1T-E | Human | Esophagus | ESCC | 3.82e-07 | 3.49e-01 | 0.0875 |
| 80772 | CPTP | P2T-E | Human | Esophagus | ESCC | 1.00e-16 | 3.46e-01 | 0.1177 |
| 80772 | CPTP | P4T-E | Human | Esophagus | ESCC | 8.59e-30 | 6.49e-01 | 0.1323 |
| 80772 | CPTP | P5T-E | Human | Esophagus | ESCC | 3.75e-12 | 3.04e-01 | 0.1327 |
| 80772 | CPTP | P8T-E | Human | Esophagus | ESCC | 7.88e-27 | 5.46e-01 | 0.0889 |
| 80772 | CPTP | P9T-E | Human | Esophagus | ESCC | 4.29e-09 | 1.82e-01 | 0.1131 |
| 80772 | CPTP | P10T-E | Human | Esophagus | ESCC | 1.60e-25 | 4.19e-01 | 0.116 |
| 80772 | CPTP | P11T-E | Human | Esophagus | ESCC | 3.25e-08 | 4.21e-01 | 0.1426 |
| 80772 | CPTP | P12T-E | Human | Esophagus | ESCC | 1.99e-12 | 2.51e-01 | 0.1122 |
| 80772 | CPTP | P15T-E | Human | Esophagus | ESCC | 3.90e-23 | 4.02e-01 | 0.1149 |
| 80772 | CPTP | P16T-E | Human | Esophagus | ESCC | 1.71e-13 | 1.69e-01 | 0.1153 |
| 80772 | CPTP | P17T-E | Human | Esophagus | ESCC | 5.24e-07 | 2.52e-01 | 0.1278 |
| 80772 | CPTP | P19T-E | Human | Esophagus | ESCC | 9.79e-07 | 4.59e-01 | 0.1662 |
| 80772 | CPTP | P20T-E | Human | Esophagus | ESCC | 9.98e-19 | 4.05e-01 | 0.1124 |
| 80772 | CPTP | P21T-E | Human | Esophagus | ESCC | 8.16e-36 | 7.60e-01 | 0.1617 |
| 80772 | CPTP | P22T-E | Human | Esophagus | ESCC | 1.39e-14 | 1.73e-01 | 0.1236 |
| Page: 1 2 3 4 5 |
| Tissue | Expression Dynamics | Abbreviation |
| Esophagus | 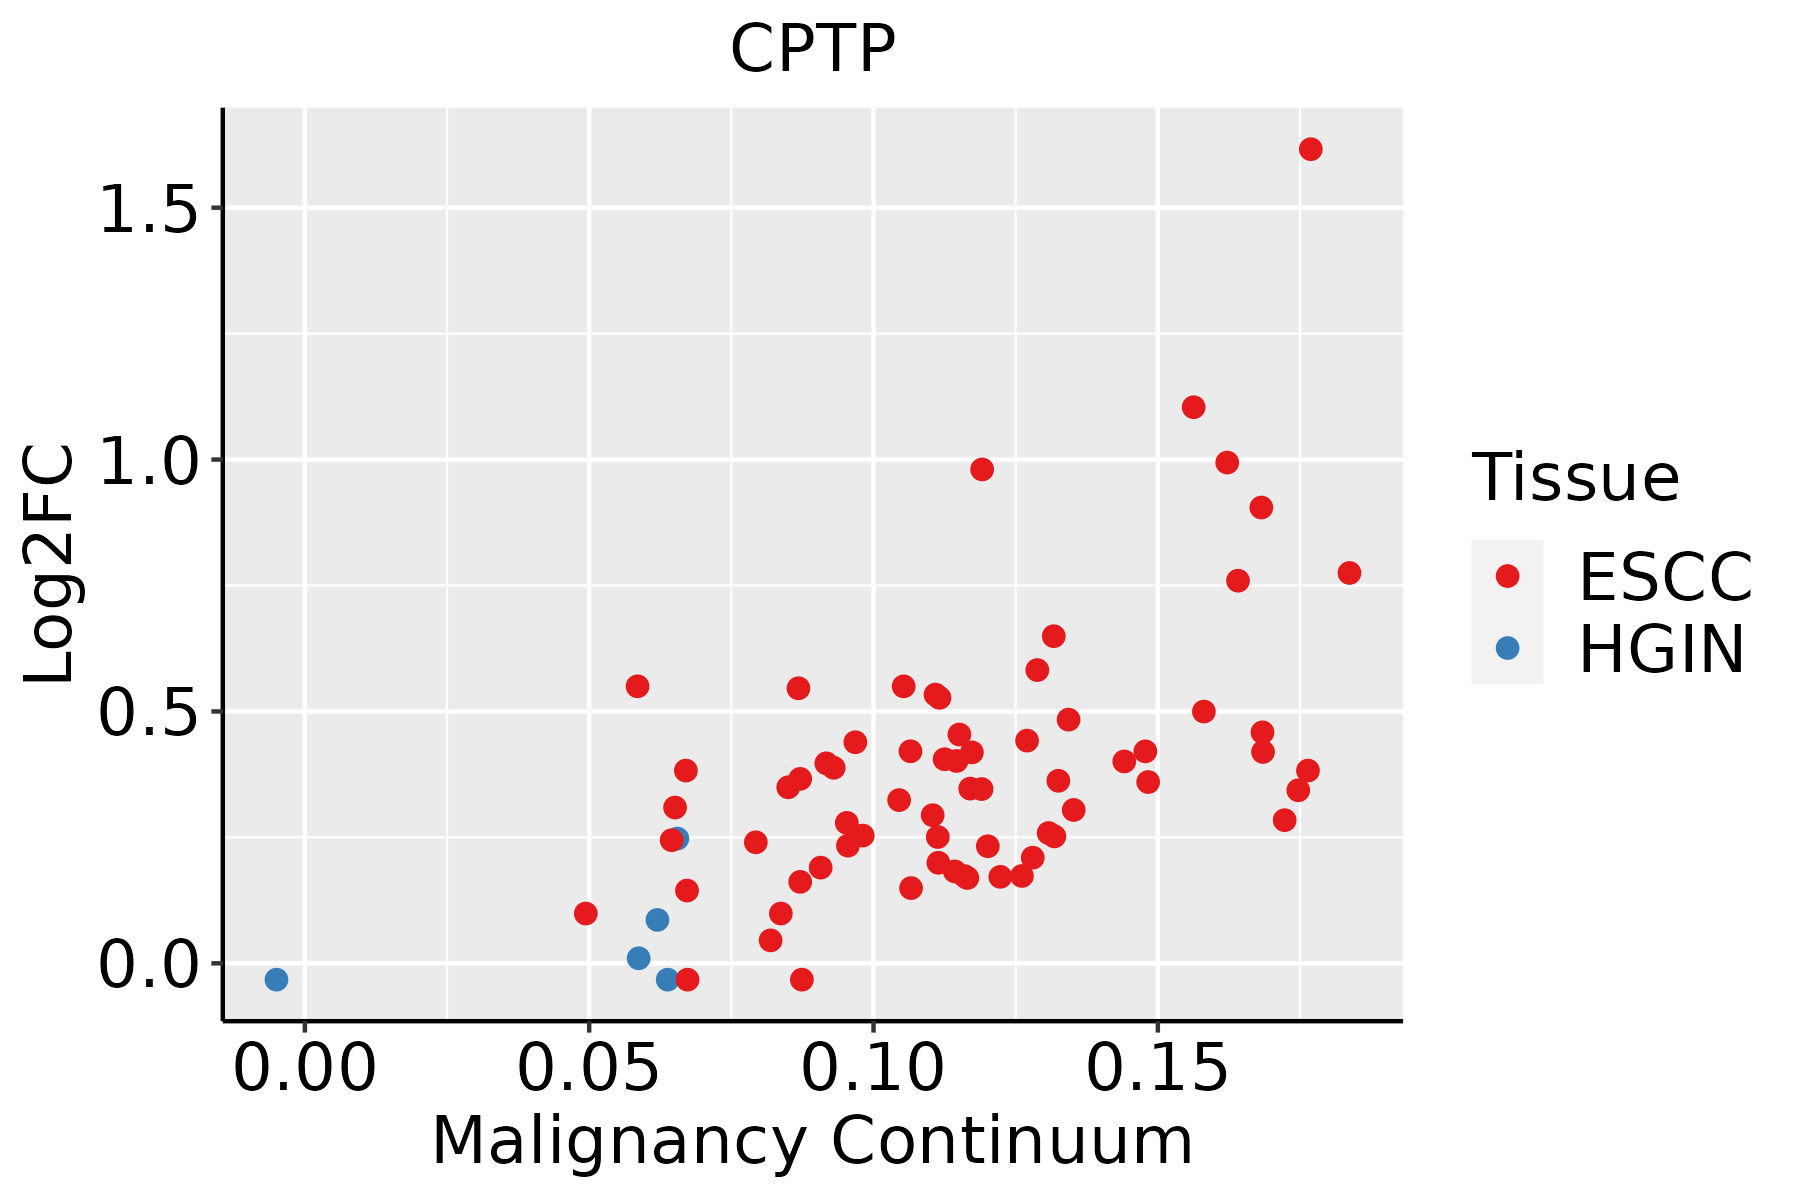 | ESCC: Esophageal squamous cell carcinoma |
| HGIN: High-grade intraepithelial neoplasias | ||
| LGIN: Low-grade intraepithelial neoplasias | ||
| Liver | 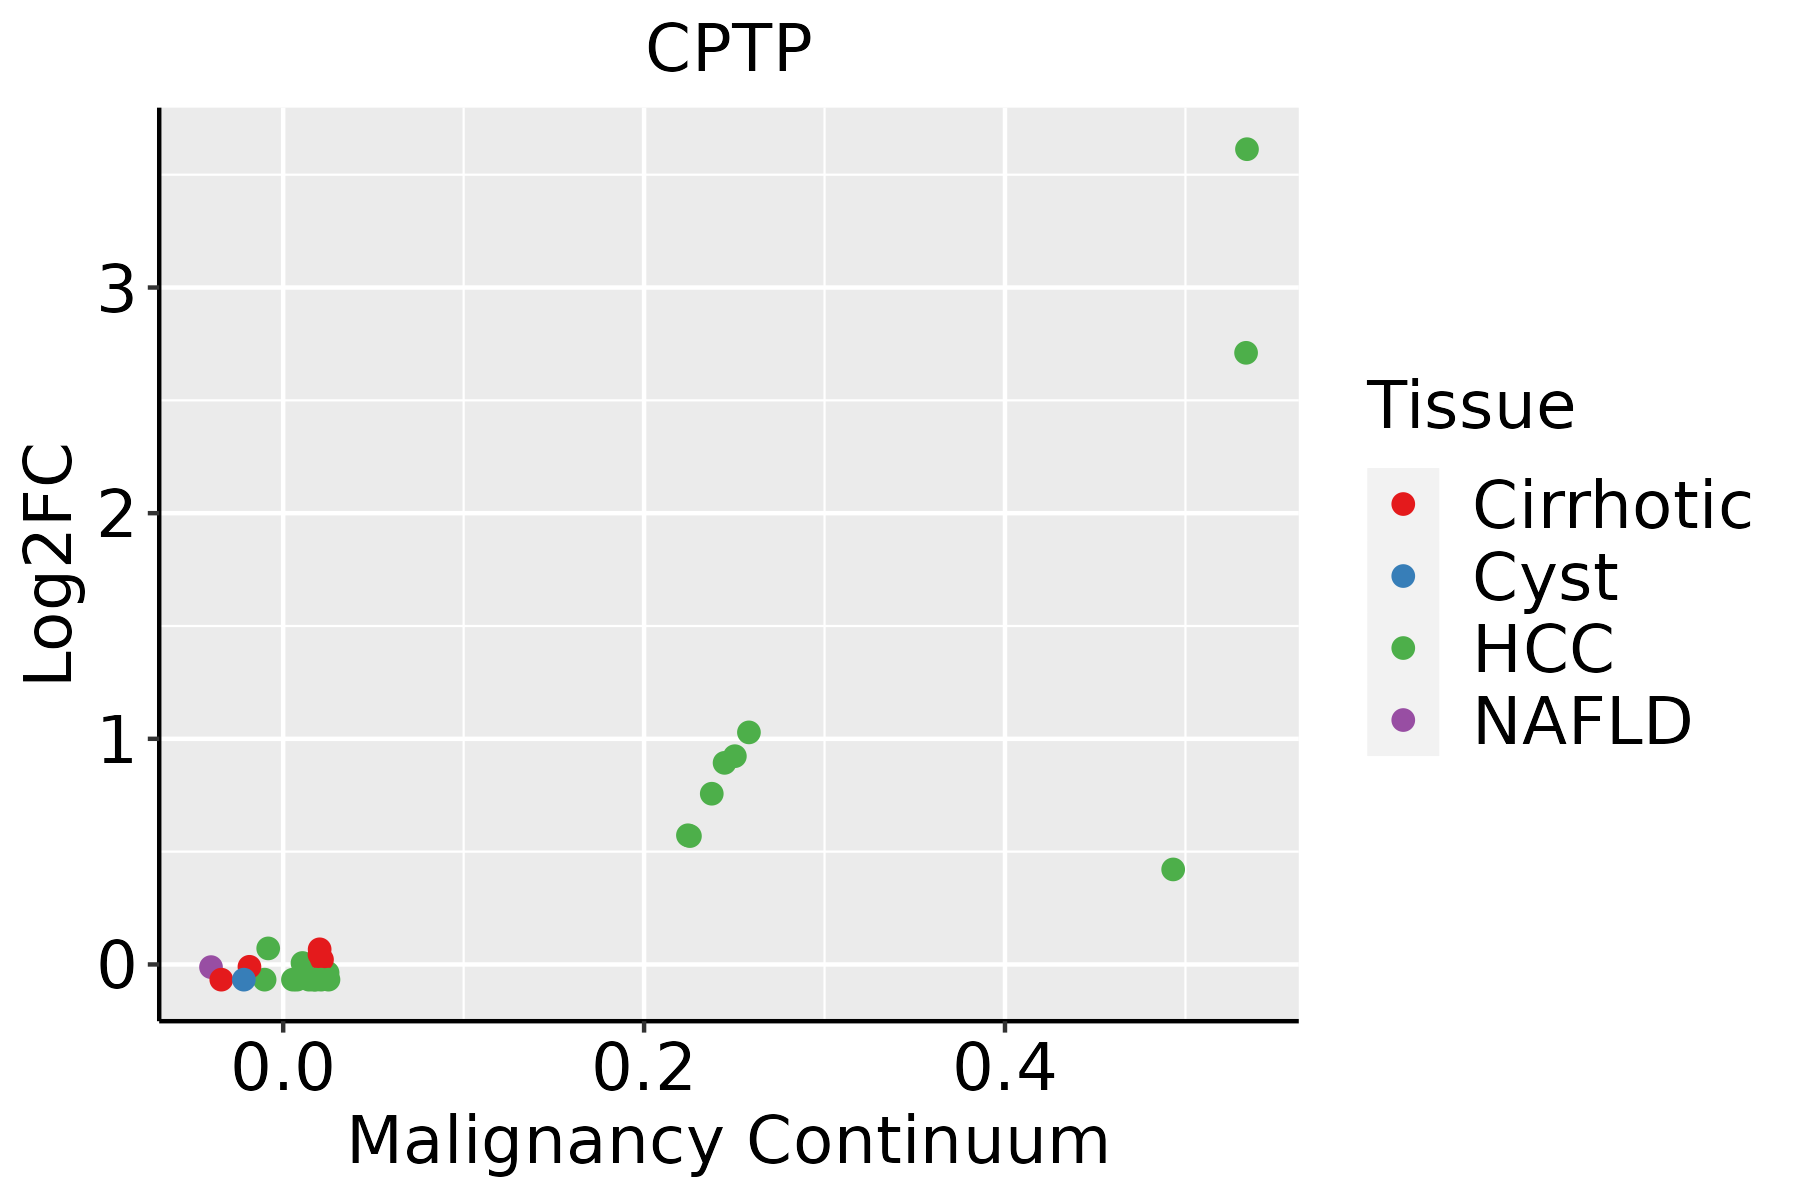 | HCC: Hepatocellular carcinoma |
| NAFLD: Non-alcoholic fatty liver disease | ||
| Oral Cavity |  | EOLP: Erosive Oral lichen planus |
| LP: leukoplakia | ||
| NEOLP: Non-erosive oral lichen planus | ||
| OSCC: Oral squamous cell carcinoma |
| ∗log2FC in expression of this searched gene in stem-like cells from each diseased tissue sample relative to stem-like cells in normal samples in each tissue plotted against the malignancy continuum. Samples are colored based on if they are from different disease stage. |
Top |
Malignant transformation related pathway analysis |
| Find out the enriched GO biological processes and KEGG pathways involved in transition from healthy to precancer to cancer |
| Tissue | Disease Stage | Enriched GO biological Processes |
| Colorectum | AD |  |
| Colorectum | SER |  |
| Colorectum | MSS |  |
| Colorectum | MSI-H |  |
| Colorectum | FAP |  |
| ∗Top 15 enriched GO BP terms are showed in the bar plot of each disease state in each tissue. Each row represents a significant GO biological process which is colored according to the -log10(p.adjust). |
| Page: 1 2 3 4 5 6 7 8 9 |
| GO ID | Tissue | Disease Stage | Description | Gene Ratio | Bg Ratio | pvalue | p.adjust | Count |
| GO:001050617 | Esophagus | ESCC | regulation of autophagy | 220/8552 | 317/18723 | 6.72e-18 | 6.36e-16 | 220 |
| GO:0043254111 | Esophagus | ESCC | regulation of protein-containing complex assembly | 278/8552 | 428/18723 | 3.81e-16 | 2.77e-14 | 278 |
| GO:0009895111 | Esophagus | ESCC | negative regulation of catabolic process | 201/8552 | 320/18723 | 3.88e-10 | 1.05e-08 | 201 |
| GO:0031330111 | Esophagus | ESCC | negative regulation of cellular catabolic process | 166/8552 | 262/18723 | 5.17e-09 | 1.08e-07 | 166 |
| GO:00066433 | Esophagus | ESCC | membrane lipid metabolic process | 130/8552 | 203/18723 | 9.29e-08 | 1.54e-06 | 130 |
| GO:00066652 | Esophagus | ESCC | sphingolipid metabolic process | 96/8552 | 155/18723 | 3.21e-05 | 2.66e-04 | 96 |
| GO:001050712 | Esophagus | ESCC | negative regulation of autophagy | 56/8552 | 85/18723 | 1.34e-04 | 9.09e-04 | 56 |
| GO:0031333110 | Esophagus | ESCC | negative regulation of protein-containing complex assembly | 86/8552 | 141/18723 | 1.74e-04 | 1.14e-03 | 86 |
| GO:00066642 | Esophagus | ESCC | glycolipid metabolic process | 63/8552 | 100/18723 | 3.55e-04 | 2.06e-03 | 63 |
| GO:19035092 | Esophagus | ESCC | liposaccharide metabolic process | 63/8552 | 101/18723 | 5.25e-04 | 2.90e-03 | 63 |
| GO:004325412 | Liver | Cirrhotic | regulation of protein-containing complex assembly | 169/4634 | 428/18723 | 7.40e-12 | 4.99e-10 | 169 |
| GO:001050611 | Liver | Cirrhotic | regulation of autophagy | 132/4634 | 317/18723 | 2.17e-11 | 1.33e-09 | 132 |
| GO:00313337 | Liver | Cirrhotic | negative regulation of protein-containing complex assembly | 64/4634 | 141/18723 | 7.08e-08 | 2.14e-06 | 64 |
| GO:000989512 | Liver | Cirrhotic | negative regulation of catabolic process | 121/4634 | 320/18723 | 1.21e-07 | 3.39e-06 | 121 |
| GO:003133012 | Liver | Cirrhotic | negative regulation of cellular catabolic process | 101/4634 | 262/18723 | 4.57e-07 | 1.05e-05 | 101 |
| GO:001087611 | Liver | Cirrhotic | lipid localization | 147/4634 | 448/18723 | 6.24e-05 | 7.12e-04 | 147 |
| GO:000686911 | Liver | Cirrhotic | lipid transport | 128/4634 | 398/18723 | 4.54e-04 | 3.69e-03 | 128 |
| GO:0006643 | Liver | Cirrhotic | membrane lipid metabolic process | 69/4634 | 203/18723 | 1.89e-03 | 1.19e-02 | 69 |
| GO:01200091 | Liver | Cirrhotic | intermembrane lipid transfer | 21/4634 | 48/18723 | 3.06e-03 | 1.73e-02 | 21 |
| GO:001050621 | Liver | HCC | regulation of autophagy | 210/7958 | 317/18723 | 7.59e-18 | 8.45e-16 | 210 |
| Page: 1 2 3 |
| Pathway ID | Tissue | Disease Stage | Description | Gene Ratio | Bg Ratio | pvalue | p.adjust | qvalue | Count |
| Page: 1 |
Top |
Cell-cell communication analysis |
| Identification of potential cell-cell interactions between two cell types and their ligand-receptor pairs for different disease states |
| Ligand | Receptor | LRpair | Pathway | Tissue | Disease Stage |
| Page: 1 |
Top |
Single-cell gene regulatory network inference analysis |
| Find out the significant the regulons (TFs) and the target genes of each regulon across cell types for different disease states |
| TF | Cell Type | Tissue | Disease Stage | Target Gene | RSS | Regulon Activity |
| CPTP | FIB | Breast | ADJ | KRT7,FP565260.1,ASCL2, etc. | 5.71e-02 |  |
| CPTP | CAF | Breast | ADJ | KRT7,FP565260.1,ASCL2, etc. | 1.10e-01 | |
| CPTP | INCAF | Breast | ADJ | KRT7,FP565260.1,ASCL2, etc. | 3.54e-02 | |
| CPTP | PERI | Breast | Precancer | KRT7,FP565260.1,ASCL2, etc. | 4.36e-02 |  |
| ∗The dot plots of a searched regulon are shown for all cell subpopulations in each disease state of each tissue based on the regulon specific score inferred using pySCENIC and by calculating the average expression. |
| Page: 1 |
Top |
Somatic mutation of malignant transformation related genes |
| Annotation of somatic variants for genes involved in malignant transformation |
| Hugo Symbol | Variant Class | Variant Classification | dbSNP RS | HGVSc | HGVSp | HGVSp Short | SWISSPROT | BIOTYPE | SIFT | PolyPhen | Tumor Sample Barcode | Tissue | Histology | Sex | Age | Stage | Therapy Types | Drugs | Outcome |
| CPTP | SNV | Missense_Mutation | rs375729538 | c.463N>T | p.Arg155Cys | p.R155C | Q5TA50 | protein_coding | deleterious(0) | probably_damaging(1) | TCGA-A5-A0G1-01 | Endometrium | uterine corpus endometrioid carcinoma | Female | >=65 | I/II | Unknown | Unknown | SD |
| CPTP | SNV | Missense_Mutation | novel | c.445N>C | p.Tyr149His | p.Y149H | Q5TA50 | protein_coding | tolerated(0.91) | benign(0.015) | TCGA-AP-A1DK-01 | Endometrium | uterine corpus endometrioid carcinoma | Female | <65 | I/II | Unknown | Unknown | SD |
| CPTP | SNV | Missense_Mutation | novel | c.628C>G | p.Leu210Val | p.L210V | Q5TA50 | protein_coding | deleterious(0) | possibly_damaging(0.817) | TCGA-AX-A1CE-01 | Endometrium | uterine corpus endometrioid carcinoma | Female | <65 | I/II | Unspecific | Paclitaxel | SD |
| CPTP | SNV | Missense_Mutation | novel | c.548N>T | p.Ala183Val | p.A183V | Q5TA50 | protein_coding | tolerated(0.34) | benign(0.089) | TCGA-D1-A175-01 | Endometrium | uterine corpus endometrioid carcinoma | Female | <65 | I/II | Chemotherapy | paclitaxel | SD |
| CPTP | SNV | Missense_Mutation | novel | c.24N>A | p.Phe8Leu | p.F8L | Q5TA50 | protein_coding | deleterious(0.02) | possibly_damaging(0.572) | TCGA-EO-A3AY-01 | Endometrium | uterine corpus endometrioid carcinoma | Female | <65 | I/II | Unknown | Unknown | PD |
| CPTP | SNV | Missense_Mutation | rs770647006 | c.64G>A | p.Asp22Asn | p.D22N | Q5TA50 | protein_coding | tolerated(0.79) | benign(0) | TCGA-05-4382-01 | Lung | lung adenocarcinoma | Male | >=65 | I/II | Unknown | Unknown | PD |
| CPTP | SNV | Missense_Mutation | novel | c.586N>A | p.Arg196Ser | p.R196S | Q5TA50 | protein_coding | tolerated(0.15) | benign(0.03) | TCGA-CN-5360-01 | Oral cavity | head & neck squamous cell carcinoma | Male | >=65 | I/II | Chemotherapy | cisplatin | SD |
| CPTP | SNV | Missense_Mutation | rs770647006 | c.64N>A | p.Asp22Asn | p.D22N | Q5TA50 | protein_coding | tolerated(0.79) | benign(0) | TCGA-CV-7255-01 | Oral cavity | head & neck squamous cell carcinoma | Female | <65 | I/II | Unknown | Unknown | PD |
| CPTP | SNV | Missense_Mutation | novel | c.176C>A | p.Ser59Tyr | p.S59Y | Q5TA50 | protein_coding | deleterious(0) | benign(0.361) | TCGA-RS-A6TO-01 | Oral cavity | head & neck squamous cell carcinoma | Female | >=65 | I/II | Immunotherapy | cetuximab | PD |
| CPTP | SNV | Missense_Mutation | rs375729538 | c.463N>T | p.Arg155Cys | p.R155C | Q5TA50 | protein_coding | deleterious(0) | probably_damaging(1) | TCGA-CG-5721-01 | Stomach | stomach adenocarcinoma | Male | <65 | III/IV | Unknown | Unknown | SD |
| Page: 1 2 |
Top |
Related drugs of malignant transformation related genes |
| Identification of chemicals and drugs interact with genes involved in malignant transfromation |
| (DGIdb 4.0) |
| Entrez ID | Symbol | Category | Interaction Types | Drug Claim Name | Drug Name | PMIDs |
| Page: 1 |

Copyright 2023-Present -The University of Texas Health Science Center at Houston |