| Tissue | Expression Dynamics | Abbreviation |
| Esophagus | 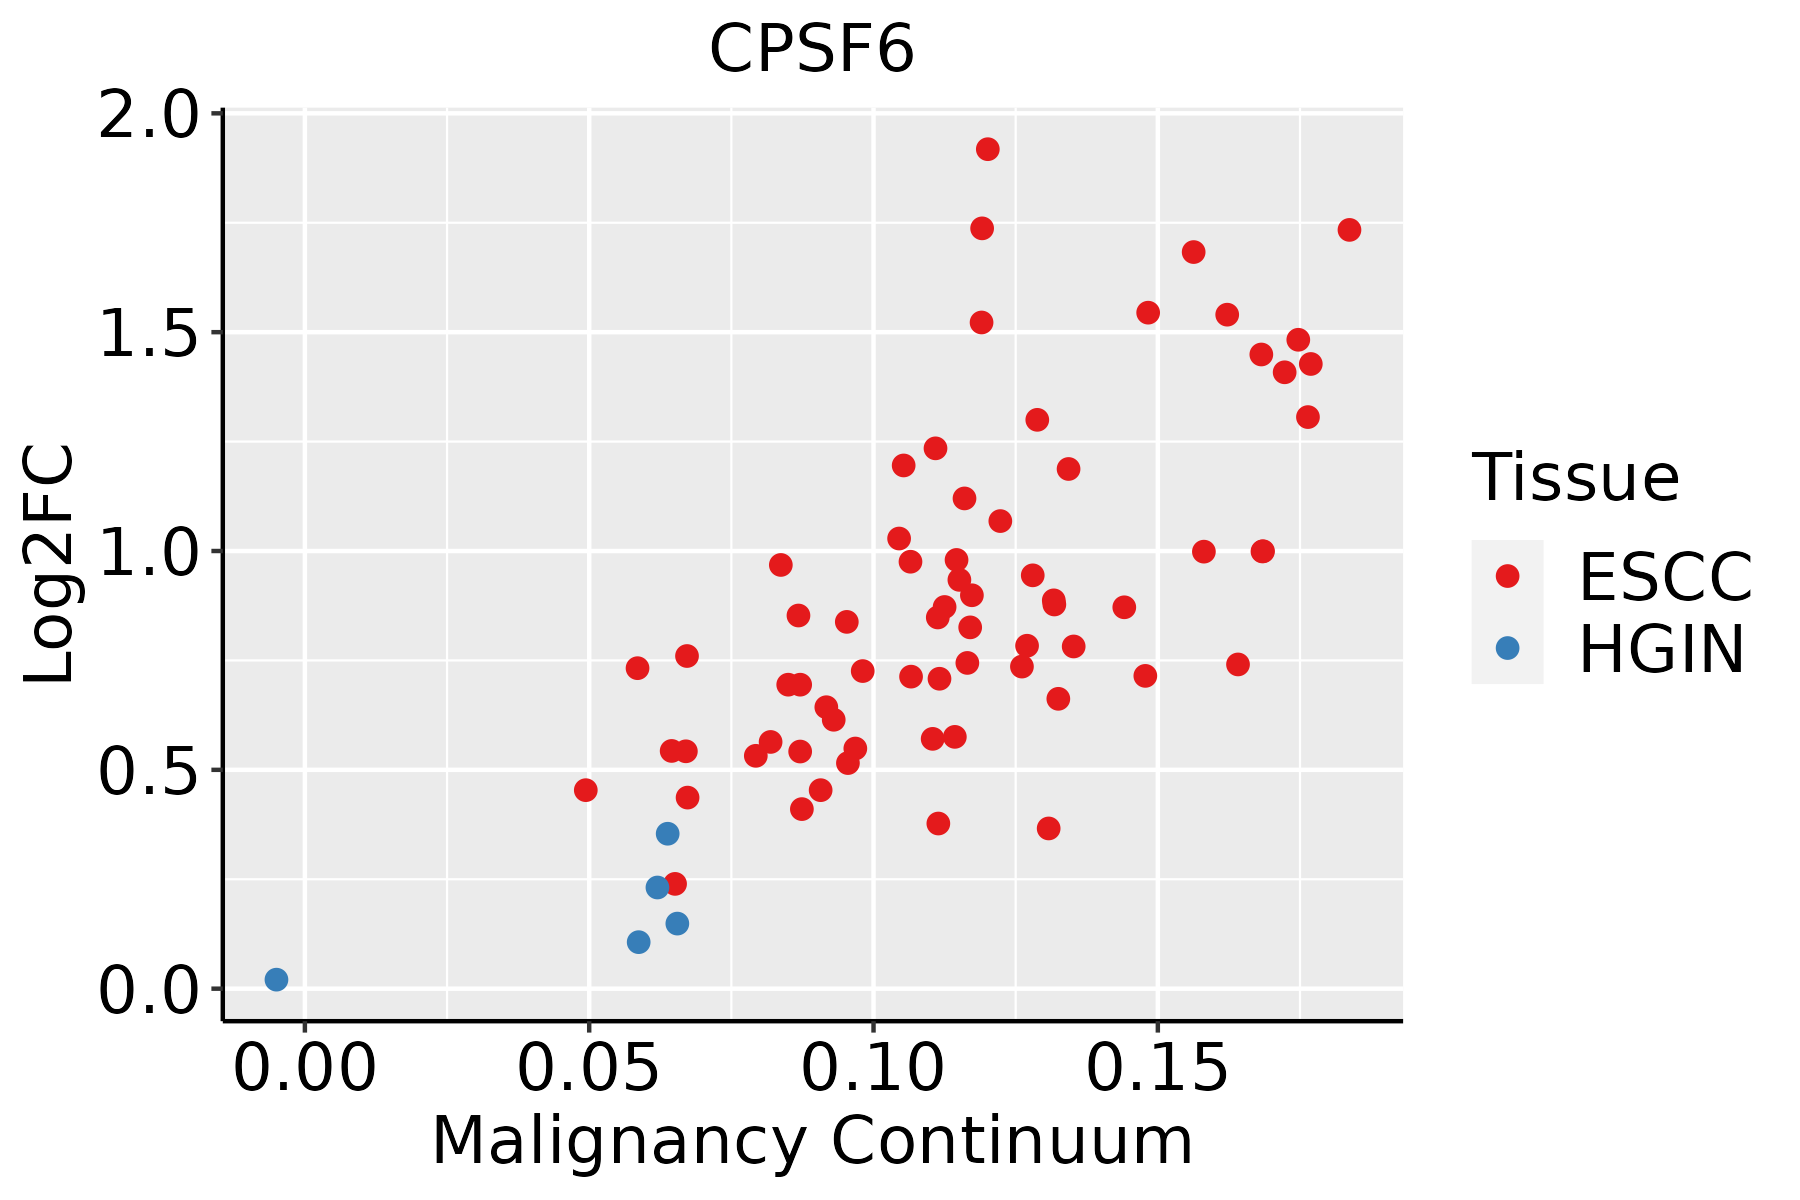 | ESCC: Esophageal squamous cell carcinoma |
| HGIN: High-grade intraepithelial neoplasias |
| LGIN: Low-grade intraepithelial neoplasias |
| Liver | 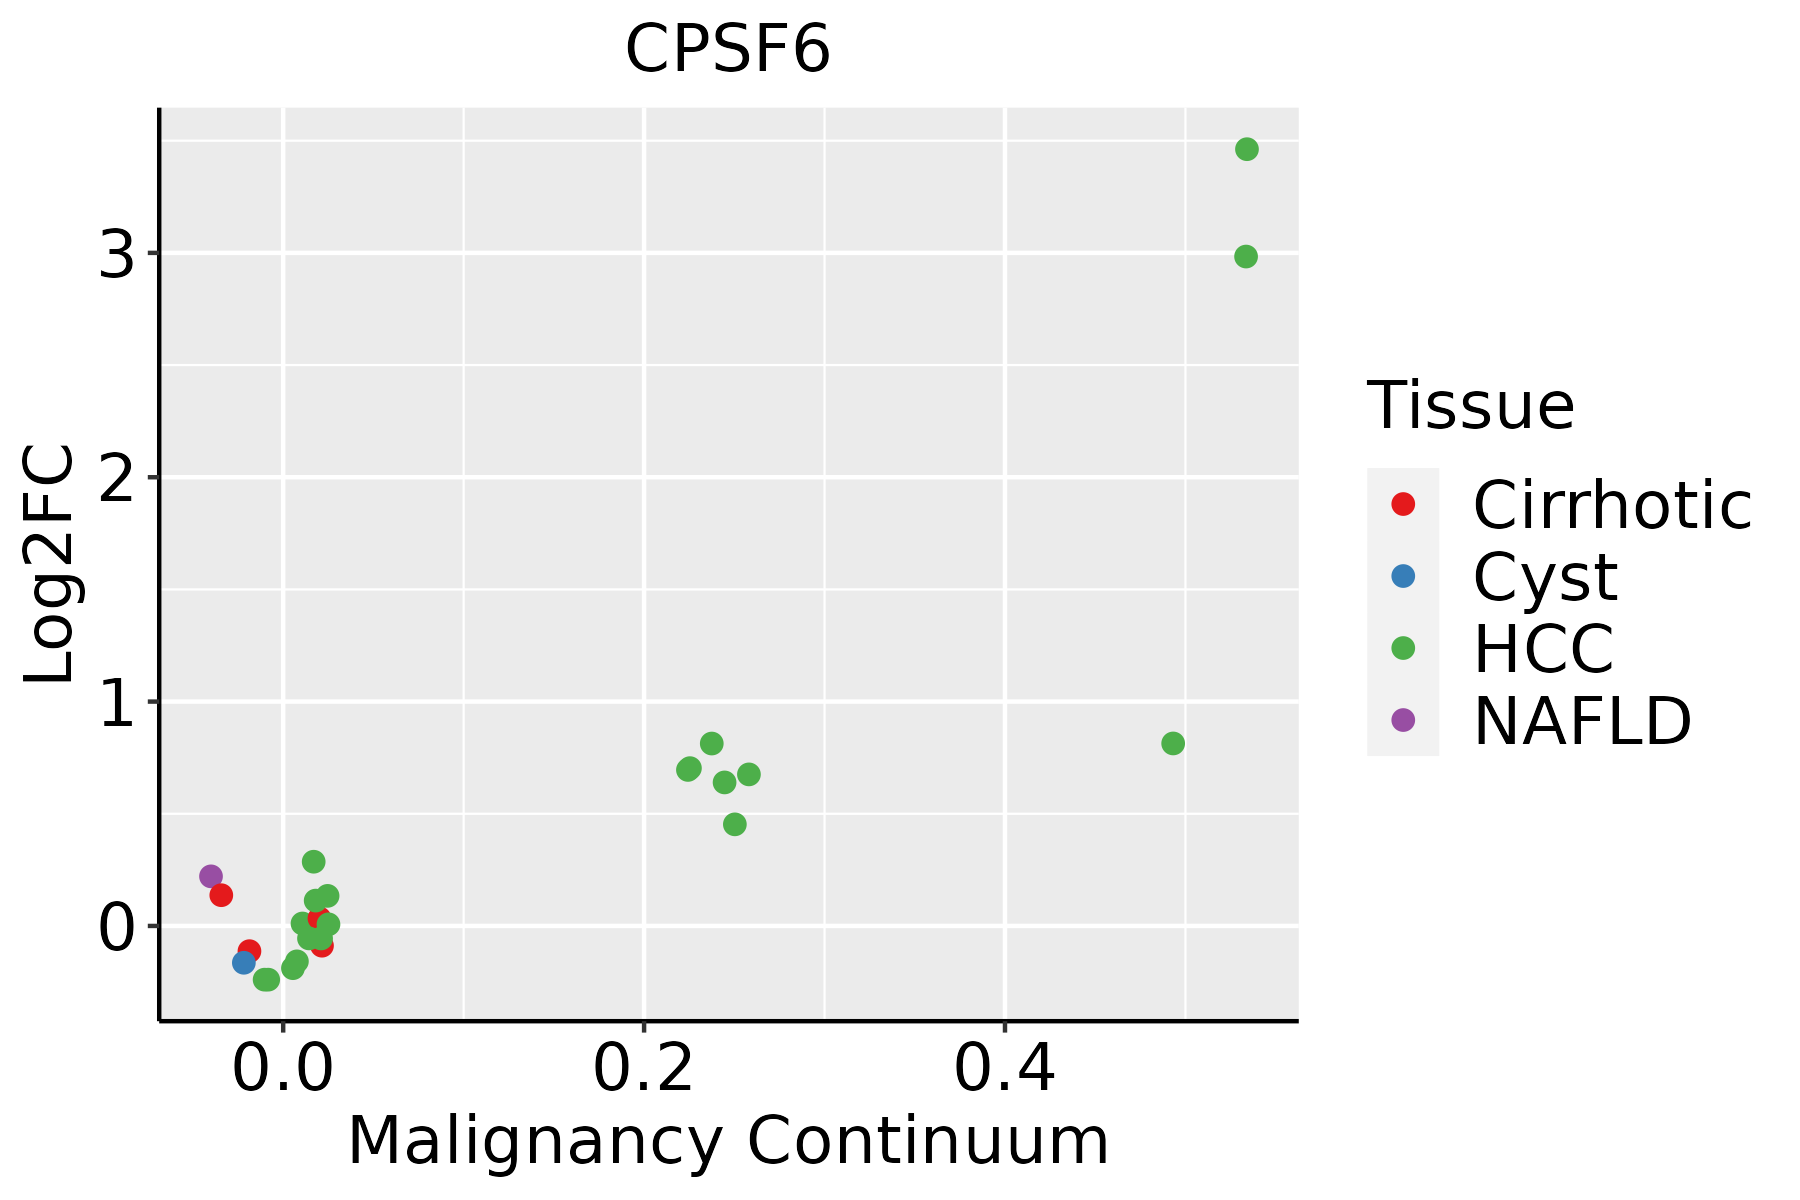 | HCC: Hepatocellular carcinoma |
| NAFLD: Non-alcoholic fatty liver disease |
| Lung | 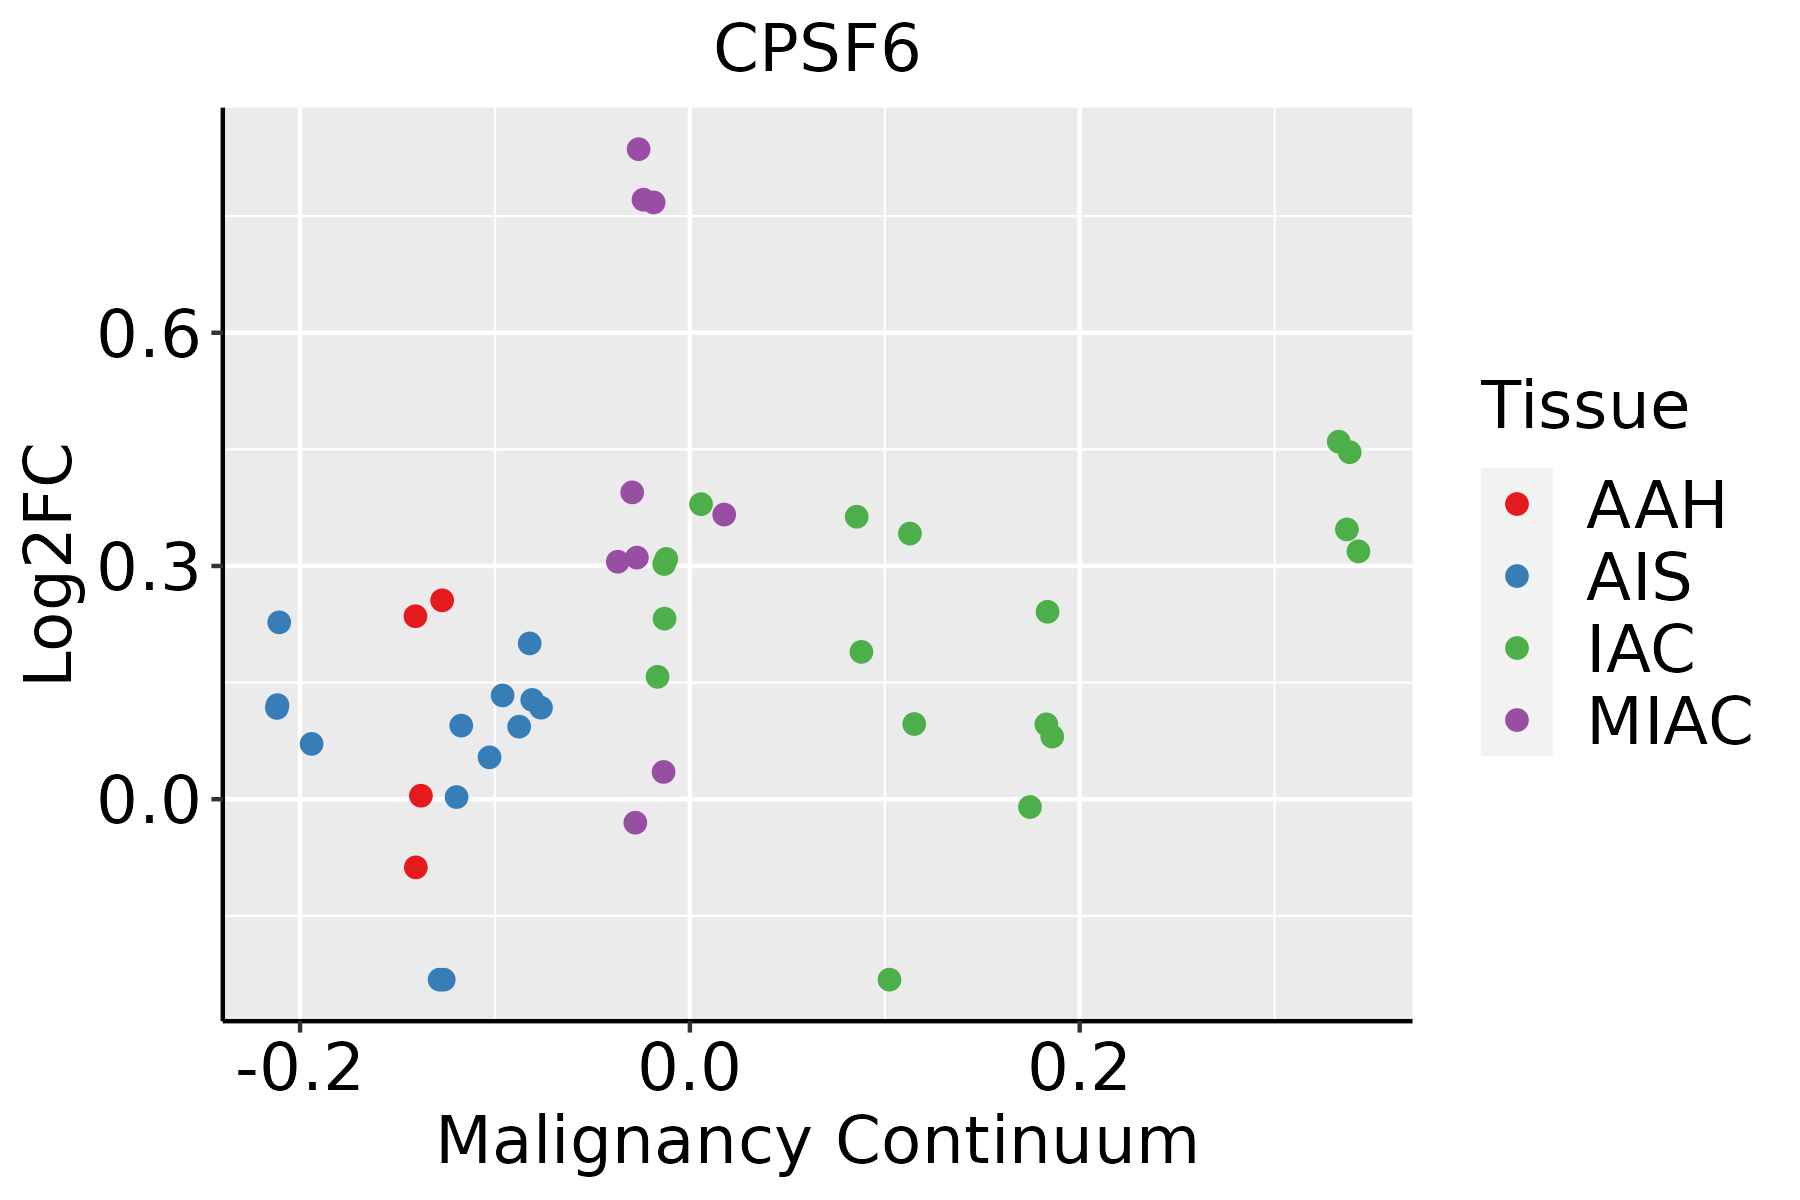 | AAH: Atypical adenomatous hyperplasia |
| AIS: Adenocarcinoma in situ |
| IAC: Invasive lung adenocarcinoma |
| MIA: Minimally invasive adenocarcinoma |
| Oral Cavity | 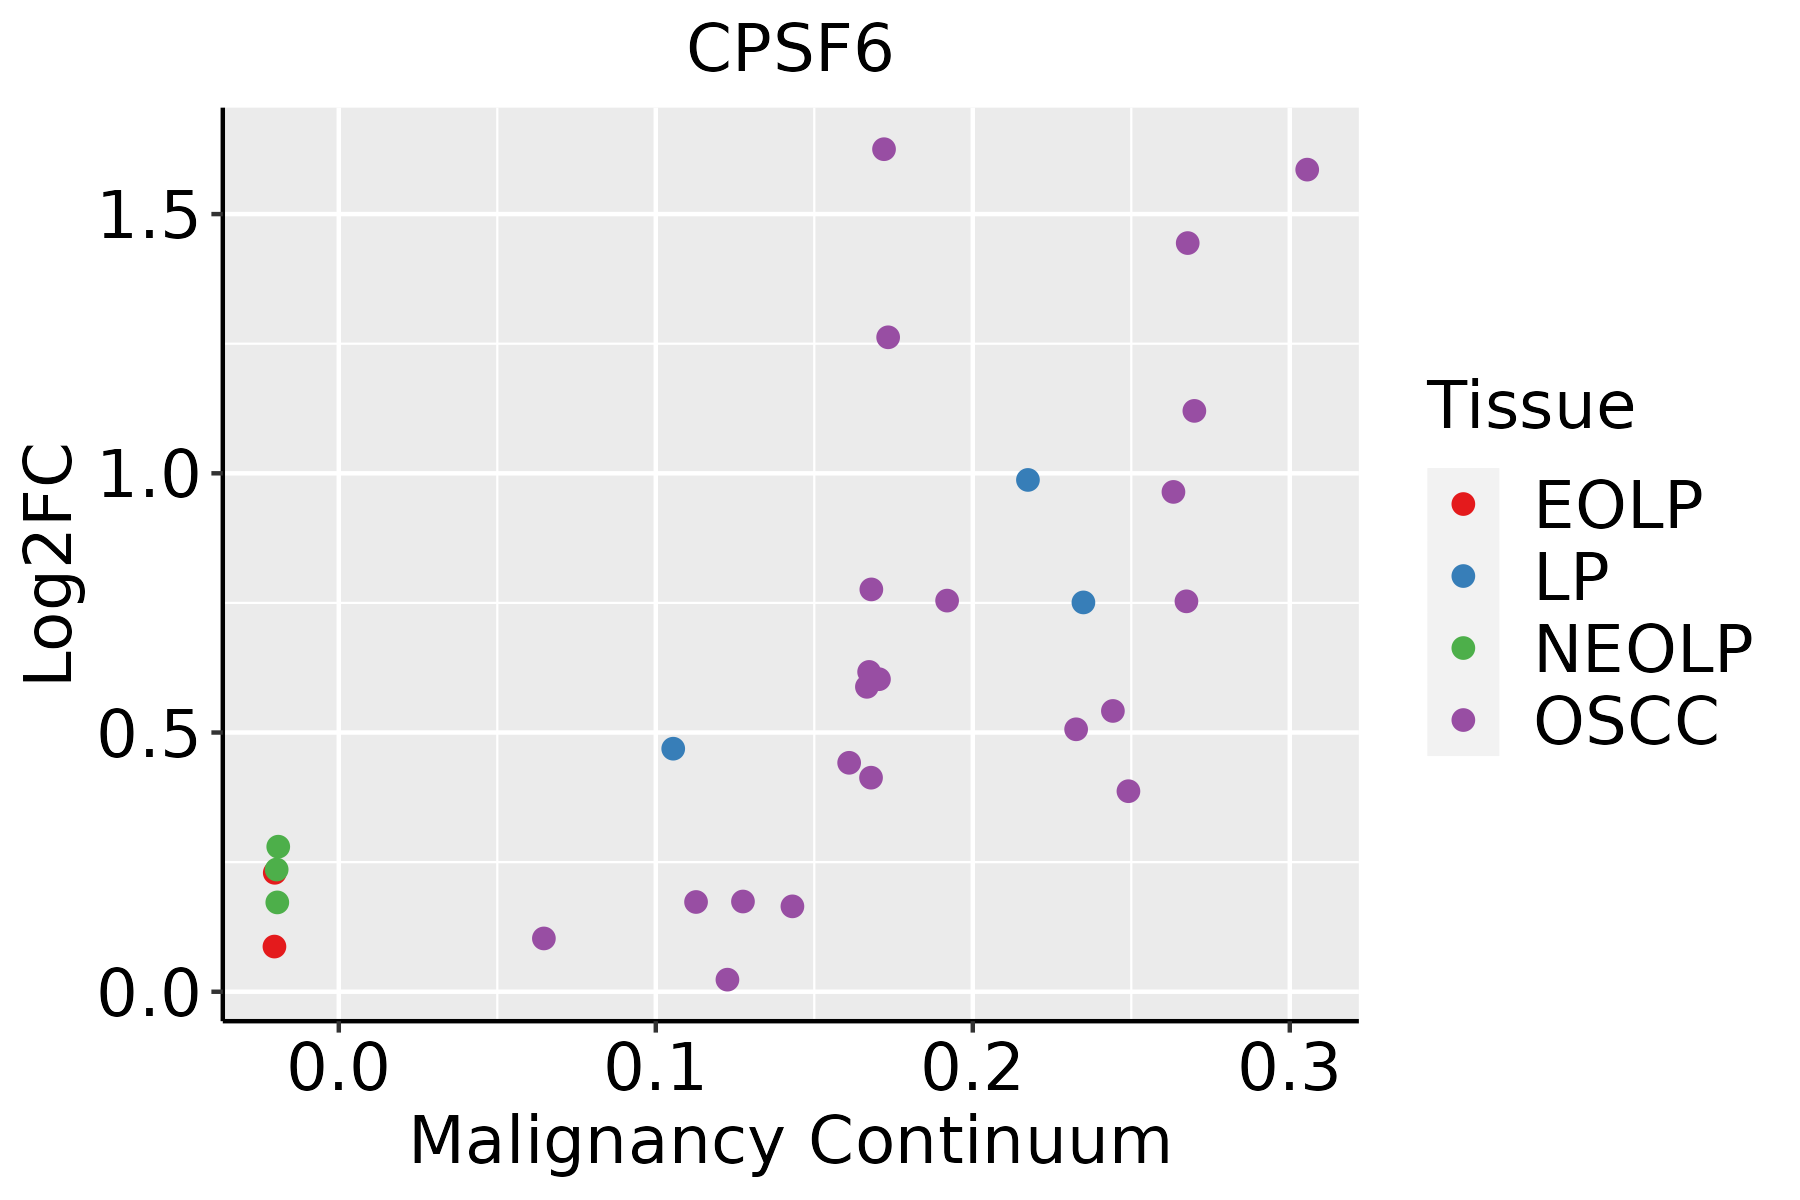 | EOLP: Erosive Oral lichen planus |
| LP: leukoplakia |
| NEOLP: Non-erosive oral lichen planus |
| OSCC: Oral squamous cell carcinoma |
| Prostate |  | BPH: Benign Prostatic Hyperplasia |
| Skin |  | AK: Actinic keratosis |
| cSCC: Cutaneous squamous cell carcinoma |
| SCCIS:squamous cell carcinoma in situ |
| Thyroid |  | ATC: Anaplastic thyroid cancer |
| HT: Hashimoto's thyroiditis |
| PTC: Papillary thyroid cancer |
| GO ID | Tissue | Disease Stage | Description | Gene Ratio | Bg Ratio | pvalue | p.adjust | Count |
| GO:002261327 | Esophagus | HGIN | ribonucleoprotein complex biogenesis | 158/2587 | 463/18723 | 2.61e-29 | 5.23e-26 | 158 |
| GO:007182627 | Esophagus | HGIN | ribonucleoprotein complex subunit organization | 84/2587 | 227/18723 | 1.34e-18 | 5.37e-16 | 84 |
| GO:002261827 | Esophagus | HGIN | ribonucleoprotein complex assembly | 82/2587 | 220/18723 | 2.07e-18 | 7.36e-16 | 82 |
| GO:190331120 | Esophagus | HGIN | regulation of mRNA metabolic process | 91/2587 | 288/18723 | 5.06e-15 | 9.78e-13 | 91 |
| GO:005068419 | Esophagus | HGIN | regulation of mRNA processing | 55/2587 | 137/18723 | 2.17e-14 | 3.94e-12 | 55 |
| GO:000640320 | Esophagus | HGIN | RNA localization | 66/2587 | 201/18723 | 4.06e-12 | 5.41e-10 | 66 |
| GO:000691319 | Esophagus | HGIN | nucleocytoplasmic transport | 83/2587 | 301/18723 | 2.14e-10 | 1.97e-08 | 83 |
| GO:005116919 | Esophagus | HGIN | nuclear transport | 83/2587 | 301/18723 | 2.14e-10 | 1.97e-08 | 83 |
| GO:005116819 | Esophagus | HGIN | nuclear export | 48/2587 | 154/18723 | 2.21e-08 | 1.34e-06 | 48 |
| GO:005065716 | Esophagus | HGIN | nucleic acid transport | 49/2587 | 163/18723 | 5.71e-08 | 3.06e-06 | 49 |
| GO:005065816 | Esophagus | HGIN | RNA transport | 49/2587 | 163/18723 | 5.71e-08 | 3.06e-06 | 49 |
| GO:005123616 | Esophagus | HGIN | establishment of RNA localization | 49/2587 | 166/18723 | 1.07e-07 | 5.47e-06 | 49 |
| GO:004682219 | Esophagus | HGIN | regulation of nucleocytoplasmic transport | 35/2587 | 106/18723 | 3.69e-07 | 1.69e-05 | 35 |
| GO:003238617 | Esophagus | HGIN | regulation of intracellular transport | 79/2587 | 337/18723 | 1.11e-06 | 4.36e-05 | 79 |
| GO:001593116 | Esophagus | HGIN | nucleobase-containing compound transport | 57/2587 | 222/18723 | 1.76e-06 | 6.52e-05 | 57 |
| GO:004682416 | Esophagus | HGIN | positive regulation of nucleocytoplasmic transport | 23/2587 | 62/18723 | 3.94e-06 | 1.32e-04 | 23 |
| GO:003238820 | Esophagus | HGIN | positive regulation of intracellular transport | 51/2587 | 202/18723 | 1.00e-05 | 2.92e-04 | 51 |
| GO:00064056 | Esophagus | HGIN | RNA export from nucleus | 23/2587 | 84/18723 | 7.90e-04 | 1.03e-02 | 23 |
| GO:00311243 | Esophagus | HGIN | mRNA 3'-end processing | 18/2587 | 62/18723 | 1.37e-03 | 1.61e-02 | 18 |
| GO:00314404 | Esophagus | HGIN | regulation of mRNA 3'-end processing | 10/2587 | 28/18723 | 3.04e-03 | 2.88e-02 | 10 |
| Pathway ID | Tissue | Disease Stage | Description | Gene Ratio | Bg Ratio | pvalue | p.adjust | qvalue | Count |
| hsa030159 | Esophagus | HGIN | mRNA surveillance pathway | 30/1383 | 97/8465 | 2.48e-04 | 2.69e-03 | 2.14e-03 | 30 |
| hsa0301514 | Esophagus | HGIN | mRNA surveillance pathway | 30/1383 | 97/8465 | 2.48e-04 | 2.69e-03 | 2.14e-03 | 30 |
| hsa032509 | Esophagus | ESCC | Viral life cycle - HIV-1 | 54/4205 | 63/8465 | 2.01e-09 | 2.17e-08 | 1.11e-08 | 54 |
| hsa0301524 | Esophagus | ESCC | mRNA surveillance pathway | 72/4205 | 97/8465 | 6.12e-07 | 4.10e-06 | 2.10e-06 | 72 |
| hsa0325014 | Esophagus | ESCC | Viral life cycle - HIV-1 | 54/4205 | 63/8465 | 2.01e-09 | 2.17e-08 | 1.11e-08 | 54 |
| hsa0301534 | Esophagus | ESCC | mRNA surveillance pathway | 72/4205 | 97/8465 | 6.12e-07 | 4.10e-06 | 2.10e-06 | 72 |
| hsa0301521 | Liver | HCC | mRNA surveillance pathway | 66/4020 | 97/8465 | 3.16e-05 | 1.88e-04 | 1.04e-04 | 66 |
| hsa032502 | Liver | HCC | Viral life cycle - HIV-1 | 46/4020 | 63/8465 | 3.25e-05 | 1.88e-04 | 1.04e-04 | 46 |
| hsa0301531 | Liver | HCC | mRNA surveillance pathway | 66/4020 | 97/8465 | 3.16e-05 | 1.88e-04 | 1.04e-04 | 66 |
| hsa0325011 | Liver | HCC | Viral life cycle - HIV-1 | 46/4020 | 63/8465 | 3.25e-05 | 1.88e-04 | 1.04e-04 | 46 |
| hsa030158 | Oral cavity | OSCC | mRNA surveillance pathway | 75/3704 | 97/8465 | 1.30e-11 | 2.01e-10 | 1.02e-10 | 75 |
| hsa032508 | Oral cavity | OSCC | Viral life cycle - HIV-1 | 45/3704 | 63/8465 | 7.62e-06 | 3.59e-05 | 1.83e-05 | 45 |
| hsa0301513 | Oral cavity | OSCC | mRNA surveillance pathway | 75/3704 | 97/8465 | 1.30e-11 | 2.01e-10 | 1.02e-10 | 75 |
| hsa0325013 | Oral cavity | OSCC | Viral life cycle - HIV-1 | 45/3704 | 63/8465 | 7.62e-06 | 3.59e-05 | 1.83e-05 | 45 |
| hsa0301523 | Oral cavity | LP | mRNA surveillance pathway | 50/2418 | 97/8465 | 1.39e-06 | 1.50e-05 | 9.66e-06 | 50 |
| hsa0325022 | Oral cavity | LP | Viral life cycle - HIV-1 | 32/2418 | 63/8465 | 1.55e-04 | 9.08e-04 | 5.86e-04 | 32 |
| hsa0301533 | Oral cavity | LP | mRNA surveillance pathway | 50/2418 | 97/8465 | 1.39e-06 | 1.50e-05 | 9.66e-06 | 50 |
| hsa0325031 | Oral cavity | LP | Viral life cycle - HIV-1 | 32/2418 | 63/8465 | 1.55e-04 | 9.08e-04 | 5.86e-04 | 32 |
| hsa0301541 | Oral cavity | EOLP | mRNA surveillance pathway | 30/1218 | 97/8465 | 2.26e-05 | 1.20e-04 | 7.07e-05 | 30 |
| hsa0325041 | Oral cavity | EOLP | Viral life cycle - HIV-1 | 16/1218 | 63/8465 | 1.46e-02 | 3.77e-02 | 2.22e-02 | 16 |
| Hugo Symbol | Variant Class | Variant Classification | dbSNP RS | HGVSc | HGVSp | HGVSp Short | SWISSPROT | BIOTYPE | SIFT | PolyPhen | Tumor Sample Barcode | Tissue | Histology | Sex | Age | Stage | Therapy Types | Drugs | Outcome |
| CPSF6 | SNV | Missense_Mutation | | c.1589N>A | p.Arg530Gln | p.R530Q | Q16630 | protein_coding | deleterious(0.02) | probably_damaging(0.947) | TCGA-A8-A09G-01 | Breast | breast invasive carcinoma | Female | >=65 | III/IV | Unknown | Unknown | SD |
| CPSF6 | SNV | Missense_Mutation | | c.1762N>T | p.Arg588Cys | p.R588C | Q16630 | protein_coding | deleterious_low_confidence(0) | benign(0.003) | TCGA-AN-A046-01 | Breast | breast invasive carcinoma | Female | >=65 | I/II | Unknown | Unknown | SD |
| CPSF6 | SNV | Missense_Mutation | | c.1735N>T | p.Arg579Cys | p.R579C | Q16630 | protein_coding | deleterious_low_confidence(0) | benign(0.003) | TCGA-D8-A1JN-01 | Breast | breast invasive carcinoma | Female | >=65 | III/IV | Hormone Therapy | anastrozolum | SD |
| CPSF6 | SNV | Missense_Mutation | | c.1552N>C | p.Glu518Gln | p.E518Q | Q16630 | protein_coding | tolerated(0.08) | possibly_damaging(0.78) | TCGA-GM-A2D9-01 | Breast | breast invasive carcinoma | Female | >=65 | I/II | Hormone Therapy | arimidex | SD |
| CPSF6 | deletion | Frame_Shift_Del | | c.326delN | p.Leu110TrpfsTer3 | p.L110Wfs*3 | Q16630 | protein_coding | | | TCGA-A8-A07R-01 | Breast | breast invasive carcinoma | Female | >=65 | III/IV | Ancillary | zoledronic | SD |
| CPSF6 | insertion | Frame_Shift_Ins | novel | c.1108_1109insTTAAGGTT | p.Pro370LeufsTer8 | p.P370Lfs*8 | Q16630 | protein_coding | | | TCGA-B6-A0IN-01 | Breast | breast invasive carcinoma | Female | <65 | I/II | Unknown | Unknown | PD |
| CPSF6 | insertion | Nonsense_Mutation | novel | c.1717_1718insAAGGCATTTGCAAGTTAATATATTAGAAATA | p.Arg573GlnfsTer9 | p.R573Qfs*9 | Q16630 | protein_coding | | | TCGA-BH-A0H0-01 | Breast | breast invasive carcinoma | Female | >=65 | I/II | Hormone Therapy | arimidex | SD |
| CPSF6 | SNV | Missense_Mutation | novel | c.404C>T | p.Ala135Val | p.A135V | Q16630 | protein_coding | tolerated(0.12) | benign(0.217) | TCGA-JW-AAVH-01 | Cervix | cervical & endocervical cancer | Female | <65 | I/II | Unknown | Unknown | SD |
| CPSF6 | SNV | Missense_Mutation | | c.1595N>C | p.Arg532Thr | p.R532T | Q16630 | protein_coding | deleterious(0) | probably_damaging(0.978) | TCGA-Q1-A73O-01 | Cervix | cervical & endocervical cancer | Female | <65 | I/II | Chemotherapy | cisplatin | CR |
| CPSF6 | SNV | Missense_Mutation | | c.1072N>T | p.Gly358Cys | p.G358C | Q16630 | protein_coding | tolerated(0.19) | probably_damaging(0.917) | TCGA-A6-6653-01 | Colorectum | colon adenocarcinoma | Male | >=65 | I/II | Unknown | Unknown | SD |


