
|
|||||
|
 | |
| |
| |
| |
| |
| |
|
Gene: CPSF4 |
Gene summary for CPSF4 |
| Gene information | Species | Human | Gene symbol | CPSF4 | Gene ID | 10898 |
| Gene name | cleavage and polyadenylation specific factor 4 | |
| Gene Alias | CPSF30 | |
| Cytomap | 7q22.1 | |
| Gene Type | protein-coding | GO ID | GO:0006139 | UniProtAcc | O95639 |
Top |
Malignant transformation analysis |
| Identification of the aberrant gene expression in precancerous and cancerous lesions by comparing the gene expression of stem-like cells in diseased tissues with normal stem cells |
| Entrez ID | Symbol | Replicates | Species | Organ | Tissue | Adj P-value | Log2FC | Malignancy |
| 10898 | CPSF4 | LZE7T | Human | Esophagus | ESCC | 2.32e-03 | 1.11e-01 | 0.0667 |
| 10898 | CPSF4 | LZE22T | Human | Esophagus | ESCC | 1.68e-02 | 1.45e-01 | 0.068 |
| 10898 | CPSF4 | LZE24T | Human | Esophagus | ESCC | 1.91e-06 | 5.87e-02 | 0.0596 |
| 10898 | CPSF4 | P1T-E | Human | Esophagus | ESCC | 1.72e-05 | 2.48e-01 | 0.0875 |
| 10898 | CPSF4 | P2T-E | Human | Esophagus | ESCC | 1.09e-34 | 5.49e-01 | 0.1177 |
| 10898 | CPSF4 | P4T-E | Human | Esophagus | ESCC | 5.20e-15 | 2.98e-01 | 0.1323 |
| 10898 | CPSF4 | P5T-E | Human | Esophagus | ESCC | 2.85e-08 | 2.40e-01 | 0.1327 |
| 10898 | CPSF4 | P8T-E | Human | Esophagus | ESCC | 4.55e-04 | 3.55e-02 | 0.0889 |
| 10898 | CPSF4 | P9T-E | Human | Esophagus | ESCC | 1.59e-08 | 1.61e-01 | 0.1131 |
| 10898 | CPSF4 | P10T-E | Human | Esophagus | ESCC | 1.54e-15 | 2.23e-01 | 0.116 |
| 10898 | CPSF4 | P11T-E | Human | Esophagus | ESCC | 7.83e-05 | 2.47e-01 | 0.1426 |
| 10898 | CPSF4 | P12T-E | Human | Esophagus | ESCC | 1.38e-19 | 4.30e-01 | 0.1122 |
| 10898 | CPSF4 | P15T-E | Human | Esophagus | ESCC | 1.98e-23 | 4.69e-01 | 0.1149 |
| 10898 | CPSF4 | P16T-E | Human | Esophagus | ESCC | 6.71e-16 | 3.24e-01 | 0.1153 |
| 10898 | CPSF4 | P17T-E | Human | Esophagus | ESCC | 6.68e-09 | 3.25e-01 | 0.1278 |
| 10898 | CPSF4 | P19T-E | Human | Esophagus | ESCC | 1.92e-04 | 2.97e-01 | 0.1662 |
| 10898 | CPSF4 | P20T-E | Human | Esophagus | ESCC | 3.99e-30 | 5.56e-01 | 0.1124 |
| 10898 | CPSF4 | P21T-E | Human | Esophagus | ESCC | 1.23e-11 | 2.02e-01 | 0.1617 |
| 10898 | CPSF4 | P22T-E | Human | Esophagus | ESCC | 1.24e-08 | 1.70e-01 | 0.1236 |
| 10898 | CPSF4 | P23T-E | Human | Esophagus | ESCC | 2.03e-22 | 4.84e-01 | 0.108 |
| Page: 1 2 3 4 5 |
| Tissue | Expression Dynamics | Abbreviation |
| Esophagus | 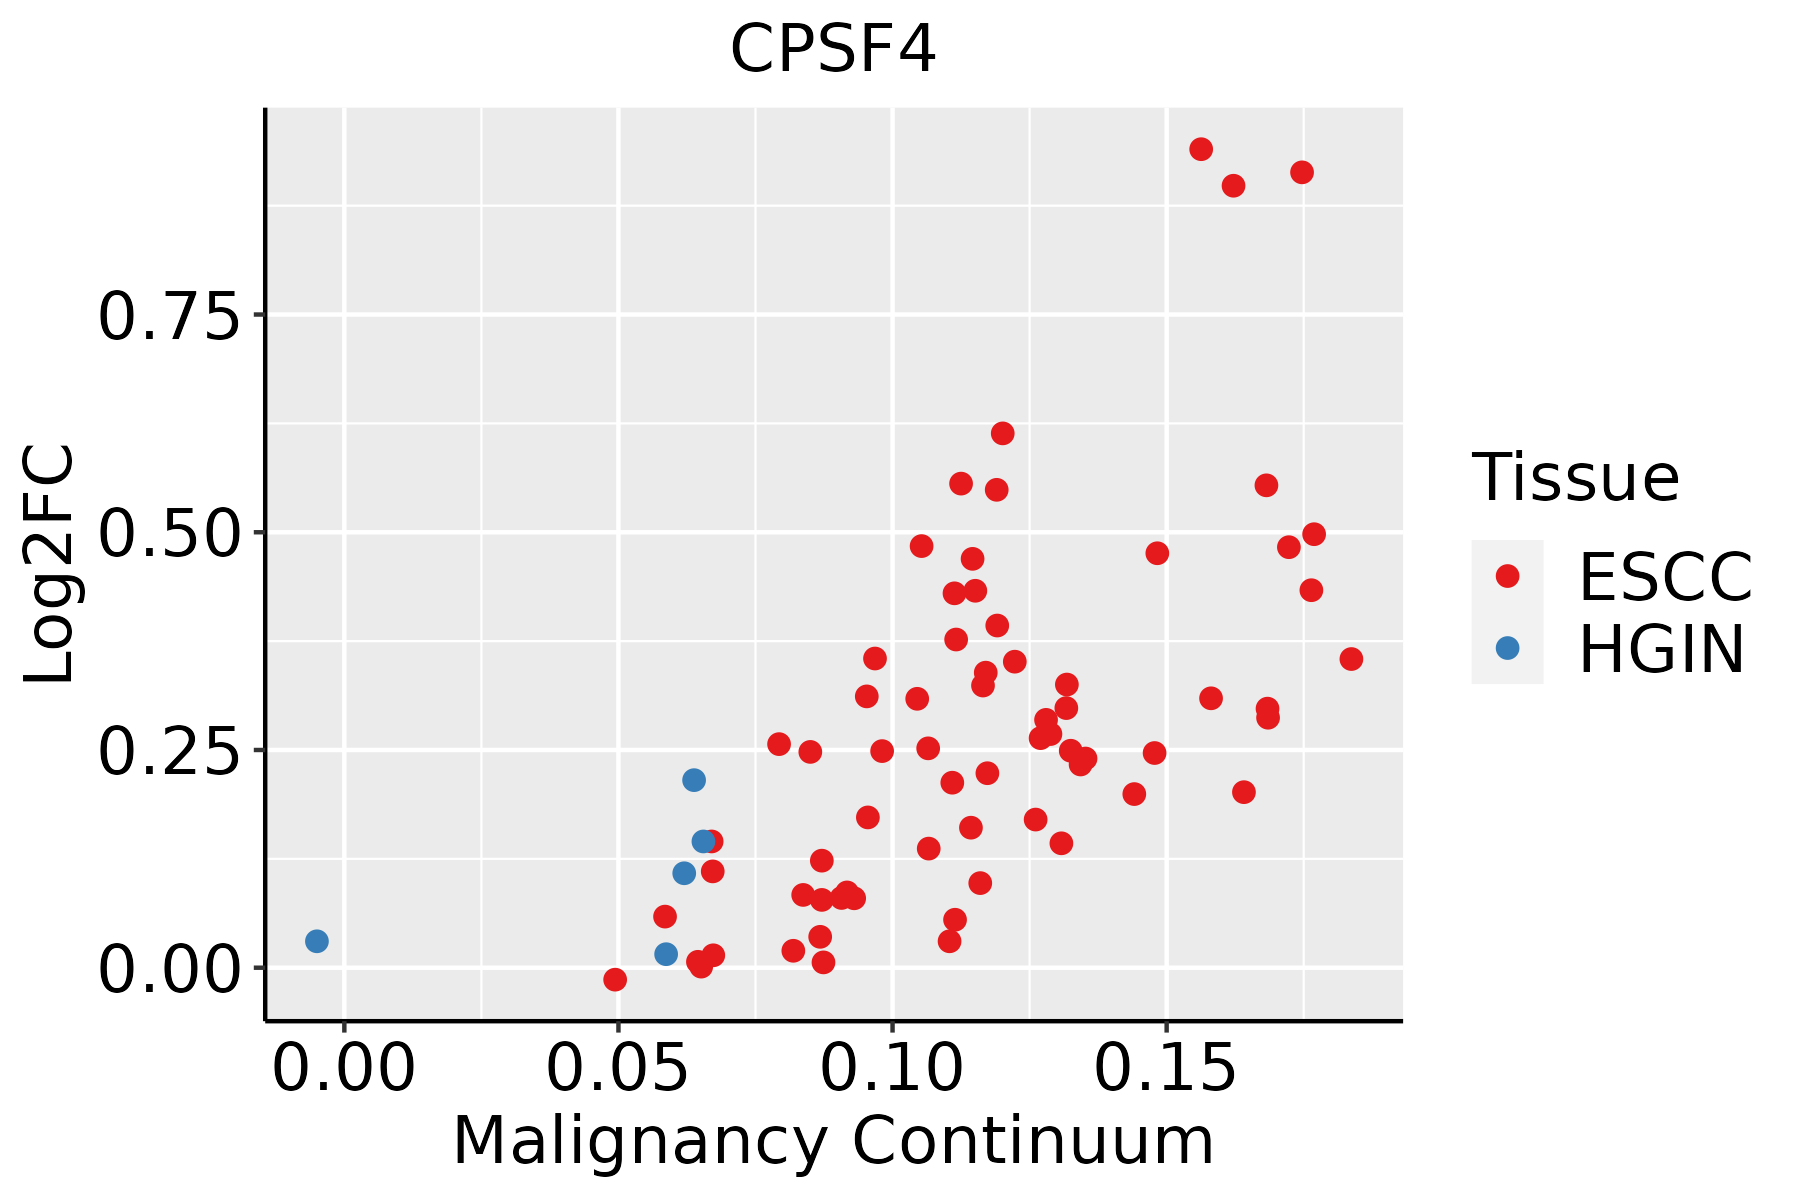 | ESCC: Esophageal squamous cell carcinoma |
| HGIN: High-grade intraepithelial neoplasias | ||
| LGIN: Low-grade intraepithelial neoplasias | ||
| Liver | 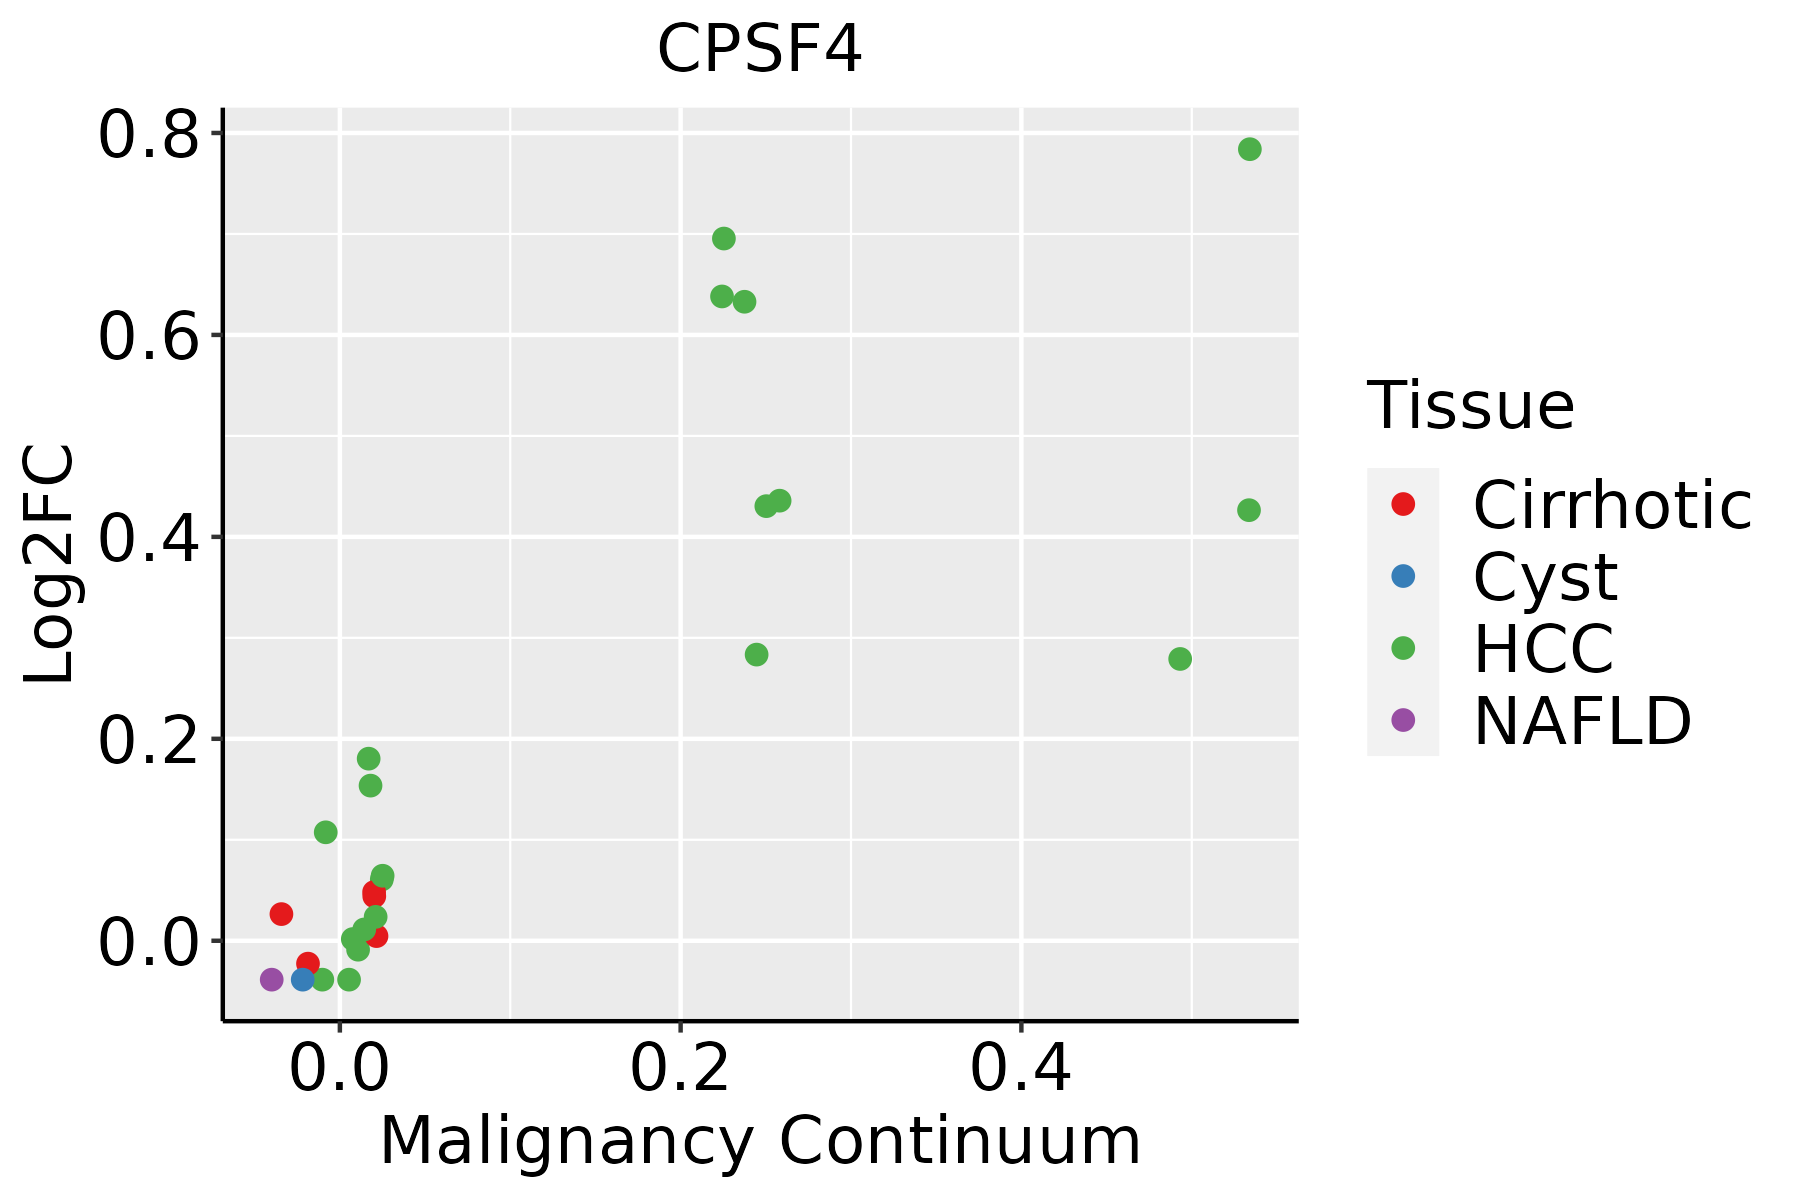 | HCC: Hepatocellular carcinoma |
| NAFLD: Non-alcoholic fatty liver disease | ||
| Oral Cavity |  | EOLP: Erosive Oral lichen planus |
| LP: leukoplakia | ||
| NEOLP: Non-erosive oral lichen planus | ||
| OSCC: Oral squamous cell carcinoma | ||
| Thyroid | 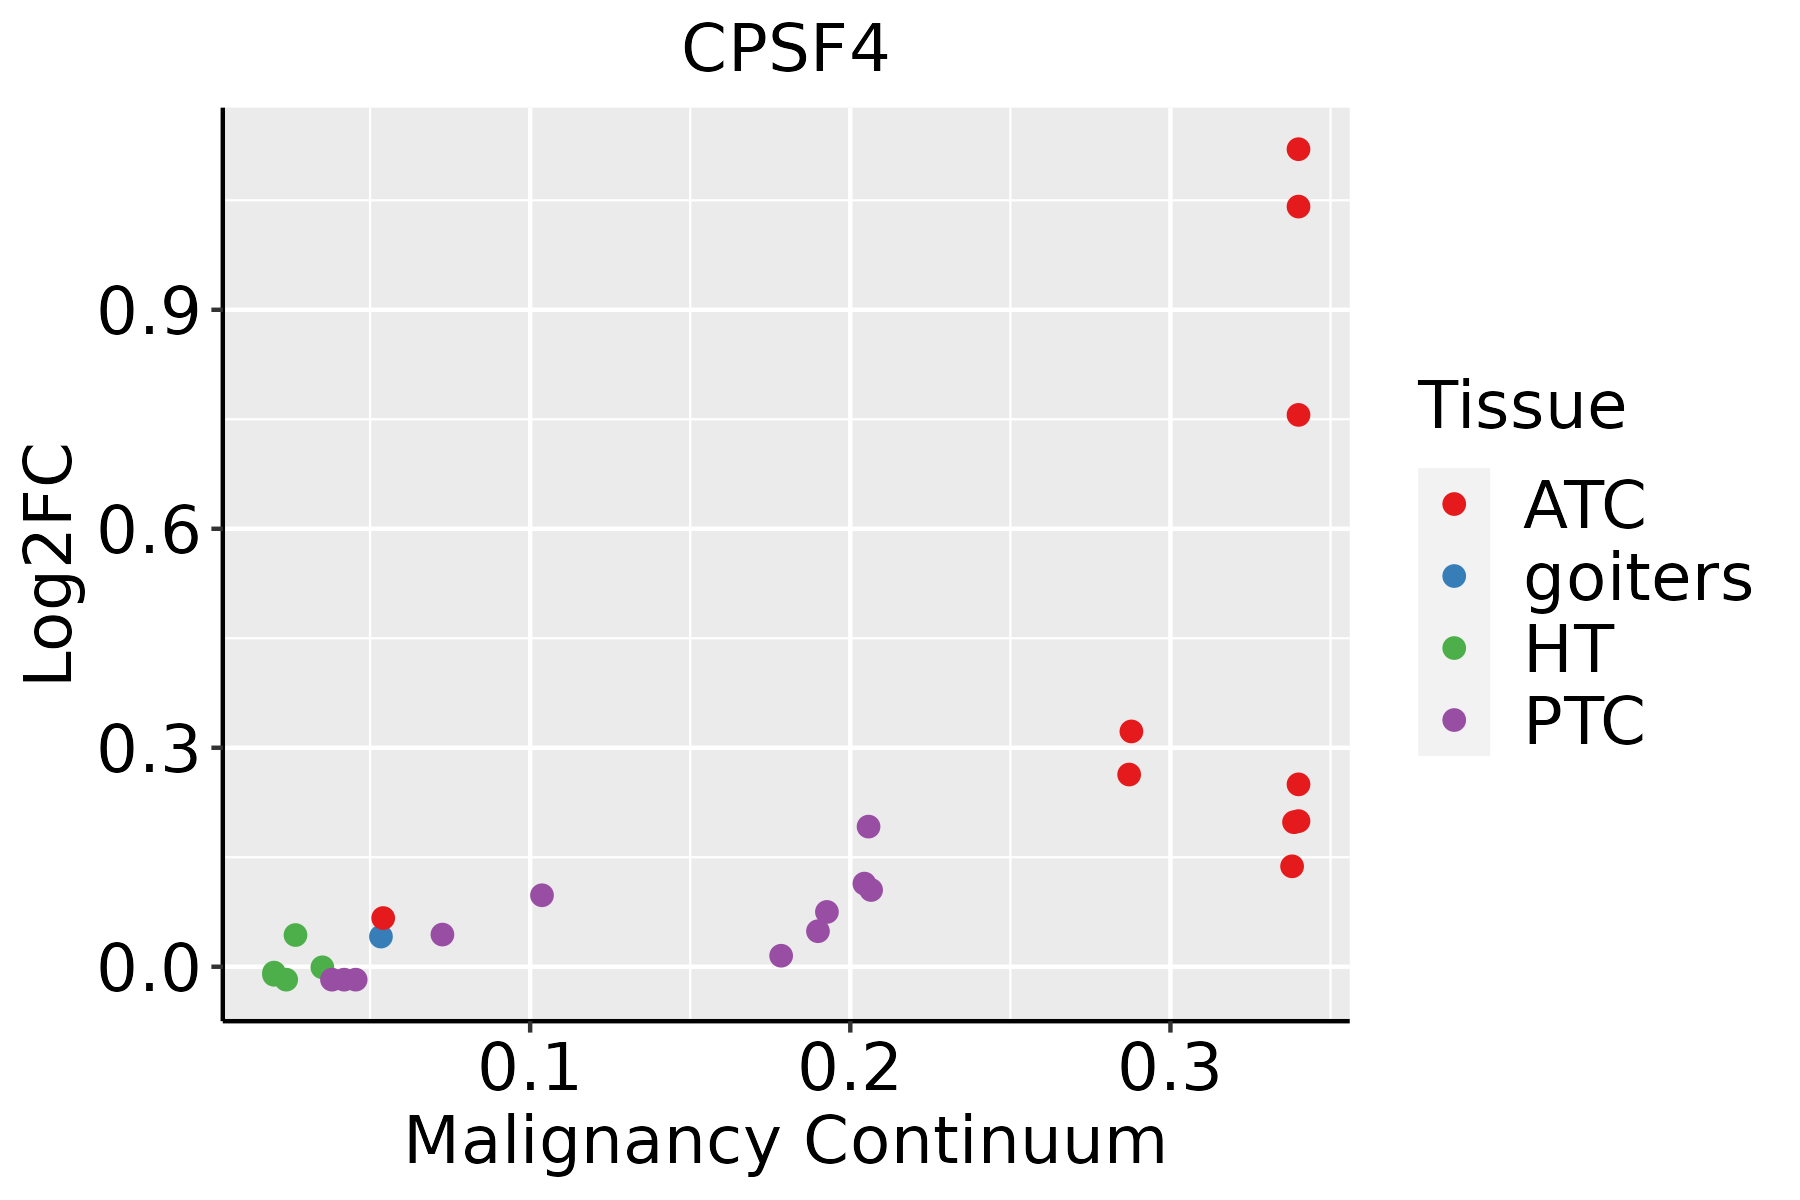 | ATC: Anaplastic thyroid cancer |
| HT: Hashimoto's thyroiditis | ||
| PTC: Papillary thyroid cancer |
| ∗log2FC in expression of this searched gene in stem-like cells from each diseased tissue sample relative to stem-like cells in normal samples in each tissue plotted against the malignancy continuum. Samples are colored based on if they are from different disease stage. |
Top |
Malignant transformation related pathway analysis |
| Find out the enriched GO biological processes and KEGG pathways involved in transition from healthy to precancer to cancer |
| Tissue | Disease Stage | Enriched GO biological Processes |
| Colorectum | AD |  |
| Colorectum | SER |  |
| Colorectum | MSS |  |
| Colorectum | MSI-H |  |
| Colorectum | FAP |  |
| ∗Top 15 enriched GO BP terms are showed in the bar plot of each disease state in each tissue. Each row represents a significant GO biological process which is colored according to the -log10(p.adjust). |
| Page: 1 2 3 4 5 6 7 8 9 |
| GO ID | Tissue | Disease Stage | Description | Gene Ratio | Bg Ratio | pvalue | p.adjust | Count |
| GO:00905013 | Esophagus | ESCC | RNA phosphodiester bond hydrolysis | 110/8552 | 152/18723 | 1.95e-11 | 6.81e-10 | 110 |
| GO:00903053 | Esophagus | ESCC | nucleic acid phosphodiester bond hydrolysis | 163/8552 | 261/18723 | 3.07e-08 | 5.73e-07 | 163 |
| GO:003112412 | Esophagus | ESCC | mRNA 3'-end processing | 47/8552 | 62/18723 | 1.29e-06 | 1.58e-05 | 47 |
| GO:00311233 | Esophagus | ESCC | RNA 3'-end processing | 76/8552 | 116/18723 | 1.25e-05 | 1.15e-04 | 76 |
| GO:00063793 | Esophagus | ESCC | mRNA cleavage | 17/8552 | 22/18723 | 2.60e-03 | 1.11e-02 | 17 |
| GO:00987872 | Esophagus | ESCC | mRNA cleavage involved in mRNA processing | 11/8552 | 14/18723 | 1.30e-02 | 4.27e-02 | 11 |
| GO:00311241 | Liver | HCC | mRNA 3'-end processing | 50/7958 | 62/18723 | 8.44e-10 | 2.60e-08 | 50 |
| GO:00905011 | Liver | HCC | RNA phosphodiester bond hydrolysis | 101/7958 | 152/18723 | 1.99e-09 | 5.63e-08 | 101 |
| GO:00311231 | Liver | HCC | RNA 3'-end processing | 81/7958 | 116/18723 | 2.27e-09 | 6.32e-08 | 81 |
| GO:0090305 | Liver | HCC | nucleic acid phosphodiester bond hydrolysis | 152/7958 | 261/18723 | 1.90e-07 | 3.46e-06 | 152 |
| GO:0006379 | Liver | HCC | mRNA cleavage | 17/7958 | 22/18723 | 9.84e-04 | 5.70e-03 | 17 |
| GO:0098789 | Liver | HCC | pre-mRNA cleavage required for polyadenylation | 11/7958 | 13/18723 | 2.38e-03 | 1.16e-02 | 11 |
| GO:0098787 | Liver | HCC | mRNA cleavage involved in mRNA processing | 11/7958 | 14/18723 | 6.81e-03 | 2.73e-02 | 11 |
| GO:00311242 | Oral cavity | OSCC | mRNA 3'-end processing | 49/7305 | 62/18723 | 1.40e-10 | 4.14e-09 | 49 |
| GO:00905012 | Oral cavity | OSCC | RNA phosphodiester bond hydrolysis | 95/7305 | 152/18723 | 3.65e-09 | 8.22e-08 | 95 |
| GO:00311232 | Oral cavity | OSCC | RNA 3'-end processing | 75/7305 | 116/18723 | 1.93e-08 | 3.79e-07 | 75 |
| GO:00903052 | Oral cavity | OSCC | nucleic acid phosphodiester bond hydrolysis | 142/7305 | 261/18723 | 2.90e-07 | 4.43e-06 | 142 |
| GO:00063792 | Oral cavity | OSCC | mRNA cleavage | 18/7305 | 22/18723 | 5.05e-05 | 4.23e-04 | 18 |
| GO:00987871 | Oral cavity | OSCC | mRNA cleavage involved in mRNA processing | 12/7305 | 14/18723 | 4.62e-04 | 2.76e-03 | 12 |
| GO:00987892 | Oral cavity | OSCC | pre-mRNA cleavage required for polyadenylation | 11/7305 | 13/18723 | 1.02e-03 | 5.29e-03 | 11 |
| Page: 1 2 |
| Pathway ID | Tissue | Disease Stage | Description | Gene Ratio | Bg Ratio | pvalue | p.adjust | qvalue | Count |
| hsa0516425 | Esophagus | ESCC | Influenza A | 122/4205 | 171/8465 | 5.01e-09 | 4.79e-08 | 2.45e-08 | 122 |
| hsa0301524 | Esophagus | ESCC | mRNA surveillance pathway | 72/4205 | 97/8465 | 6.12e-07 | 4.10e-06 | 2.10e-06 | 72 |
| hsa0516435 | Esophagus | ESCC | Influenza A | 122/4205 | 171/8465 | 5.01e-09 | 4.79e-08 | 2.45e-08 | 122 |
| hsa0301534 | Esophagus | ESCC | mRNA surveillance pathway | 72/4205 | 97/8465 | 6.12e-07 | 4.10e-06 | 2.10e-06 | 72 |
| hsa0301521 | Liver | HCC | mRNA surveillance pathway | 66/4020 | 97/8465 | 3.16e-05 | 1.88e-04 | 1.04e-04 | 66 |
| hsa0516421 | Liver | HCC | Influenza A | 101/4020 | 171/8465 | 1.41e-03 | 5.07e-03 | 2.82e-03 | 101 |
| hsa0301531 | Liver | HCC | mRNA surveillance pathway | 66/4020 | 97/8465 | 3.16e-05 | 1.88e-04 | 1.04e-04 | 66 |
| hsa0516431 | Liver | HCC | Influenza A | 101/4020 | 171/8465 | 1.41e-03 | 5.07e-03 | 2.82e-03 | 101 |
| hsa030158 | Oral cavity | OSCC | mRNA surveillance pathway | 75/3704 | 97/8465 | 1.30e-11 | 2.01e-10 | 1.02e-10 | 75 |
| hsa0516418 | Oral cavity | OSCC | Influenza A | 116/3704 | 171/8465 | 1.23e-10 | 1.78e-09 | 9.08e-10 | 116 |
| hsa0301513 | Oral cavity | OSCC | mRNA surveillance pathway | 75/3704 | 97/8465 | 1.30e-11 | 2.01e-10 | 1.02e-10 | 75 |
| hsa0516419 | Oral cavity | OSCC | Influenza A | 116/3704 | 171/8465 | 1.23e-10 | 1.78e-09 | 9.08e-10 | 116 |
| hsa0516424 | Oral cavity | LP | Influenza A | 80/2418 | 171/8465 | 2.56e-07 | 3.41e-06 | 2.20e-06 | 80 |
| hsa0301523 | Oral cavity | LP | mRNA surveillance pathway | 50/2418 | 97/8465 | 1.39e-06 | 1.50e-05 | 9.66e-06 | 50 |
| hsa0516434 | Oral cavity | LP | Influenza A | 80/2418 | 171/8465 | 2.56e-07 | 3.41e-06 | 2.20e-06 | 80 |
| hsa0301533 | Oral cavity | LP | mRNA surveillance pathway | 50/2418 | 97/8465 | 1.39e-06 | 1.50e-05 | 9.66e-06 | 50 |
| Page: 1 |
Top |
Cell-cell communication analysis |
| Identification of potential cell-cell interactions between two cell types and their ligand-receptor pairs for different disease states |
| Ligand | Receptor | LRpair | Pathway | Tissue | Disease Stage |
| Page: 1 |
Top |
Single-cell gene regulatory network inference analysis |
| Find out the significant the regulons (TFs) and the target genes of each regulon across cell types for different disease states |
| TF | Cell Type | Tissue | Disease Stage | Target Gene | RSS | Regulon Activity |
| CPSF4 | PERI | Colorectum | ADJ | RGL2,TRIM65,KCTD20, etc. | 4.27e-02 |  |
| CPSF4 | INCAF | Pancreas | Healthy | PROX1,FAM117B,GEN1, etc. | 1.81e-02 |  |
| ∗The dot plots of a searched regulon are shown for all cell subpopulations in each disease state of each tissue based on the regulon specific score inferred using pySCENIC and by calculating the average expression. |
| Page: 1 |
Top |
Somatic mutation of malignant transformation related genes |
| Annotation of somatic variants for genes involved in malignant transformation |
| Hugo Symbol | Variant Class | Variant Classification | dbSNP RS | HGVSc | HGVSp | HGVSp Short | SWISSPROT | BIOTYPE | SIFT | PolyPhen | Tumor Sample Barcode | Tissue | Histology | Sex | Age | Stage | Therapy Types | Drugs | Outcome |
| CPSF4 | SNV | Missense_Mutation | c.296N>C | p.Tyr99Ser | p.Y99S | O95639 | protein_coding | deleterious(0) | probably_damaging(0.944) | TCGA-A2-A04U-01 | Breast | breast invasive carcinoma | Female | <65 | I/II | Chemotherapy | adriamycin | SD | |
| CPSF4 | SNV | Missense_Mutation | c.763N>A | p.Ala255Thr | p.A255T | O95639 | protein_coding | deleterious(0.02) | probably_damaging(0.998) | TCGA-A7-A0CD-01 | Breast | breast invasive carcinoma | Female | >=65 | I/II | Hormone Therapy | arimidex | SD | |
| CPSF4 | SNV | Missense_Mutation | rs200506342 | c.503N>A | p.Arg168Gln | p.R168Q | O95639 | protein_coding | tolerated(0.11) | possibly_damaging(0.541) | TCGA-A8-A06Q-01 | Breast | breast invasive carcinoma | Female | <65 | III/IV | Unknown | Unknown | SD |
| CPSF4 | SNV | Missense_Mutation | rs201226770 | c.148G>A | p.Gly50Ser | p.G50S | O95639 | protein_coding | tolerated(0.71) | benign(0.003) | TCGA-PL-A8LV-01 | Breast | breast invasive carcinoma | Female | <65 | III/IV | Unknown | Unknown | SD |
| CPSF4 | SNV | Missense_Mutation | c.49A>G | p.Ile17Val | p.I17V | O95639 | protein_coding | tolerated(0.62) | benign(0) | TCGA-FU-A3HZ-01 | Cervix | cervical & endocervical cancer | Female | <65 | I/II | Chemotherapy | cisplatin | CR | |
| CPSF4 | SNV | Missense_Mutation | rs766880581 | c.40N>A | p.Asp14Asn | p.D14N | O95639 | protein_coding | tolerated(0.06) | benign(0.077) | TCGA-IR-A3LB-01 | Cervix | cervical & endocervical cancer | Female | <65 | I/II | Chemotherapy | cisplatin | PD |
| CPSF4 | SNV | Missense_Mutation | novel | c.358N>C | p.Lys120Gln | p.K120Q | O95639 | protein_coding | deleterious(0.01) | probably_damaging(0.957) | TCGA-MA-AA42-01 | Cervix | cervical & endocervical cancer | Female | >=65 | I/II | Unknown | Unknown | SD |
| CPSF4 | SNV | Missense_Mutation | c.296A>G | p.Tyr99Cys | p.Y99C | O95639 | protein_coding | deleterious(0) | benign(0.366) | TCGA-AA-3710-01 | Colorectum | colon adenocarcinoma | Female | >=65 | I/II | Unknown | Unknown | SD | |
| CPSF4 | SNV | Missense_Mutation | novel | c.270N>T | p.Met90Ile | p.M90I | O95639 | protein_coding | tolerated(0.08) | benign(0.022) | TCGA-AA-A00N-01 | Colorectum | colon adenocarcinoma | Male | >=65 | I/II | Unknown | Unknown | PD |
| CPSF4 | SNV | Missense_Mutation | c.217N>T | p.Arg73Cys | p.R73C | O95639 | protein_coding | deleterious(0) | probably_damaging(1) | TCGA-G4-6306-01 | Colorectum | colon adenocarcinoma | Male | >=65 | I/II | Unknown | Unknown | SD |
| Page: 1 2 3 |
Top |
Related drugs of malignant transformation related genes |
| Identification of chemicals and drugs interact with genes involved in malignant transfromation |
| (DGIdb 4.0) |
| Entrez ID | Symbol | Category | Interaction Types | Drug Claim Name | Drug Name | PMIDs |
| Page: 1 |

Copyright 2023-Present -The University of Texas Health Science Center at Houston |