
|
|||||
|
 | |
| |
| |
| |
| |
| |
|
Gene: CPQ |
Gene summary for CPQ |
| Gene information | Species | Human | Gene symbol | CPQ | Gene ID | 10404 |
| Gene name | carboxypeptidase Q | |
| Gene Alias | LDP | |
| Cytomap | 8q22.1 | |
| Gene Type | protein-coding | GO ID | GO:0006508 | UniProtAcc | A0A024R9B8 |
Top |
Malignant transformation analysis |
| Identification of the aberrant gene expression in precancerous and cancerous lesions by comparing the gene expression of stem-like cells in diseased tissues with normal stem cells |
| Entrez ID | Symbol | Replicates | Species | Organ | Tissue | Adj P-value | Log2FC | Malignancy |
| 10404 | CPQ | HTA11_1938_2000001011 | Human | Colorectum | AD | 7.00e-05 | 4.72e-01 | -0.0811 |
| 10404 | CPQ | HTA11_347_2000001011 | Human | Colorectum | AD | 5.55e-12 | 5.59e-01 | -0.1954 |
| 10404 | CPQ | HTA11_411_2000001011 | Human | Colorectum | SER | 6.76e-03 | 6.79e-01 | -0.2602 |
| 10404 | CPQ | HTA11_696_2000001011 | Human | Colorectum | AD | 6.86e-06 | 4.65e-01 | -0.1464 |
| 10404 | CPQ | HTA11_2992_2000001011 | Human | Colorectum | SER | 2.83e-07 | 8.74e-01 | -0.1706 |
| 10404 | CPQ | HTA11_5212_2000001011 | Human | Colorectum | AD | 5.87e-08 | 8.04e-01 | -0.2061 |
| 10404 | CPQ | HTA11_5216_2000001011 | Human | Colorectum | SER | 2.05e-03 | 9.05e-01 | -0.1462 |
| 10404 | CPQ | HTA11_546_2000001011 | Human | Colorectum | AD | 9.56e-03 | 5.00e-01 | -0.0842 |
| 10404 | CPQ | HTA11_866_3004761011 | Human | Colorectum | AD | 2.27e-02 | -1.72e-01 | 0.096 |
| 10404 | CPQ | HTA11_7696_3000711011 | Human | Colorectum | AD | 4.82e-07 | -3.21e-01 | 0.0674 |
| 10404 | CPQ | HTA11_99999970781_79442 | Human | Colorectum | MSS | 4.53e-04 | -1.55e-01 | 0.294 |
| 10404 | CPQ | A002-C-010 | Human | Colorectum | FAP | 1.80e-13 | -3.53e-01 | 0.242 |
| 10404 | CPQ | A001-C-207 | Human | Colorectum | FAP | 1.59e-03 | -2.94e-01 | 0.1278 |
| 10404 | CPQ | A015-C-203 | Human | Colorectum | FAP | 8.34e-09 | -2.47e-01 | -0.1294 |
| 10404 | CPQ | A002-C-201 | Human | Colorectum | FAP | 2.51e-08 | -3.11e-01 | 0.0324 |
| 10404 | CPQ | A002-C-203 | Human | Colorectum | FAP | 3.95e-10 | -3.41e-01 | 0.2786 |
| 10404 | CPQ | A001-C-108 | Human | Colorectum | FAP | 8.53e-08 | -3.07e-01 | -0.0272 |
| 10404 | CPQ | A002-C-205 | Human | Colorectum | FAP | 2.51e-10 | -3.47e-01 | -0.1236 |
| 10404 | CPQ | A015-C-006 | Human | Colorectum | FAP | 7.93e-04 | -2.64e-01 | -0.0994 |
| 10404 | CPQ | A002-C-114 | Human | Colorectum | FAP | 3.89e-07 | -3.21e-01 | -0.1561 |
| Page: 1 2 3 4 5 6 |
| Tissue | Expression Dynamics | Abbreviation |
| Colorectum (GSE201348) |  | FAP: Familial adenomatous polyposis |
| CRC: Colorectal cancer | ||
| Colorectum (HTA11) |  | AD: Adenomas |
| SER: Sessile serrated lesions | ||
| MSI-H: Microsatellite-high colorectal cancer | ||
| MSS: Microsatellite stable colorectal cancer | ||
| Esophagus |  | ESCC: Esophageal squamous cell carcinoma |
| HGIN: High-grade intraepithelial neoplasias | ||
| LGIN: Low-grade intraepithelial neoplasias | ||
| Liver | 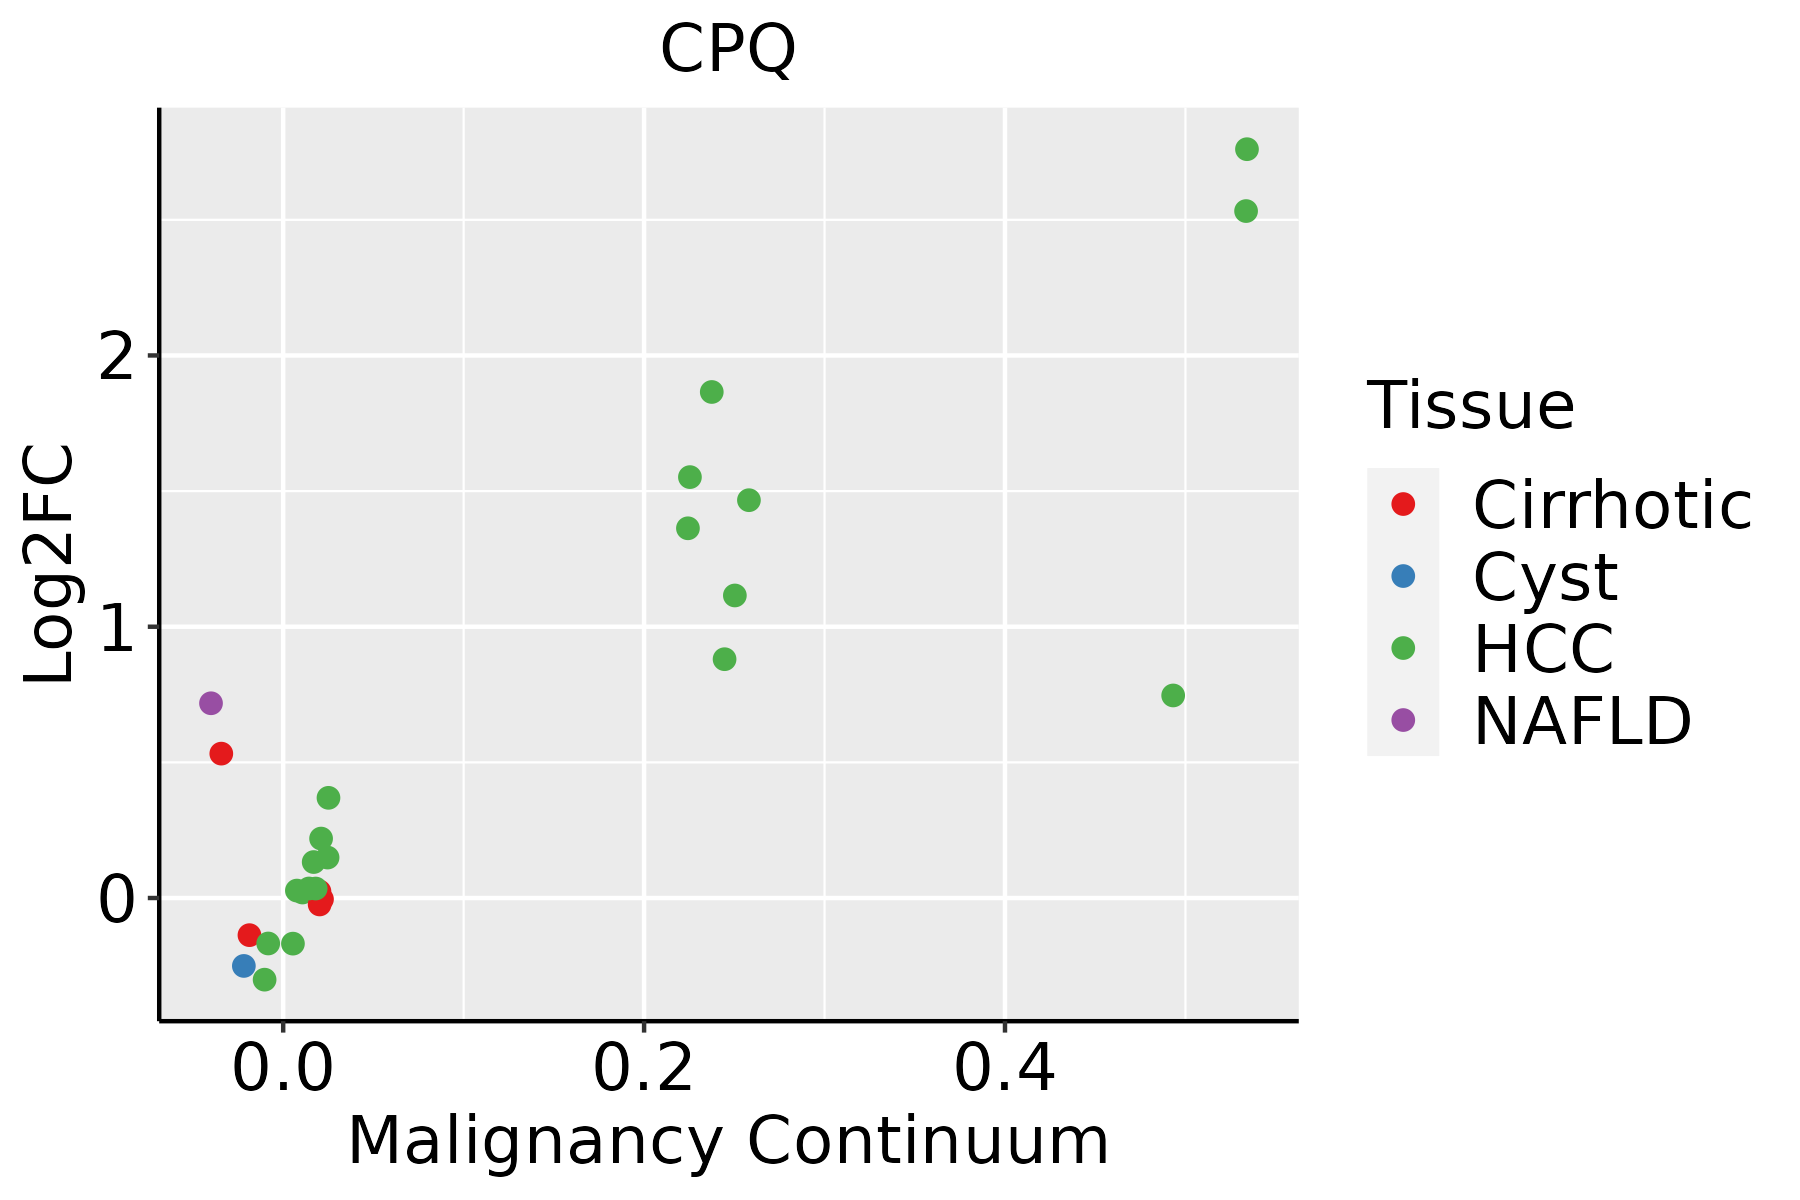 | HCC: Hepatocellular carcinoma |
| NAFLD: Non-alcoholic fatty liver disease | ||
| Oral Cavity | 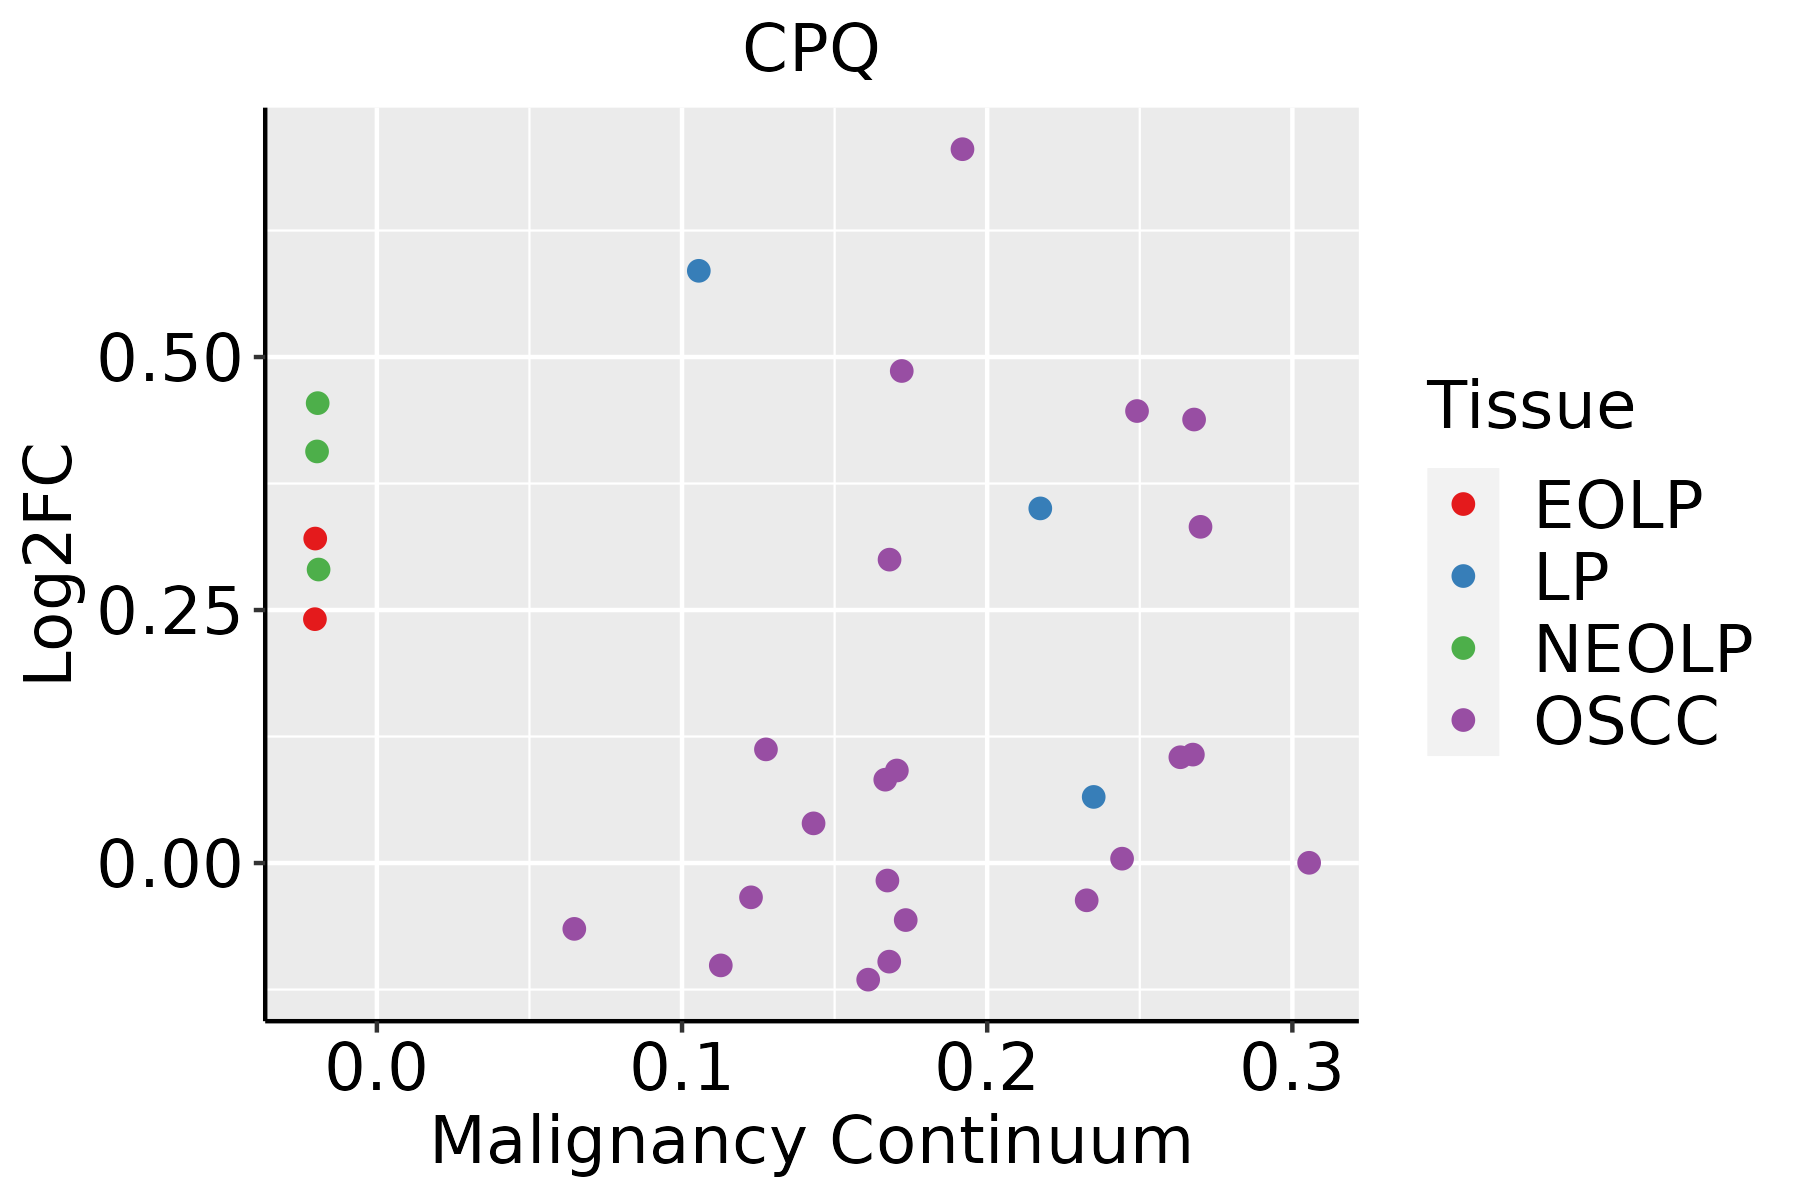 | EOLP: Erosive Oral lichen planus |
| LP: leukoplakia | ||
| NEOLP: Non-erosive oral lichen planus | ||
| OSCC: Oral squamous cell carcinoma | ||
| Thyroid | 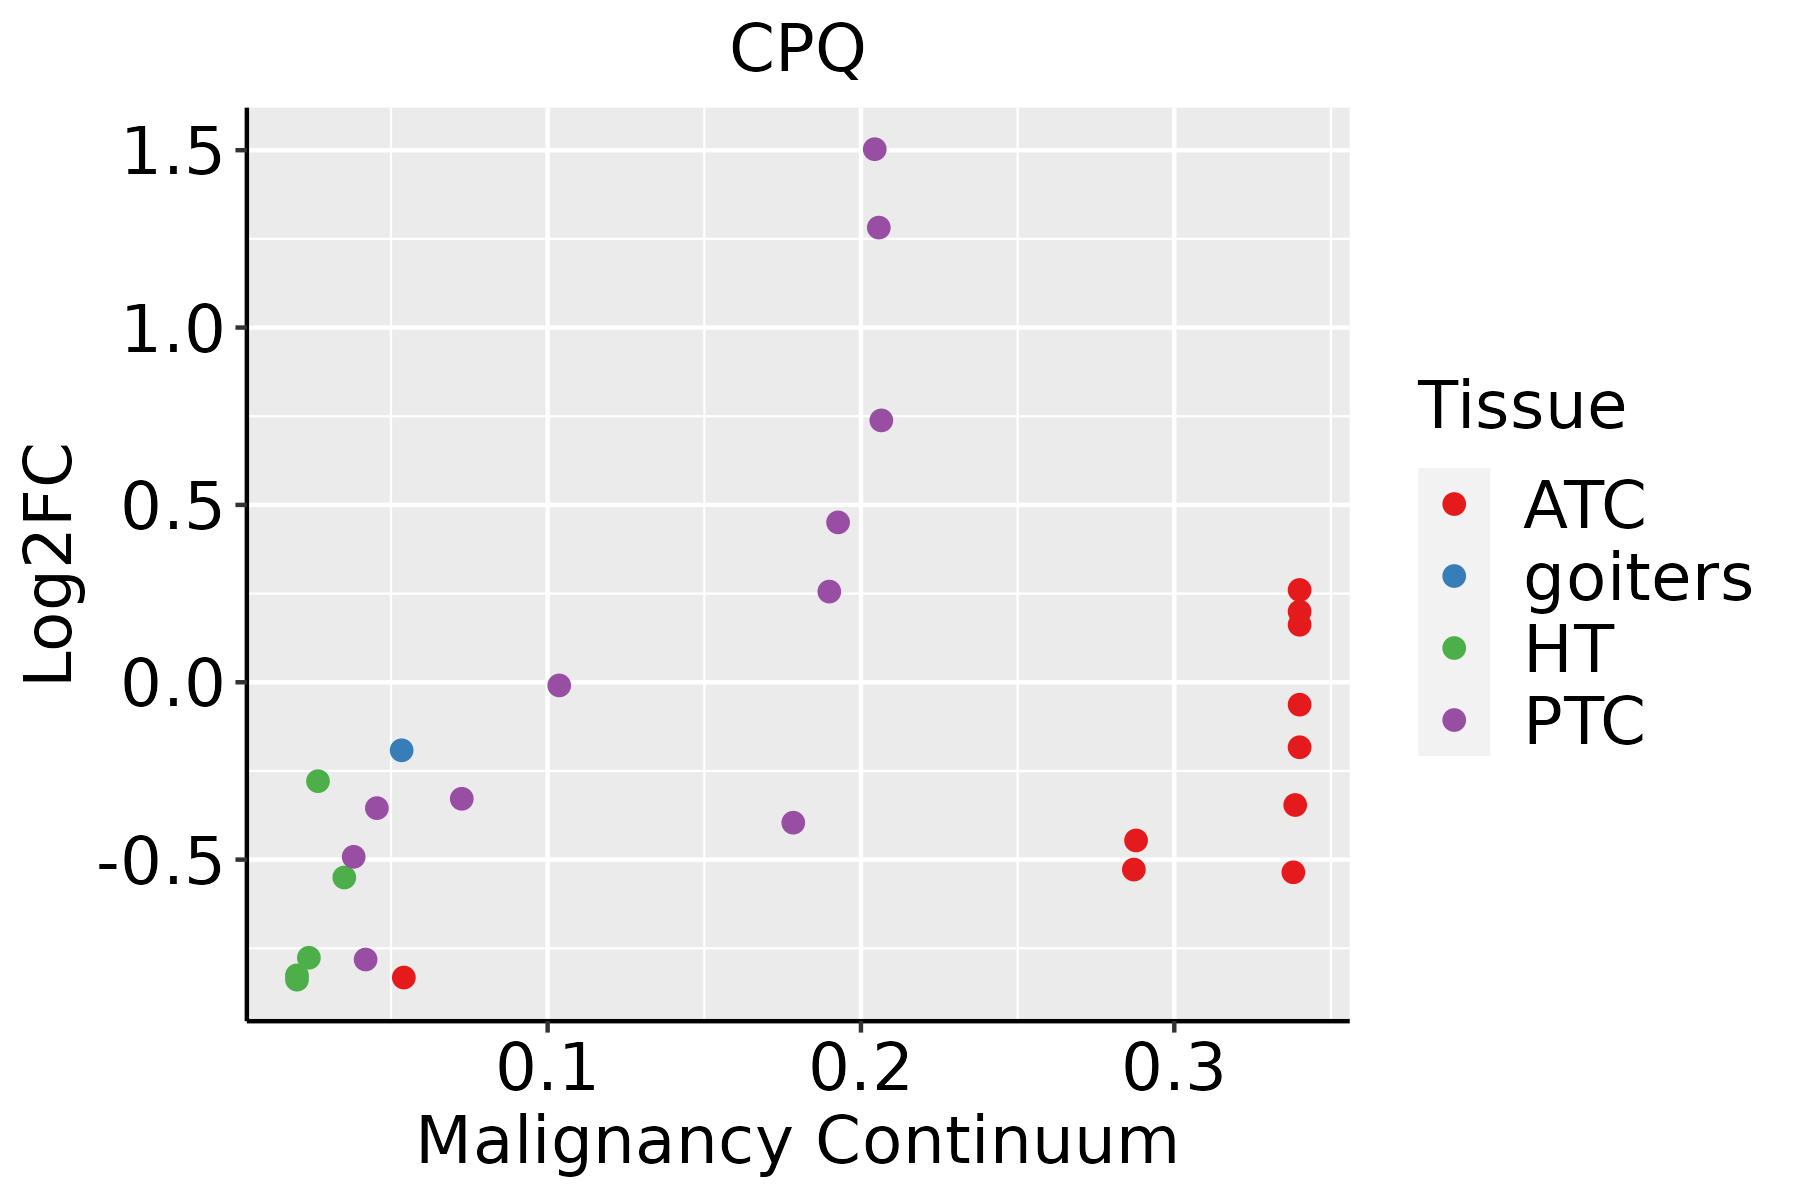 | ATC: Anaplastic thyroid cancer |
| HT: Hashimoto's thyroiditis | ||
| PTC: Papillary thyroid cancer |
| ∗log2FC in expression of this searched gene in stem-like cells from each diseased tissue sample relative to stem-like cells in normal samples in each tissue plotted against the malignancy continuum. Samples are colored based on if they are from different disease stage. |
Top |
Malignant transformation related pathway analysis |
| Find out the enriched GO biological processes and KEGG pathways involved in transition from healthy to precancer to cancer |
| Tissue | Disease Stage | Enriched GO biological Processes |
| Colorectum | AD |  |
| Colorectum | SER |  |
| Colorectum | MSS |  |
| Colorectum | MSI-H |  |
| Colorectum | FAP |  |
| ∗Top 15 enriched GO BP terms are showed in the bar plot of each disease state in each tissue. Each row represents a significant GO biological process which is colored according to the -log10(p.adjust). |
| Page: 1 2 3 4 5 6 7 8 9 |
| GO ID | Tissue | Disease Stage | Description | Gene Ratio | Bg Ratio | pvalue | p.adjust | Count |
| GO:0006575 | Colorectum | AD | cellular modified amino acid metabolic process | 59/3918 | 188/18723 | 4.80e-04 | 5.27e-03 | 59 |
| GO:00065751 | Colorectum | MSS | cellular modified amino acid metabolic process | 55/3467 | 188/18723 | 2.16e-04 | 3.01e-03 | 55 |
| GO:0031099 | Colorectum | MSS | regeneration | 51/3467 | 198/18723 | 6.99e-03 | 4.49e-02 | 51 |
| GO:003109910 | Esophagus | ESCC | regeneration | 122/8552 | 198/18723 | 4.26e-06 | 4.57e-05 | 122 |
| GO:00065757 | Esophagus | ESCC | cellular modified amino acid metabolic process | 112/8552 | 188/18723 | 8.31e-05 | 6.06e-04 | 112 |
| GO:00310993 | Liver | NAFLD | regeneration | 35/1882 | 198/18723 | 6.67e-04 | 8.61e-03 | 35 |
| GO:00424452 | Liver | NAFLD | hormone metabolic process | 36/1882 | 218/18723 | 1.98e-03 | 1.98e-02 | 36 |
| GO:00065754 | Liver | NAFLD | cellular modified amino acid metabolic process | 31/1882 | 188/18723 | 3.98e-03 | 3.34e-02 | 31 |
| GO:000657511 | Liver | Cirrhotic | cellular modified amino acid metabolic process | 70/4634 | 188/18723 | 9.04e-05 | 9.69e-04 | 70 |
| GO:003109911 | Liver | Cirrhotic | regeneration | 71/4634 | 198/18723 | 3.02e-04 | 2.65e-03 | 71 |
| GO:004244511 | Liver | Cirrhotic | hormone metabolic process | 73/4634 | 218/18723 | 2.22e-03 | 1.36e-02 | 73 |
| GO:000657521 | Liver | HCC | cellular modified amino acid metabolic process | 119/7958 | 188/18723 | 6.47e-09 | 1.67e-07 | 119 |
| GO:00310992 | Liver | HCC | regeneration | 107/7958 | 198/18723 | 6.67e-04 | 4.12e-03 | 107 |
| GO:00310999 | Oral cavity | OSCC | regeneration | 114/7305 | 198/18723 | 8.54e-08 | 1.50e-06 | 114 |
| GO:00422464 | Oral cavity | OSCC | tissue regeneration | 42/7305 | 72/18723 | 6.89e-04 | 3.84e-03 | 42 |
| GO:00065756 | Oral cavity | OSCC | cellular modified amino acid metabolic process | 91/7305 | 188/18723 | 5.33e-03 | 2.07e-02 | 91 |
| GO:003109916 | Oral cavity | LP | regeneration | 76/4623 | 198/18723 | 1.25e-05 | 2.24e-04 | 76 |
| GO:00422461 | Oral cavity | LP | tissue regeneration | 30/4623 | 72/18723 | 1.13e-03 | 9.27e-03 | 30 |
| GO:000657512 | Oral cavity | LP | cellular modified amino acid metabolic process | 64/4623 | 188/18723 | 2.43e-03 | 1.73e-02 | 64 |
| GO:003109923 | Oral cavity | EOLP | regeneration | 50/2218 | 198/18723 | 1.30e-07 | 4.25e-06 | 50 |
| Page: 1 2 |
| Pathway ID | Tissue | Disease Stage | Description | Gene Ratio | Bg Ratio | pvalue | p.adjust | qvalue | Count |
| Page: 1 |
Top |
Cell-cell communication analysis |
| Identification of potential cell-cell interactions between two cell types and their ligand-receptor pairs for different disease states |
| Ligand | Receptor | LRpair | Pathway | Tissue | Disease Stage |
| Page: 1 |
Top |
Single-cell gene regulatory network inference analysis |
| Find out the significant the regulons (TFs) and the target genes of each regulon across cell types for different disease states |
| TF | Cell Type | Tissue | Disease Stage | Target Gene | RSS | Regulon Activity |
| ∗The dot plots of a searched regulon are shown for all cell subpopulations in each disease state of each tissue based on the regulon specific score inferred using pySCENIC and by calculating the average expression. |
| Page: 1 |
Top |
Somatic mutation of malignant transformation related genes |
| Annotation of somatic variants for genes involved in malignant transformation |
| Hugo Symbol | Variant Class | Variant Classification | dbSNP RS | HGVSc | HGVSp | HGVSp Short | SWISSPROT | BIOTYPE | SIFT | PolyPhen | Tumor Sample Barcode | Tissue | Histology | Sex | Age | Stage | Therapy Types | Drugs | Outcome |
| CPQ | SNV | Missense_Mutation | c.1327N>G | p.Met443Val | p.M443V | Q9Y646 | protein_coding | tolerated(0.17) | benign(0.001) | TCGA-AO-A128-01 | Breast | breast invasive carcinoma | Female | <65 | I/II | Chemotherapy | doxorubicin | SD | |
| CPQ | SNV | Missense_Mutation | c.40N>T | p.Leu14Phe | p.L14F | Q9Y646 | protein_coding | tolerated_low_confidence(0.17) | benign(0.005) | TCGA-B6-A0RQ-01 | Breast | breast invasive carcinoma | Female | >=65 | I/II | Unknown | Unknown | SD | |
| CPQ | SNV | Missense_Mutation | c.185N>C | p.Arg62Thr | p.R62T | Q9Y646 | protein_coding | tolerated(0.21) | benign(0.035) | TCGA-BH-A0AW-01 | Breast | breast invasive carcinoma | Female | <65 | I/II | Chemotherapy | carboplatin | SD | |
| CPQ | SNV | Missense_Mutation | novel | c.1009N>A | p.Glu337Lys | p.E337K | Q9Y646 | protein_coding | deleterious(0) | probably_damaging(1) | TCGA-BH-A18P-01 | Breast | breast invasive carcinoma | Female | <65 | I/II | Unknown | Unknown | PD |
| CPQ | SNV | Missense_Mutation | c.1297C>G | p.His433Asp | p.H433D | Q9Y646 | protein_coding | deleterious(0) | probably_damaging(1) | TCGA-BH-A1FN-01 | Breast | breast invasive carcinoma | Female | <65 | I/II | Unknown | Unknown | PD | |
| CPQ | SNV | Missense_Mutation | rs753340797 | c.967N>T | p.Arg323Cys | p.R323C | Q9Y646 | protein_coding | deleterious(0) | probably_damaging(0.956) | TCGA-C8-A12L-01 | Breast | breast invasive carcinoma | Female | >=65 | I/II | Unknown | Unknown | SD |
| CPQ | SNV | Missense_Mutation | rs767066651 | c.1256N>A | p.Gly419Glu | p.G419E | Q9Y646 | protein_coding | deleterious(0) | probably_damaging(0.973) | TCGA-C8-A1HM-01 | Breast | breast invasive carcinoma | Female | >=65 | I/II | Chemotherapy | doxorubicin | CR |
| CPQ | SNV | Missense_Mutation | rs577356141 | c.548N>T | p.Thr183Met | p.T183M | Q9Y646 | protein_coding | deleterious(0.01) | possibly_damaging(0.849) | TCGA-E2-A2P5-01 | Breast | breast invasive carcinoma | Female | >=65 | III/IV | Hormone Therapy | arimidex | PD |
| CPQ | SNV | Missense_Mutation | novel | c.482N>T | p.Arg161Ile | p.R161I | Q9Y646 | protein_coding | tolerated(0.06) | benign(0.122) | TCGA-2W-A8YY-01 | Cervix | cervical & endocervical cancer | Female | <65 | I/II | Chemotherapy | cisplatin | CR |
| CPQ | SNV | Missense_Mutation | rs757303134 | c.563C>T | p.Thr188Met | p.T188M | Q9Y646 | protein_coding | tolerated(0.24) | benign(0.018) | TCGA-EK-A2R8-01 | Cervix | cervical & endocervical cancer | Female | <65 | I/II | Unknown | Unknown | SD |
| Page: 1 2 3 4 5 6 7 8 9 |
Top |
Related drugs of malignant transformation related genes |
| Identification of chemicals and drugs interact with genes involved in malignant transfromation |
| (DGIdb 4.0) |
| Entrez ID | Symbol | Category | Interaction Types | Drug Claim Name | Drug Name | PMIDs |
| Page: 1 |

Copyright 2023-Present -The University of Texas Health Science Center at Houston |