
|
|||||
|
 | |
| |
| |
| |
| |
| |
|
Gene: CPPED1 |
Gene summary for CPPED1 |
| Gene information | Species | Human | Gene symbol | CPPED1 | Gene ID | 55313 |
| Gene name | calcineurin like phosphoesterase domain containing 1 | |
| Gene Alias | CSTP1 | |
| Cytomap | 16p13.12 | |
| Gene Type | protein-coding | GO ID | GO:0006464 | UniProtAcc | Q9BRF8 |
Top |
Malignant transformation analysis |
| Identification of the aberrant gene expression in precancerous and cancerous lesions by comparing the gene expression of stem-like cells in diseased tissues with normal stem cells |
| Entrez ID | Symbol | Replicates | Species | Organ | Tissue | Adj P-value | Log2FC | Malignancy |
| 55313 | CPPED1 | LZE4T | Human | Esophagus | ESCC | 2.05e-07 | 2.07e-01 | 0.0811 |
| 55313 | CPPED1 | P1T-E | Human | Esophagus | ESCC | 9.17e-03 | 5.83e-01 | 0.0875 |
| 55313 | CPPED1 | P2T-E | Human | Esophagus | ESCC | 9.81e-11 | 1.42e-01 | 0.1177 |
| 55313 | CPPED1 | P4T-E | Human | Esophagus | ESCC | 1.56e-14 | 3.08e-01 | 0.1323 |
| 55313 | CPPED1 | P5T-E | Human | Esophagus | ESCC | 1.23e-03 | 4.37e-02 | 0.1327 |
| 55313 | CPPED1 | P8T-E | Human | Esophagus | ESCC | 1.20e-16 | 4.99e-01 | 0.0889 |
| 55313 | CPPED1 | P9T-E | Human | Esophagus | ESCC | 9.79e-11 | 1.80e-01 | 0.1131 |
| 55313 | CPPED1 | P10T-E | Human | Esophagus | ESCC | 2.28e-06 | 8.07e-02 | 0.116 |
| 55313 | CPPED1 | P11T-E | Human | Esophagus | ESCC | 7.93e-19 | 8.56e-01 | 0.1426 |
| 55313 | CPPED1 | P12T-E | Human | Esophagus | ESCC | 9.11e-11 | 1.62e-01 | 0.1122 |
| 55313 | CPPED1 | P15T-E | Human | Esophagus | ESCC | 1.33e-12 | 2.98e-01 | 0.1149 |
| 55313 | CPPED1 | P16T-E | Human | Esophagus | ESCC | 7.38e-08 | 1.08e-01 | 0.1153 |
| 55313 | CPPED1 | P17T-E | Human | Esophagus | ESCC | 2.30e-10 | 6.07e-01 | 0.1278 |
| 55313 | CPPED1 | P19T-E | Human | Esophagus | ESCC | 2.04e-15 | 7.17e-01 | 0.1662 |
| 55313 | CPPED1 | P20T-E | Human | Esophagus | ESCC | 1.59e-30 | 7.24e-01 | 0.1124 |
| 55313 | CPPED1 | P21T-E | Human | Esophagus | ESCC | 3.94e-13 | 3.15e-01 | 0.1617 |
| 55313 | CPPED1 | P22T-E | Human | Esophagus | ESCC | 1.91e-05 | 7.14e-02 | 0.1236 |
| 55313 | CPPED1 | P23T-E | Human | Esophagus | ESCC | 4.22e-16 | 6.56e-01 | 0.108 |
| 55313 | CPPED1 | P24T-E | Human | Esophagus | ESCC | 1.84e-09 | 2.82e-01 | 0.1287 |
| 55313 | CPPED1 | P26T-E | Human | Esophagus | ESCC | 7.37e-19 | 1.93e-01 | 0.1276 |
| Page: 1 2 3 4 |
| Tissue | Expression Dynamics | Abbreviation |
| Esophagus | 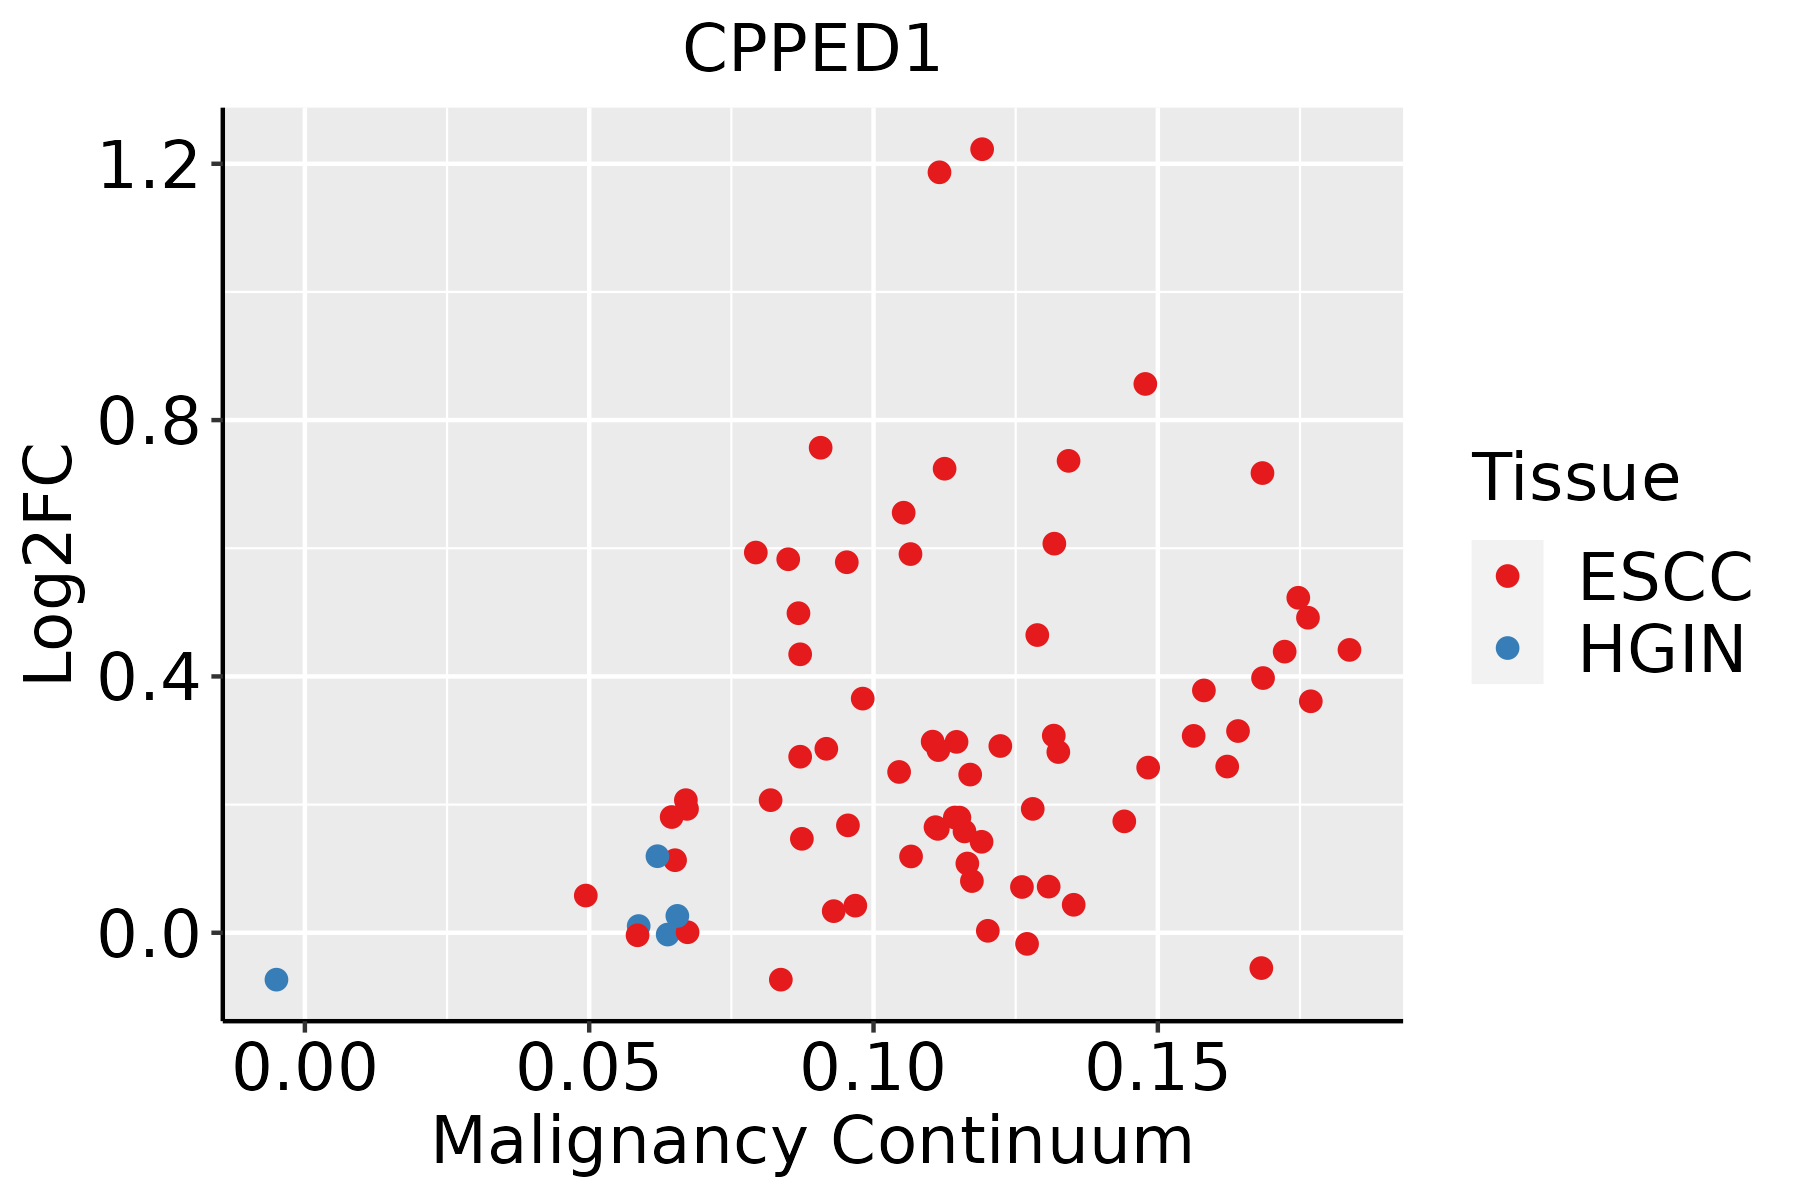 | ESCC: Esophageal squamous cell carcinoma |
| HGIN: High-grade intraepithelial neoplasias | ||
| LGIN: Low-grade intraepithelial neoplasias | ||
| Liver | 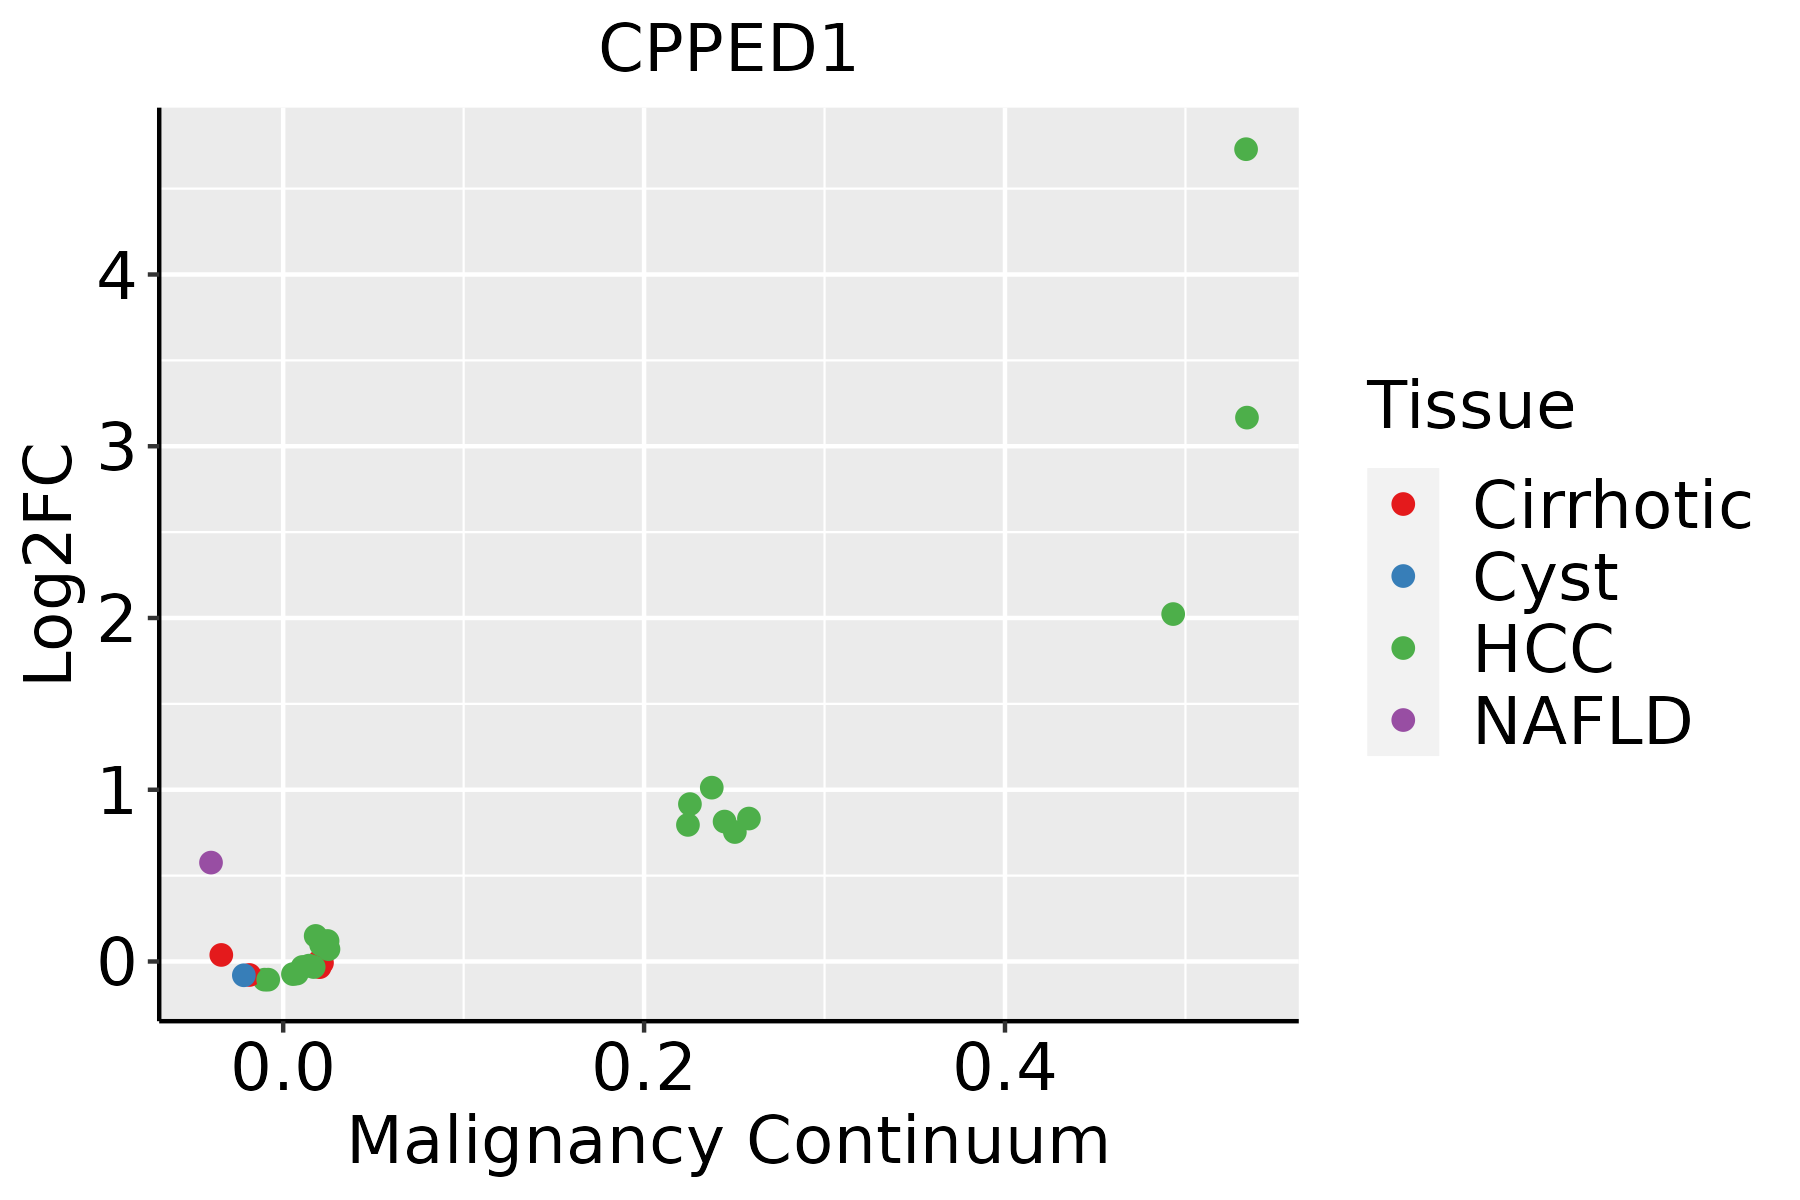 | HCC: Hepatocellular carcinoma |
| NAFLD: Non-alcoholic fatty liver disease |
| ∗log2FC in expression of this searched gene in stem-like cells from each diseased tissue sample relative to stem-like cells in normal samples in each tissue plotted against the malignancy continuum. Samples are colored based on if they are from different disease stage. |
Top |
Malignant transformation related pathway analysis |
| Find out the enriched GO biological processes and KEGG pathways involved in transition from healthy to precancer to cancer |
| Tissue | Disease Stage | Enriched GO biological Processes |
| Colorectum | AD |  |
| Colorectum | SER |  |
| Colorectum | MSS |  |
| Colorectum | MSI-H |  |
| Colorectum | FAP |  |
| ∗Top 15 enriched GO BP terms are showed in the bar plot of each disease state in each tissue. Each row represents a significant GO biological process which is colored according to the -log10(p.adjust). |
| Page: 1 2 3 4 5 6 7 8 9 |
| GO ID | Tissue | Disease Stage | Description | Gene Ratio | Bg Ratio | pvalue | p.adjust | Count |
| GO:001631110 | Esophagus | ESCC | dephosphorylation | 251/8552 | 417/18723 | 1.26e-09 | 2.99e-08 | 251 |
| GO:000647018 | Esophagus | ESCC | protein dephosphorylation | 177/8552 | 281/18723 | 3.13e-09 | 6.72e-08 | 177 |
| GO:00163115 | Liver | NAFLD | dephosphorylation | 69/1882 | 417/18723 | 2.27e-05 | 6.23e-04 | 69 |
| GO:00064706 | Liver | NAFLD | protein dephosphorylation | 50/1882 | 281/18723 | 4.53e-05 | 1.09e-03 | 50 |
| GO:001631121 | Liver | HCC | dephosphorylation | 230/7958 | 417/18723 | 1.00e-07 | 1.96e-06 | 230 |
| GO:000647021 | Liver | HCC | protein dephosphorylation | 162/7958 | 281/18723 | 1.91e-07 | 3.46e-06 | 162 |
| Page: 1 |
| Pathway ID | Tissue | Disease Stage | Description | Gene Ratio | Bg Ratio | pvalue | p.adjust | qvalue | Count |
| Page: 1 |
Top |
Cell-cell communication analysis |
| Identification of potential cell-cell interactions between two cell types and their ligand-receptor pairs for different disease states |
| Ligand | Receptor | LRpair | Pathway | Tissue | Disease Stage |
| Page: 1 |
Top |
Single-cell gene regulatory network inference analysis |
| Find out the significant the regulons (TFs) and the target genes of each regulon across cell types for different disease states |
| TF | Cell Type | Tissue | Disease Stage | Target Gene | RSS | Regulon Activity |
| ∗The dot plots of a searched regulon are shown for all cell subpopulations in each disease state of each tissue based on the regulon specific score inferred using pySCENIC and by calculating the average expression. |
| Page: 1 |
Top |
Somatic mutation of malignant transformation related genes |
| Annotation of somatic variants for genes involved in malignant transformation |
| Hugo Symbol | Variant Class | Variant Classification | dbSNP RS | HGVSc | HGVSp | HGVSp Short | SWISSPROT | BIOTYPE | SIFT | PolyPhen | Tumor Sample Barcode | Tissue | Histology | Sex | Age | Stage | Therapy Types | Drugs | Outcome |
| CPPED1 | SNV | Missense_Mutation | rs368567080 | c.302G>A | p.Arg101Gln | p.R101Q | Q9BRF8 | protein_coding | deleterious(0.02) | benign(0.06) | TCGA-A2-A04R-01 | Breast | breast invasive carcinoma | Female | <65 | I/II | Chemotherapy | taxol | SD |
| CPPED1 | SNV | Missense_Mutation | rs3748980 | c.256G>A | p.Val86Ile | p.V86I | Q9BRF8 | protein_coding | tolerated(0.25) | benign(0.416) | TCGA-BH-A18G-01 | Breast | breast invasive carcinoma | Female | >=65 | I/II | Unknown | Unknown | SD |
| CPPED1 | SNV | Missense_Mutation | c.797C>G | p.Ala266Gly | p.A266G | Q9BRF8 | protein_coding | deleterious(0) | probably_damaging(0.962) | TCGA-D8-A1JK-01 | Breast | breast invasive carcinoma | Female | >=65 | I/II | Unknown | Unknown | SD | |
| CPPED1 | insertion | Nonsense_Mutation | novel | c.421_422insGTTTCAGGGAGGAAGGACAAGTCTAGAGAGGGC | p.Glu141delinsGlyPheArgGluGluGlyGlnValTerArgGlyGln | p.E141delinsGFREEGQV*RGQ | Q9BRF8 | protein_coding | TCGA-A8-A06Q-01 | Breast | breast invasive carcinoma | Female | <65 | III/IV | Unknown | Unknown | SD | ||
| CPPED1 | SNV | Missense_Mutation | c.640G>A | p.Asp214Asn | p.D214N | Q9BRF8 | protein_coding | deleterious(0.02) | benign(0.055) | TCGA-DR-A0ZM-01 | Cervix | cervical & endocervical cancer | Female | <65 | III/IV | Unspecific | Cisplatin | SD | |
| CPPED1 | SNV | Missense_Mutation | c.266G>A | p.Gly89Asp | p.G89D | Q9BRF8 | protein_coding | deleterious(0) | probably_damaging(0.999) | TCGA-AD-6895-01 | Colorectum | colon adenocarcinoma | Male | >=65 | III/IV | Unknown | Unknown | SD | |
| CPPED1 | SNV | Missense_Mutation | rs367880734 | c.197G>A | p.Arg66His | p.R66H | Q9BRF8 | protein_coding | deleterious(0.04) | possibly_damaging(0.806) | TCGA-CM-4746-01 | Colorectum | colon adenocarcinoma | Male | <65 | I/II | Unknown | Unknown | SD |
| CPPED1 | SNV | Missense_Mutation | rs771021460 | c.652N>A | p.Asp218Asn | p.D218N | Q9BRF8 | protein_coding | tolerated(0.14) | benign(0.013) | TCGA-AG-A002-01 | Colorectum | rectum adenocarcinoma | Male | <65 | I/II | Unknown | Unknown | SD |
| CPPED1 | SNV | Missense_Mutation | rs539774293 | c.164N>G | p.Asp55Gly | p.D55G | Q9BRF8 | protein_coding | deleterious(0.03) | benign(0.022) | TCGA-F5-6814-01 | Colorectum | rectum adenocarcinoma | Male | <65 | I/II | Unknown | Unknown | SD |
| CPPED1 | deletion | Frame_Shift_Del | rs759977975 | c.44delN | p.Gly15AlafsTer31 | p.G15Afs*31 | Q9BRF8 | protein_coding | TCGA-AA-3713-01 | Colorectum | colon adenocarcinoma | Male | >=65 | III/IV | Chemotherapy | 5-fluorouracil | PR |
| Page: 1 2 3 4 5 |
Top |
Related drugs of malignant transformation related genes |
| Identification of chemicals and drugs interact with genes involved in malignant transfromation |
| (DGIdb 4.0) |
| Entrez ID | Symbol | Category | Interaction Types | Drug Claim Name | Drug Name | PMIDs |
| Page: 1 |

Copyright 2023-Present -The University of Texas Health Science Center at Houston |