
|
|||||
|
 | |
| |
| |
| |
| |
| |
|
Gene: CPNE8 |
Gene summary for CPNE8 |
| Gene information | Species | Human | Gene symbol | CPNE8 | Gene ID | 144402 |
| Gene name | copine 8 | |
| Gene Alias | CPNE8 | |
| Cytomap | 12q12 | |
| Gene Type | protein-coding | GO ID | GO:0008150 | UniProtAcc | Q86YQ8 |
Top |
Malignant transformation analysis |
| Identification of the aberrant gene expression in precancerous and cancerous lesions by comparing the gene expression of stem-like cells in diseased tissues with normal stem cells |
| Entrez ID | Symbol | Replicates | Species | Organ | Tissue | Adj P-value | Log2FC | Malignancy |
| 144402 | CPNE8 | CCI_1 | Human | Cervix | CC | 3.11e-16 | 1.30e+00 | 0.528 |
| 144402 | CPNE8 | CCI_3 | Human | Cervix | CC | 2.13e-09 | 8.51e-01 | 0.516 |
| 144402 | CPNE8 | LZE4T | Human | Esophagus | ESCC | 2.46e-03 | 2.72e-01 | 0.0811 |
| 144402 | CPNE8 | LZE5T | Human | Esophagus | ESCC | 2.24e-05 | 2.90e-01 | 0.0514 |
| 144402 | CPNE8 | LZE8T | Human | Esophagus | ESCC | 3.88e-05 | 1.93e-01 | 0.067 |
| 144402 | CPNE8 | LZE20T | Human | Esophagus | ESCC | 3.86e-07 | 2.69e-01 | 0.0662 |
| 144402 | CPNE8 | LZE24T | Human | Esophagus | ESCC | 5.55e-06 | 2.88e-01 | 0.0596 |
| 144402 | CPNE8 | P1T-E | Human | Esophagus | ESCC | 2.96e-08 | 5.41e-01 | 0.0875 |
| 144402 | CPNE8 | P5T-E | Human | Esophagus | ESCC | 1.94e-20 | 4.63e-01 | 0.1327 |
| 144402 | CPNE8 | P8T-E | Human | Esophagus | ESCC | 3.96e-25 | 4.85e-01 | 0.0889 |
| 144402 | CPNE8 | P9T-E | Human | Esophagus | ESCC | 1.75e-05 | 2.24e-01 | 0.1131 |
| 144402 | CPNE8 | P10T-E | Human | Esophagus | ESCC | 2.74e-11 | 1.92e-01 | 0.116 |
| 144402 | CPNE8 | P11T-E | Human | Esophagus | ESCC | 2.60e-03 | 4.42e-01 | 0.1426 |
| 144402 | CPNE8 | P12T-E | Human | Esophagus | ESCC | 5.18e-19 | 4.27e-01 | 0.1122 |
| 144402 | CPNE8 | P19T-E | Human | Esophagus | ESCC | 1.25e-02 | 4.73e-01 | 0.1662 |
| 144402 | CPNE8 | P20T-E | Human | Esophagus | ESCC | 1.73e-49 | 1.09e+00 | 0.1124 |
| 144402 | CPNE8 | P21T-E | Human | Esophagus | ESCC | 4.01e-06 | 1.61e-01 | 0.1617 |
| 144402 | CPNE8 | P22T-E | Human | Esophagus | ESCC | 4.40e-04 | 1.05e-01 | 0.1236 |
| 144402 | CPNE8 | P23T-E | Human | Esophagus | ESCC | 4.25e-15 | 4.07e-01 | 0.108 |
| 144402 | CPNE8 | P24T-E | Human | Esophagus | ESCC | 4.41e-05 | 1.16e-01 | 0.1287 |
| Page: 1 2 3 4 |
| Tissue | Expression Dynamics | Abbreviation |
| Cervix | 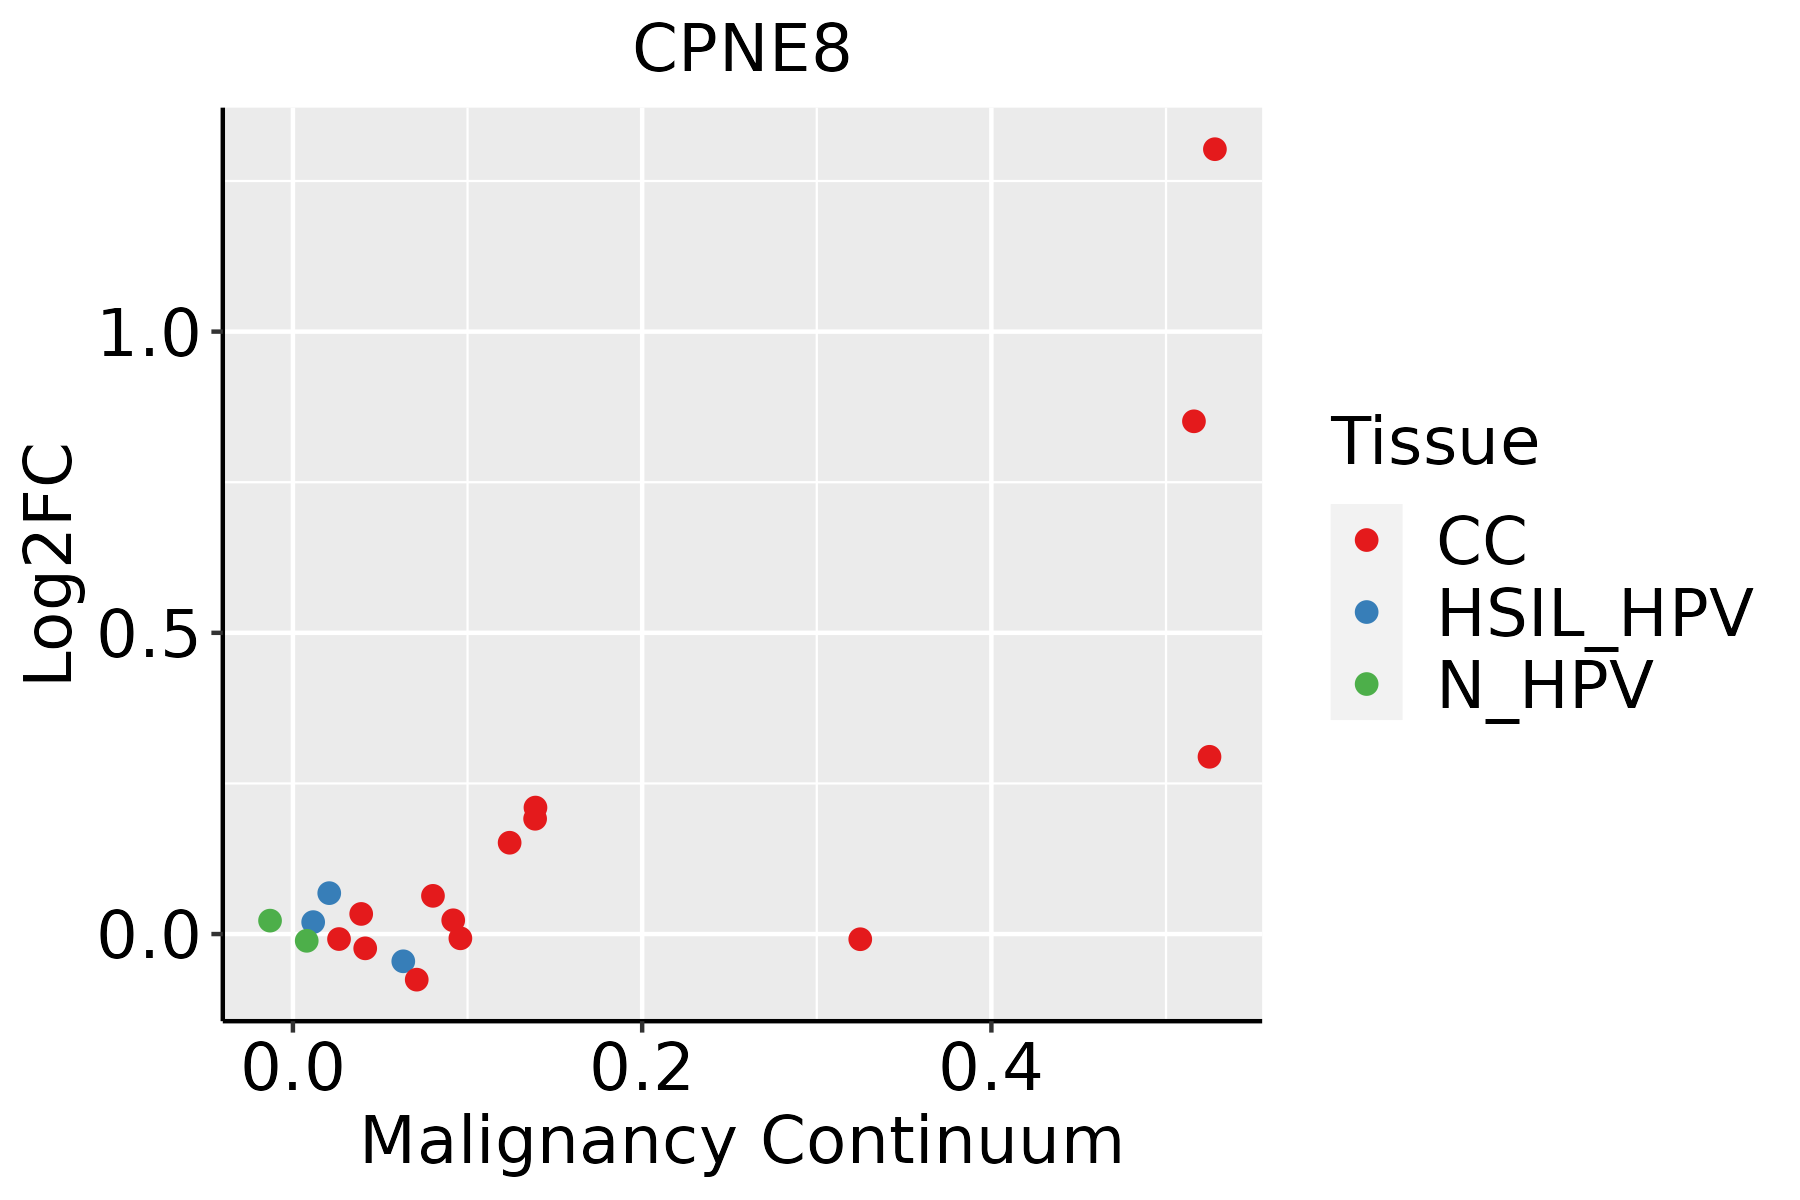 | CC: Cervix cancer |
| HSIL_HPV: HPV-infected high-grade squamous intraepithelial lesions | ||
| N_HPV: HPV-infected normal cervix | ||
| Esophagus | 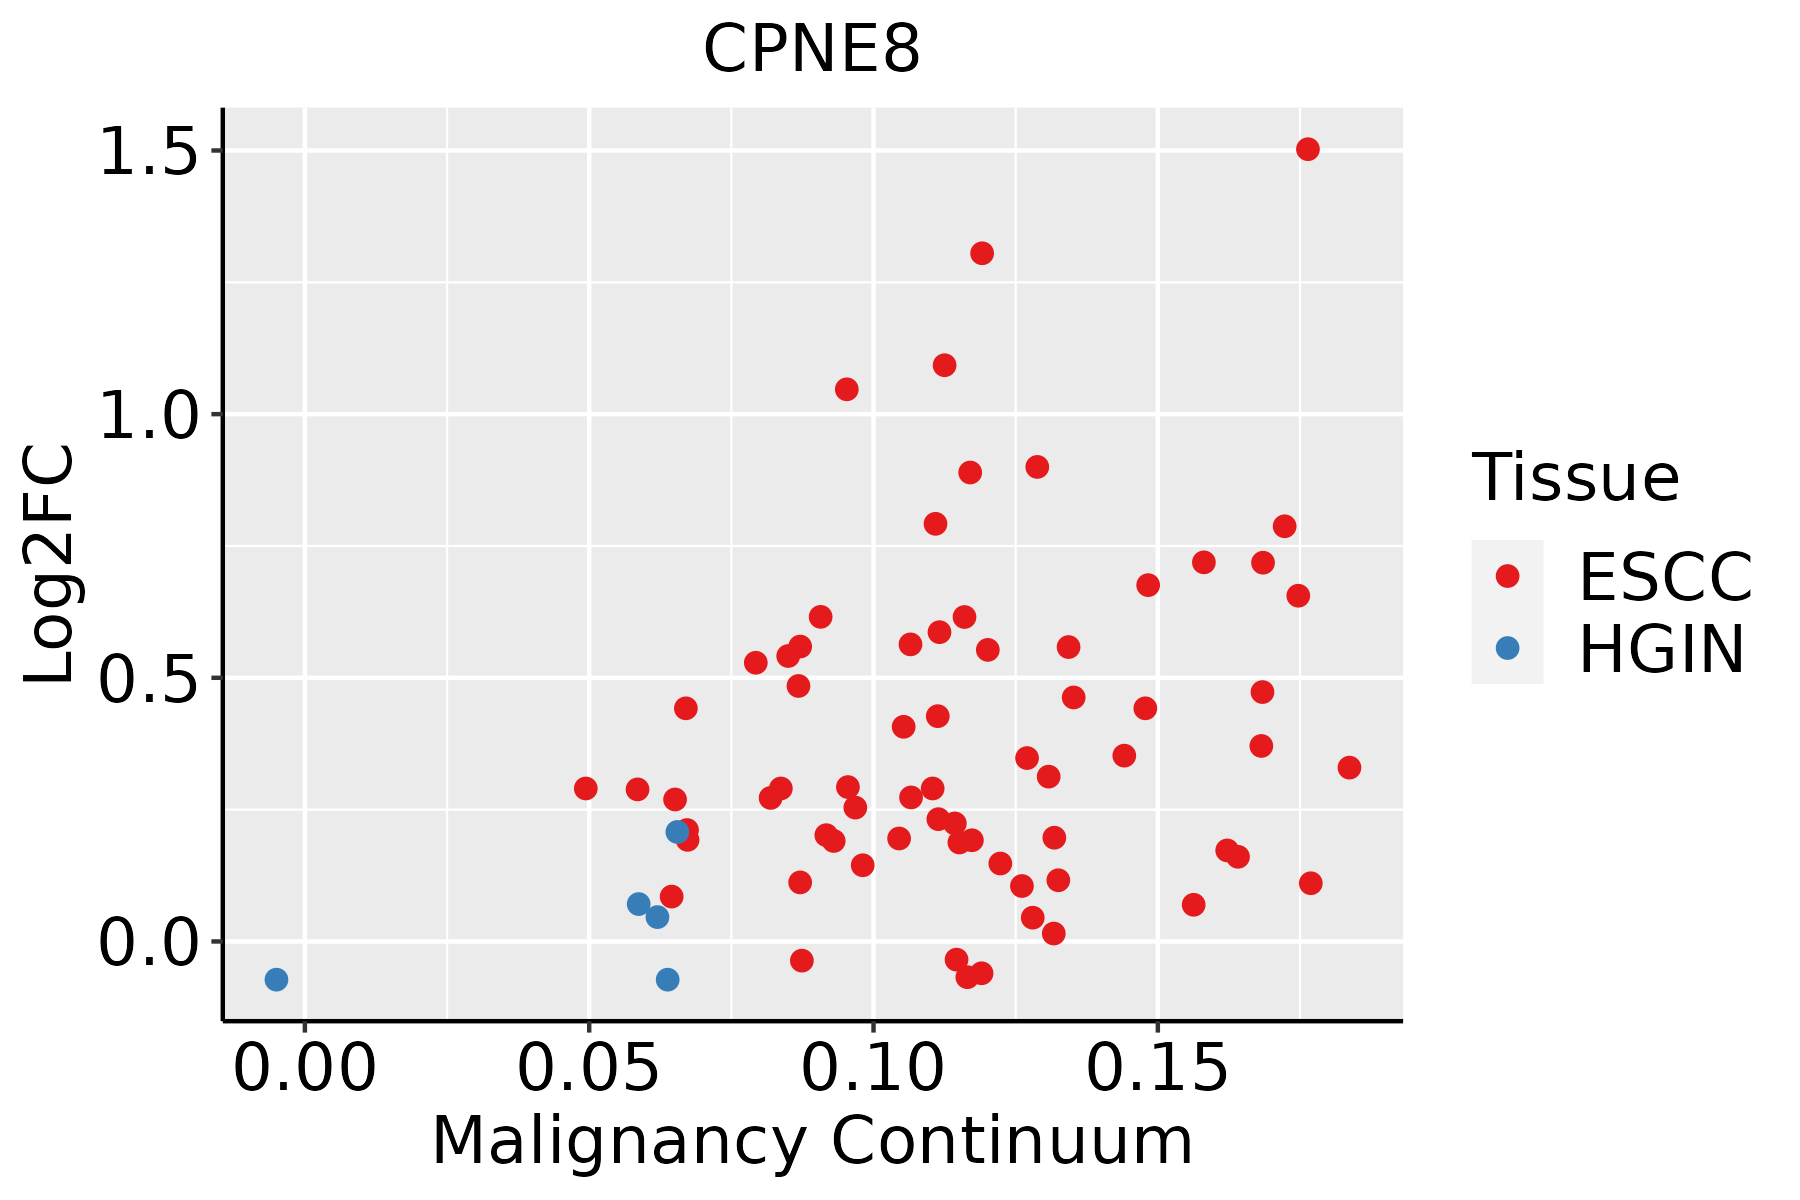 | ESCC: Esophageal squamous cell carcinoma |
| HGIN: High-grade intraepithelial neoplasias | ||
| LGIN: Low-grade intraepithelial neoplasias | ||
| Liver |  | HCC: Hepatocellular carcinoma |
| NAFLD: Non-alcoholic fatty liver disease | ||
| Lung | 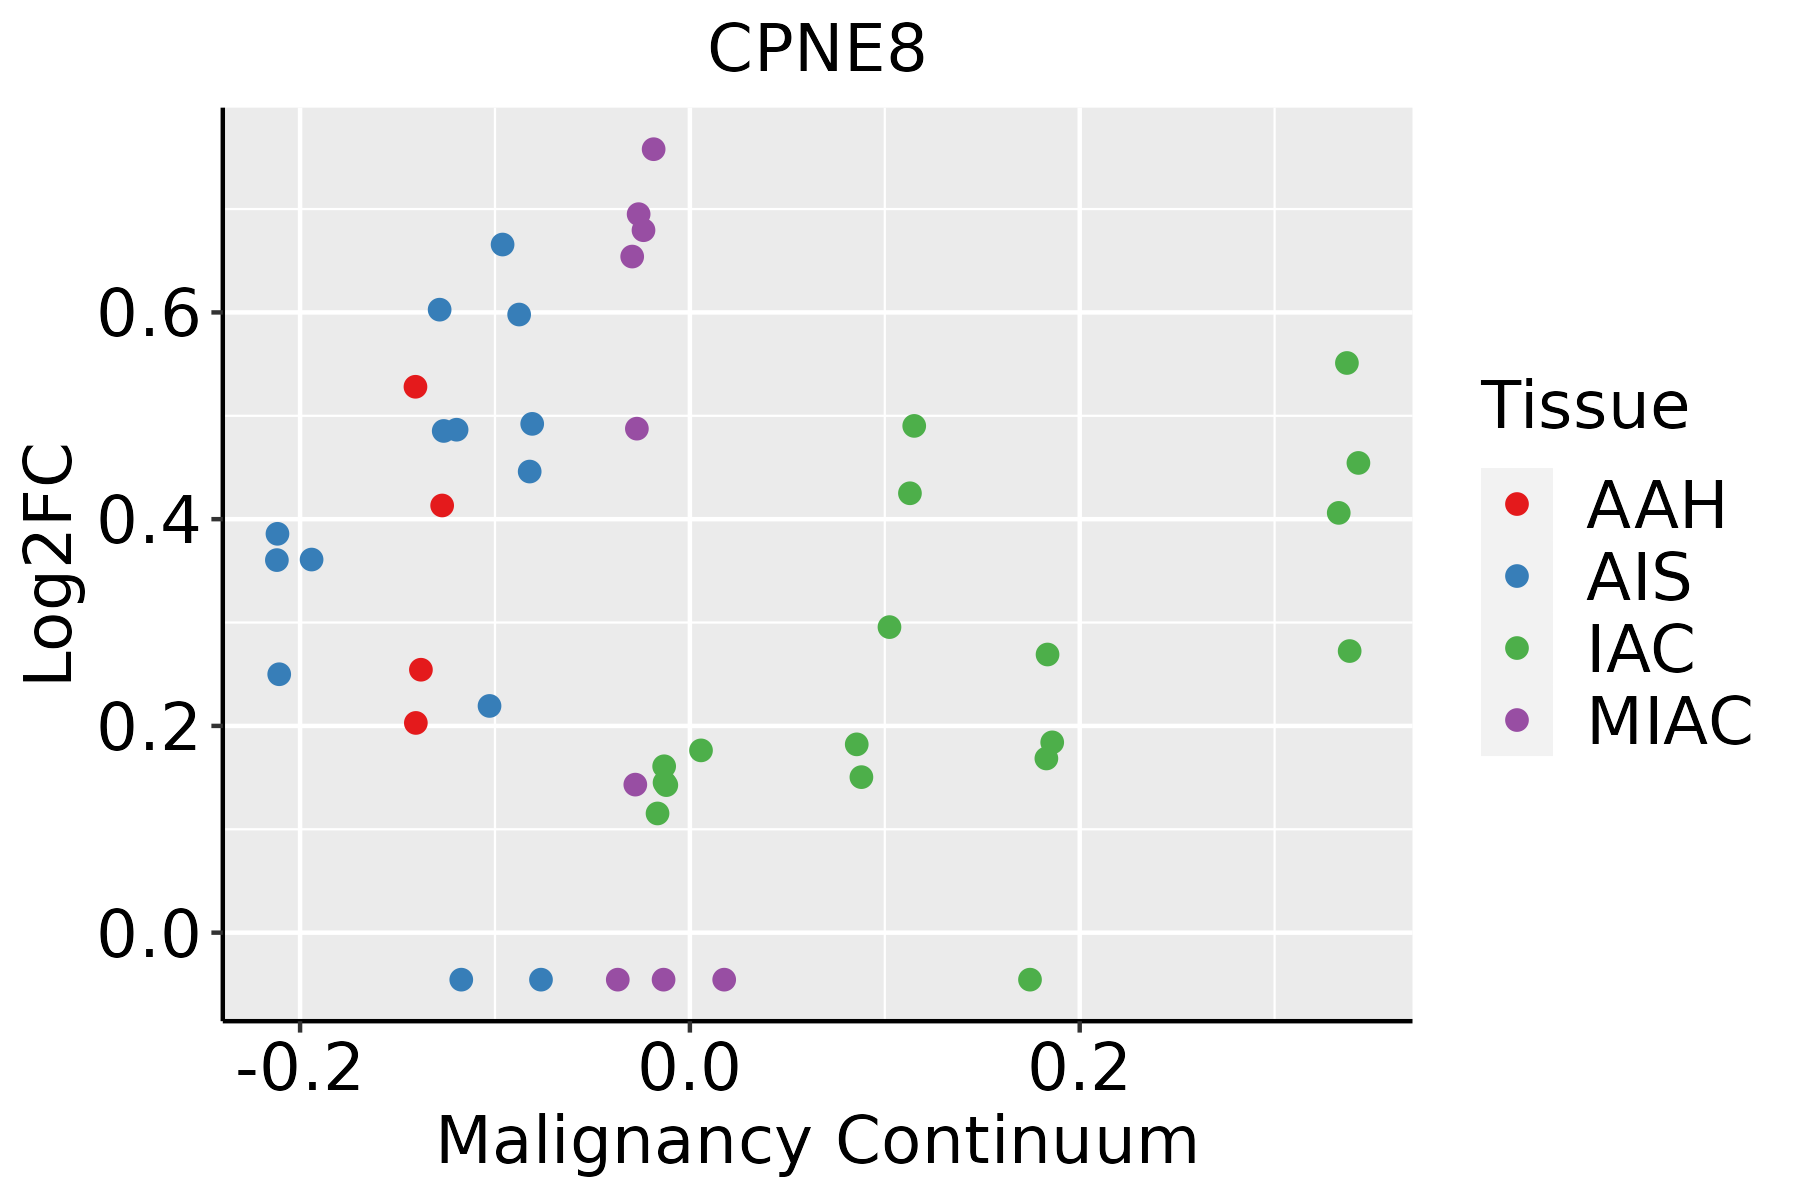 | AAH: Atypical adenomatous hyperplasia |
| AIS: Adenocarcinoma in situ | ||
| IAC: Invasive lung adenocarcinoma | ||
| MIA: Minimally invasive adenocarcinoma |
| ∗log2FC in expression of this searched gene in stem-like cells from each diseased tissue sample relative to stem-like cells in normal samples in each tissue plotted against the malignancy continuum. Samples are colored based on if they are from different disease stage. |
Top |
Malignant transformation related pathway analysis |
| Find out the enriched GO biological processes and KEGG pathways involved in transition from healthy to precancer to cancer |
| Tissue | Disease Stage | Enriched GO biological Processes |
| Colorectum | AD |  |
| Colorectum | SER |  |
| Colorectum | MSS |  |
| Colorectum | MSI-H |  |
| Colorectum | FAP |  |
| ∗Top 15 enriched GO BP terms are showed in the bar plot of each disease state in each tissue. Each row represents a significant GO biological process which is colored according to the -log10(p.adjust). |
| Page: 1 2 3 4 5 6 7 8 9 |
| GO ID | Tissue | Disease Stage | Description | Gene Ratio | Bg Ratio | pvalue | p.adjust | Count |
| GO:001003810 | Cervix | CC | response to metal ion | 67/2311 | 373/18723 | 9.67e-04 | 8.10e-03 | 67 |
| GO:00515926 | Cervix | CC | response to calcium ion | 31/2311 | 149/18723 | 2.31e-03 | 1.65e-02 | 31 |
| GO:001003827 | Esophagus | ESCC | response to metal ion | 208/8552 | 373/18723 | 5.02e-05 | 3.90e-04 | 208 |
| GO:007124117 | Esophagus | ESCC | cellular response to inorganic substance | 125/8552 | 226/18723 | 2.17e-03 | 9.67e-03 | 125 |
| GO:00100387 | Liver | NAFLD | response to metal ion | 62/1882 | 373/18723 | 5.05e-05 | 1.19e-03 | 62 |
| GO:00515923 | Liver | NAFLD | response to calcium ion | 26/1882 | 149/18723 | 3.69e-03 | 3.15e-02 | 26 |
| GO:001003812 | Liver | Cirrhotic | response to metal ion | 150/4634 | 373/18723 | 2.27e-11 | 1.37e-09 | 150 |
| GO:005159211 | Liver | Cirrhotic | response to calcium ion | 61/4634 | 149/18723 | 9.47e-06 | 1.38e-04 | 61 |
| GO:00712487 | Liver | Cirrhotic | cellular response to metal ion | 73/4634 | 197/18723 | 7.73e-05 | 8.54e-04 | 73 |
| GO:00712417 | Liver | Cirrhotic | cellular response to inorganic substance | 81/4634 | 226/18723 | 1.21e-04 | 1.20e-03 | 81 |
| GO:001003822 | Liver | HCC | response to metal ion | 208/7958 | 373/18723 | 1.35e-07 | 2.56e-06 | 208 |
| GO:007124112 | Liver | HCC | cellular response to inorganic substance | 119/7958 | 226/18723 | 1.26e-03 | 6.92e-03 | 119 |
| GO:005159221 | Liver | HCC | response to calcium ion | 81/7958 | 149/18723 | 2.26e-03 | 1.13e-02 | 81 |
| GO:007124812 | Liver | HCC | cellular response to metal ion | 101/7958 | 197/18723 | 7.82e-03 | 3.10e-02 | 101 |
| GO:00515924 | Lung | IAC | response to calcium ion | 31/2061 | 149/18723 | 3.47e-04 | 5.42e-03 | 31 |
| GO:00100388 | Lung | IAC | response to metal ion | 61/2061 | 373/18723 | 1.02e-03 | 1.22e-02 | 61 |
| GO:005159212 | Lung | AIS | response to calcium ion | 30/1849 | 149/18723 | 1.18e-04 | 2.72e-03 | 30 |
| GO:001003813 | Lung | AIS | response to metal ion | 57/1849 | 373/18723 | 5.80e-04 | 9.01e-03 | 57 |
| GO:001003823 | Lung | MIAC | response to metal ion | 36/967 | 373/18723 | 2.40e-04 | 8.06e-03 | 36 |
| GO:005159222 | Lung | MIAC | response to calcium ion | 18/967 | 149/18723 | 6.87e-04 | 1.59e-02 | 18 |
| Page: 1 |
| Pathway ID | Tissue | Disease Stage | Description | Gene Ratio | Bg Ratio | pvalue | p.adjust | qvalue | Count |
| Page: 1 |
Top |
Cell-cell communication analysis |
| Identification of potential cell-cell interactions between two cell types and their ligand-receptor pairs for different disease states |
| Ligand | Receptor | LRpair | Pathway | Tissue | Disease Stage |
| Page: 1 |
Top |
Single-cell gene regulatory network inference analysis |
| Find out the significant the regulons (TFs) and the target genes of each regulon across cell types for different disease states |
| TF | Cell Type | Tissue | Disease Stage | Target Gene | RSS | Regulon Activity |
| ∗The dot plots of a searched regulon are shown for all cell subpopulations in each disease state of each tissue based on the regulon specific score inferred using pySCENIC and by calculating the average expression. |
| Page: 1 |
Top |
Somatic mutation of malignant transformation related genes |
| Annotation of somatic variants for genes involved in malignant transformation |
| Hugo Symbol | Variant Class | Variant Classification | dbSNP RS | HGVSc | HGVSp | HGVSp Short | SWISSPROT | BIOTYPE | SIFT | PolyPhen | Tumor Sample Barcode | Tissue | Histology | Sex | Age | Stage | Therapy Types | Drugs | Outcome |
| CPNE8 | SNV | Missense_Mutation | novel | c.674N>G | p.Tyr225Cys | p.Y225C | Q86YQ8 | protein_coding | deleterious(0.02) | probably_damaging(0.964) | TCGA-A1-A0SD-01 | Breast | breast invasive carcinoma | Female | <65 | I/II | Unknown | Unknown | SD |
| CPNE8 | SNV | Missense_Mutation | novel | c.92N>A | p.Ser31Tyr | p.S31Y | Q86YQ8 | protein_coding | deleterious(0) | possibly_damaging(0.866) | TCGA-BH-A18H-01 | Breast | breast invasive carcinoma | Female | <65 | I/II | Chemotherapy | adriamycin | CR |
| CPNE8 | SNV | Missense_Mutation | rs775774791 | c.1087N>G | p.Leu363Val | p.L363V | Q86YQ8 | protein_coding | deleterious(0.01) | possibly_damaging(0.768) | TCGA-BH-A18K-01 | Breast | breast invasive carcinoma | Female | <65 | I/II | Unknown | Unknown | PD |
| CPNE8 | SNV | Missense_Mutation | novel | c.470N>C | p.Arg157Thr | p.R157T | Q86YQ8 | protein_coding | deleterious(0.01) | benign(0.097) | TCGA-LL-A5YO-01 | Breast | breast invasive carcinoma | Female | <65 | I/II | Chemotherapy | taxotere | CR |
| CPNE8 | SNV | Missense_Mutation | novel | c.622N>A | p.Pro208Thr | p.P208T | Q86YQ8 | protein_coding | deleterious(0) | possibly_damaging(0.802) | TCGA-OL-A5RZ-01 | Breast | breast invasive carcinoma | Female | <65 | I/II | Chemotherapy | doxorubicin | CR |
| CPNE8 | insertion | Frame_Shift_Ins | novel | c.1618_1619insCCCAGAGGACATCAAAGCGTAGAGTCAAAGG | p.Arg540ThrfsTer40 | p.R540Tfs*40 | Q86YQ8 | protein_coding | TCGA-AO-A03T-01 | Breast | breast invasive carcinoma | Female | <65 | I/II | Chemotherapy | cyclophosphamide | SD | ||
| CPNE8 | SNV | Missense_Mutation | c.833A>C | p.Lys278Thr | p.K278T | Q86YQ8 | protein_coding | deleterious(0.05) | possibly_damaging(0.493) | TCGA-AA-3663-01 | Colorectum | colon adenocarcinoma | Male | <65 | I/II | Unknown | Unknown | SD | |
| CPNE8 | SNV | Missense_Mutation | novel | c.91N>C | p.Ser31Pro | p.S31P | Q86YQ8 | protein_coding | deleterious(0) | possibly_damaging(0.811) | TCGA-AA-3977-01 | Colorectum | colon adenocarcinoma | Male | >=65 | I/II | Unknown | Unknown | SD |
| CPNE8 | SNV | Missense_Mutation | c.642N>T | p.Lys214Asn | p.K214N | Q86YQ8 | protein_coding | tolerated(0.09) | benign(0.014) | TCGA-AA-A00N-01 | Colorectum | colon adenocarcinoma | Male | >=65 | I/II | Unknown | Unknown | PD | |
| CPNE8 | SNV | Missense_Mutation | rs754785078 | c.280N>T | p.Arg94Cys | p.R94C | Q86YQ8 | protein_coding | deleterious(0) | probably_damaging(0.988) | TCGA-AA-A00N-01 | Colorectum | colon adenocarcinoma | Male | >=65 | I/II | Unknown | Unknown | PD |
| Page: 1 2 3 4 5 6 7 8 9 |
Top |
Related drugs of malignant transformation related genes |
| Identification of chemicals and drugs interact with genes involved in malignant transfromation |
| (DGIdb 4.0) |
| Entrez ID | Symbol | Category | Interaction Types | Drug Claim Name | Drug Name | PMIDs |
| Page: 1 |

Copyright 2023-Present -The University of Texas Health Science Center at Houston |